. 2021 Mar;4(3):2000243.
doi: 10.1002/adtp.202000243. Epub 2021 Jan 20.

SQ3370 Activates Cytotoxic Drug via Click Chemistry at Tumor and Elicits Sustained Responses in Injected & Non-injected Lesions

Affiliations

SQ3370 Activates Cytotoxic Drug via Click Chemistry at Tumor and Elicits Sustained Responses in Injected & Non-injected Lesions

S Srinivasan et al. Adv Ther (Weinh). 2021 Mar.

Abstract

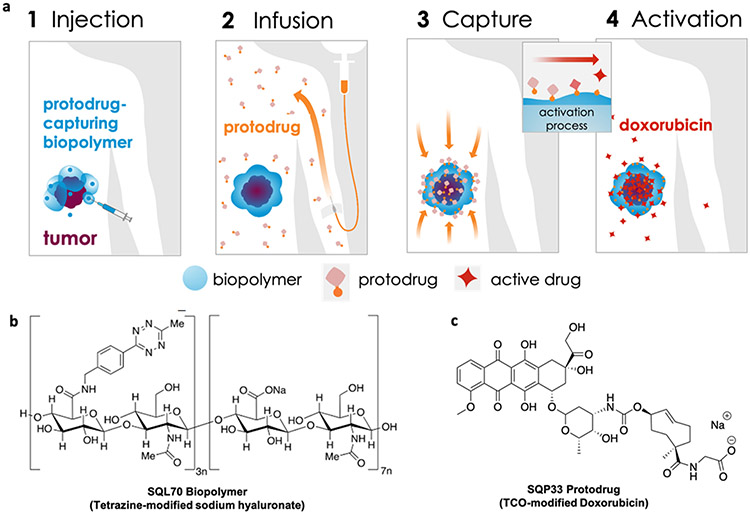
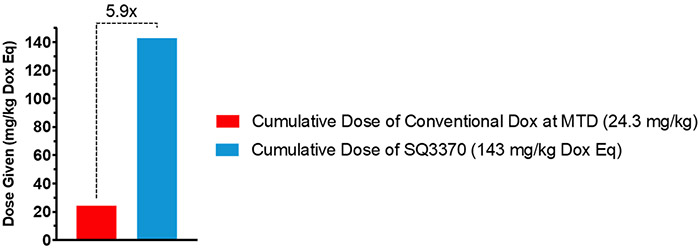
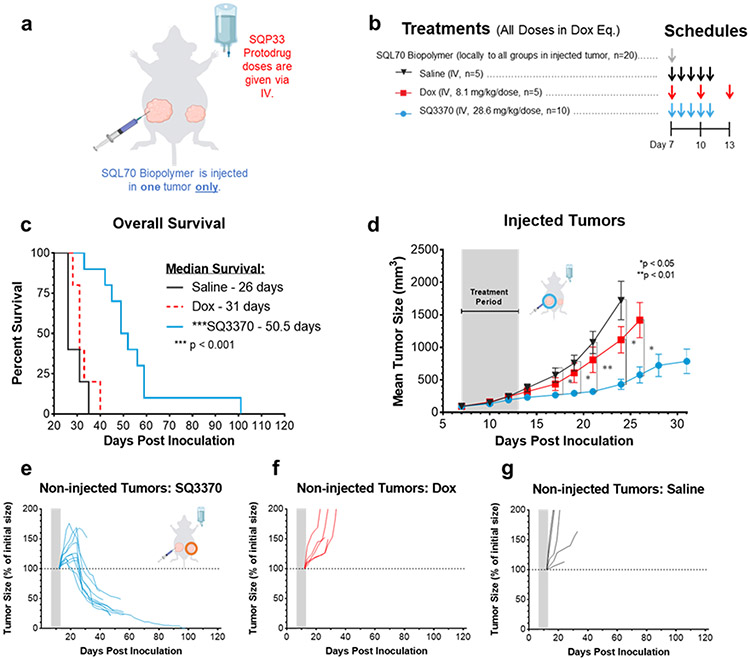
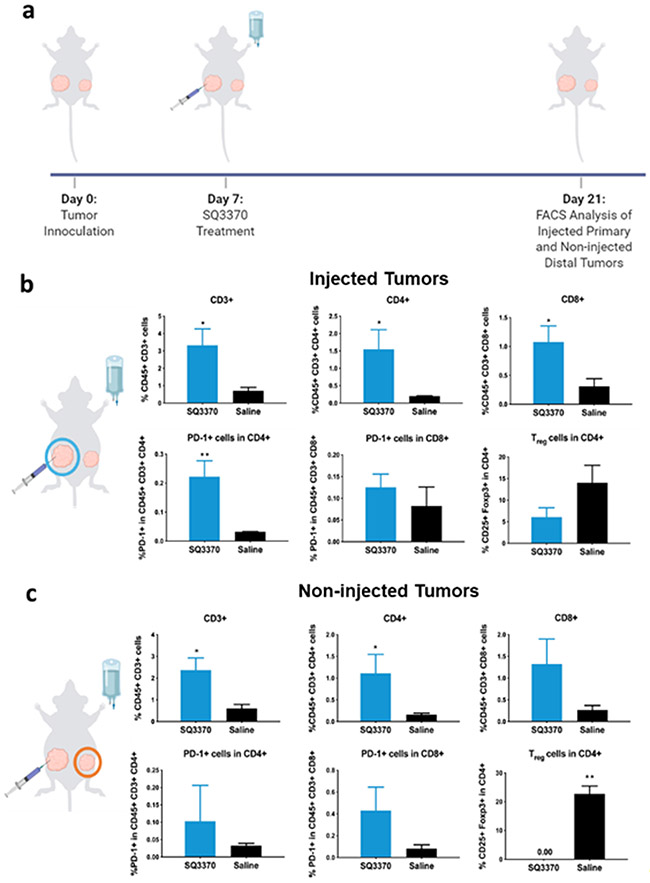
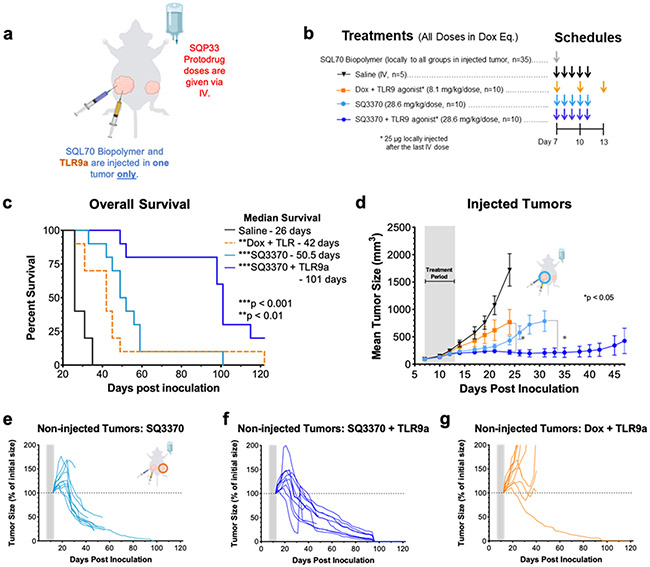
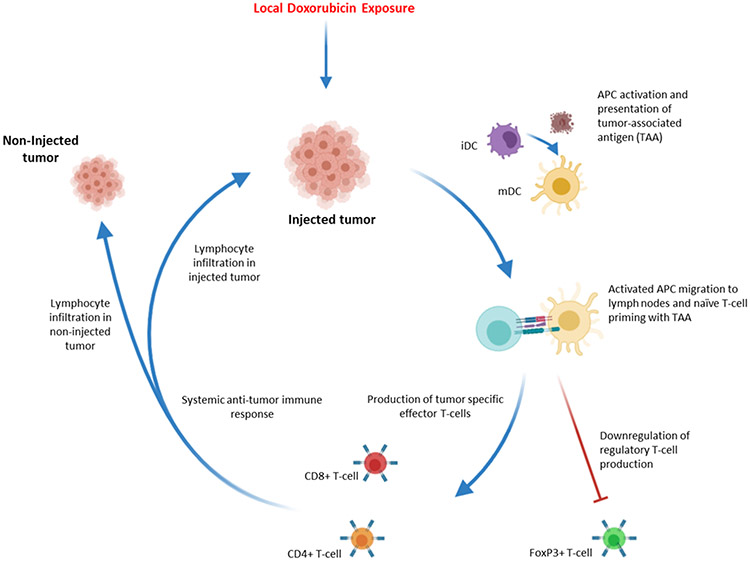
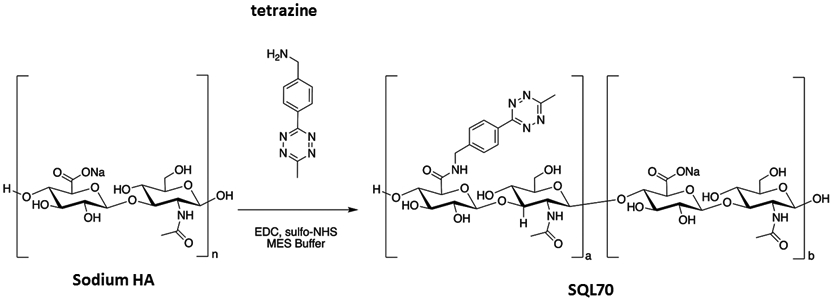
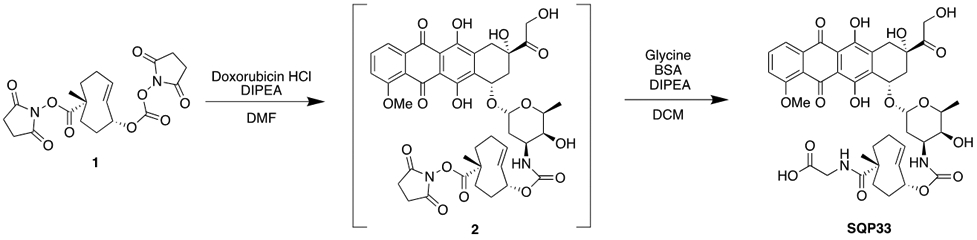
While systemic immuno-oncology therapies have shown remarkable success, only a limited subset of patients benefit from them. Our Click Activated Protodrugs Against Cancer (CAPAC™) Platform is a click chemistry-based approach that activates cancer drugs at a specific tumor with minimal systemic toxicity. CAPAC Platform is agnostic to tumor characteristics that can vary across patients and hence applicable to several types of tumors. We describe the benefits of SQ3370 (lead candidate of CAPAC) to achieve systemic anti-tumor responses in mice bearing two tumors. SQ3370 consists of a biopolymer, injected in a single lesion, followed by systemic doses of an attenuated protodrug™ of doxorubicin (Dox). SQ3370 was well-tolerated at 5.9-times the maximum dose of conventional Dox, increased survival by 63% and induced a systemic anti-tumor response against injected and non-injected lesions. The sustained anti-tumor response also correlated with immune activation measured at both lesions. SQ3370 could potentially benefit patients with micro-metastatic lesions.

Keywords: Bioorthogonal Chemistry; abscopal effect; anenestic response; immuno-oncology; local drug activation; platform technology.


Conflict of interest statement

Conflict of Interest S. Srinivasan, N. A. Yee, M. Zakharian, A. Mahmoodi, J. M. Mejia Oneto are paid employees and shareholders of Shasqi, Inc. (Shasqi). J.M. Mejia Oneto is the Founder and CEO of Shasqi. M. Royzen is a shareholder of Shasqi.

Figures

Figure 1:
Figure 1:. Platform Mechanism and SQ3370 Components.
a) SQL70 biopolymer is locally injected at the tumor site, and SQP33 protodrug is infused systemically. SQP33 protodrug is captured by SQL70 biopolymer at the tumor site through a rapid covalent reaction between tetrazine (blue) and trans-cyclooctene (TCO; orange) moieties, followed by chemical rearrangement to release active Dox. b) SQL70 biopolymer is a tetrazine-modified form of sodium hyaluronate. c) SQP33 protodrug consists of doxorubicin conjugated to a reactive TCO group.
Figure 2:
Figure 2:. Dose Comparison Between Multiple-Dose SQ3370 and Doxorubicin Hydrochloride in Mice
C57BL/6 were treated intravenously with SQ3370 (5 doses of SQP33 protodrug following a single subcutaneous injection of SQL70 biopolymer). Animals given only Dox HCl at the 8.1 mg/kg Q4D x 3 days were used as a control. When given over 5 cycles (28.6 mg/kg QD Dox eq x 5 days), SQP33 was well tolerated at 5.9 times the dose of conventional Dox.
Figure 3:
Figure 3:. SQ3370 treatment — Tumor Response and Overall Survival in Dual-Tumor Mice
a) Treatment schematic for a syngeneic MC38 dual tumor study in immunocompetent C56BL/6 mice. All tumor cells were implanted at Day 0. b) Treatments started at Day 7 with local injection of biopolymer at the primary “injected” tumor, followed by systemic therapies. c) Kaplan-Meier survival curves for treatment groups. d) Tumor growth curves show mean ± SEM of large primary tumors injected with SQL70 biopolymer (injected tumors). e to g) Spider plots showing the growth of individual distal non-injected tumors in SQ3370, Dox, and saline treated groups, respectively. Tumor growth curves of individual non-injected tumors are displayed as a percentage of the initial volume of each tumor (measurement from day 12 post-inoculation) for each treatment group. Data points without errors bars occurred when the standard error was smaller than the symbol used to represent the treatment condition. Curves stopped after 1 or more mice in that group died or were sacrificed when tumor volume reached 2000 mm3. Gray bars represent treatment duration. Statistical significance in tumor growth curves was determined by unpaired t-test with Welch’s correction for each day. Statistical significance in survival was determined by log-rank (Mantel-Cox) test. *P<0.05; **P<0.01;***P<0.001.
Figure 4:
Figure 4:. Tumor-infiltrating immune cell profile at 2 weeks post SQ3370 treatment
a) Primary injected and distal non-injected MC38 tumors were harvested from SQ3370 and saline treated mice and analyzed by flow cytometry 2 weeks after treatment. The b) primary injected tumor and c) distal non-injected tumor samples were stained with a cocktail of antibodies against several markers including CD45, CD3, CD4, CD8, PD-1 and FoxP3. The samples were analyzed by multicolor flow cytometry. Dead cells were excluded from analysis. Figure shows the Mean ± SEM of n=5 as per group of multi-stained cells as a percentage of total cells obtained from the tumor sample. Statistical analysis was done by comparing the means of the SQ3370 group with the saline group using an unpaired t-test with Welch’s correction. *P<0.05; **P<0.01
Figure 5 –
Figure 5 –. SQ3370 treatment with TLR9a— Tumor Growth and Overall Survival in Dual-Tumor Mice.
a) Treatment schematic for a syngeneic MC38 dual tumor study in immunocompetent C56BL/6 mice. All tumor cells were implanted at Day 0. b) Treatments started at Day 7 with local injection of biopolymer at the primary “injected” tumor, followed by systemic therapies and a local injection of 25 ug TLR9a at the “injected” tumor after the last IV dose. c) Kaplan-Meier survival curves for animals treated with Saline, Dox with TLR9a, SQ3370, or SQ3370 with TLR9a . d) Tumor growth curves show mean ± SEM of large primary tumors injected with SQL70 biopolymer (injected tumors). e to g) Spider plots showing the growth of individual distal non-injected tumors in SQ3370, SQ3370 with TLR9a, and Dox with TLR9a treated groups, respectively. Tumor growth curves of individual non-injected tumors are displayed as a percentage of the initial volume of each tumor (measurement from day 12 post-inoculation) for each treatment group. Data points without errors bars occurred when the standard error was smaller than the symbol used to represent the treatment condition. Curves stopped after 1 or more mice in that group died or were sacrificed when tumor volume reached 2000 mm3. Gray bars represent treatment duration. Statistical significance in tumor growth curves was determined by unpaired t-test with Welch’s correction for each day. Statistical significance in survival was determined by log-rank (Mantel-Cox) test. *P<0.05; **P<0.01; ***P<0.001.
Figure 6:
Figure 6:. SQ3370 Local Drug Activation Technology triggers systemic anti-tumor immune response
Local Dox activation and exposure in injected tumor site activates APC cells such as iDCs (immature dendritic cells). Activated cells, now mDCs (mature dendritic cells), migrate to lymph nodes and present tumor associated antigen (TAA) to naïve t-cells. The interaction leads to expansion of tumor specific effector T-cells and down regulation of tumor specific regulatory T-cells. Effector T-cells then move to the periphery and generate a systemic anti-tumor immune response, leading to lymphocyte infiltration into both injected and non-injected tumors.
Scheme 1:
Scheme 1:
Synthesis of SQL70 Biopolymer
Scheme 2:
Scheme 2:
Synthesis of SQP33 Protodrug

Similar articles

Cited by

References

    1. Hegde PS; Chen DS Top 10 Challenges in Cancer Immunotherapy. Immunity. Cell Press; January 14, 2020, pp 17–35. 10.1016/j.immuni.2019.12.011. - DOI - PubMed
    1. Haslam A; Prasad V Estimation of the Percentage of US Patients With Cancer Who Are Eligible for and Respond to Checkpoint Inhibitor Immunotherapy Drugs. JAMA Network Open 2019, 2 (5), e192535. 10.1001/jamanetworkopen.2019.2535. - DOI - PMC - PubMed
    1. Gangadhar TC; Vonderheide RH Mitigating the Toxic Effects of Anticancer Immunotherapy. Nature Reviews Clinical Oncology. Nat Rev Clin Oncol February 2014, pp 91–99. 10.1038/nrclinonc.2013.245. - DOI - PubMed
    1. Tian F; Lu Y; Manibusan A; Sellers A; Tran H; Sun Y; Phuong T; Barnett R; Hehli B; Song F; DeGuzman MJ; Ensari S; Pinkstaff JK; Sullivan LM; Biroc SL; Cho H; Schultz PG; di Joseph J; Dougher M; Ma D; Dushin R; Leal M; Tchistiakova L; Feyfant E; Gerber HP; Sapra P A General Approach to Site-Specific Antibody Drug Conjugates. Proceedings of the National Academy of Sciences of the United States of America 2014, 111 (5), 1766–1771. 10.1073/pnas.1321237111. - DOI - PMC - PubMed
    1. Rosenblum D; Joshi N; Tao W; Karp JM; Peer D Progress and Challenges towards Targeted Delivery of Cancer Therapeutics. Nature Communications 2018, 9 (1), 1410. 10.1038/s41467-018-03705-y. - DOI - PMC - PubMed

LinkOut - more resources