. 2021 Mar 17:21:37-46.
doi: 10.1016/j.omto.2021.03.008. eCollection 2021 Jun 25.

IFN-I-tolerant oncolytic Semliki Forest virus in combination with anti-PD1 enhances T cell response against mouse glioma

Affiliations

IFN-I-tolerant oncolytic Semliki Forest virus in combination with anti-PD1 enhances T cell response against mouse glioma

Miika Martikainen et al. Mol Ther Oncolytics. .

Abstract

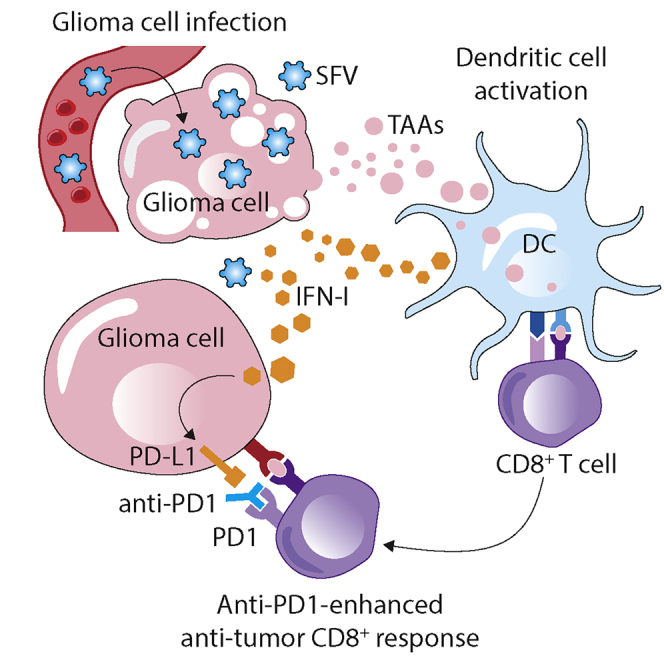
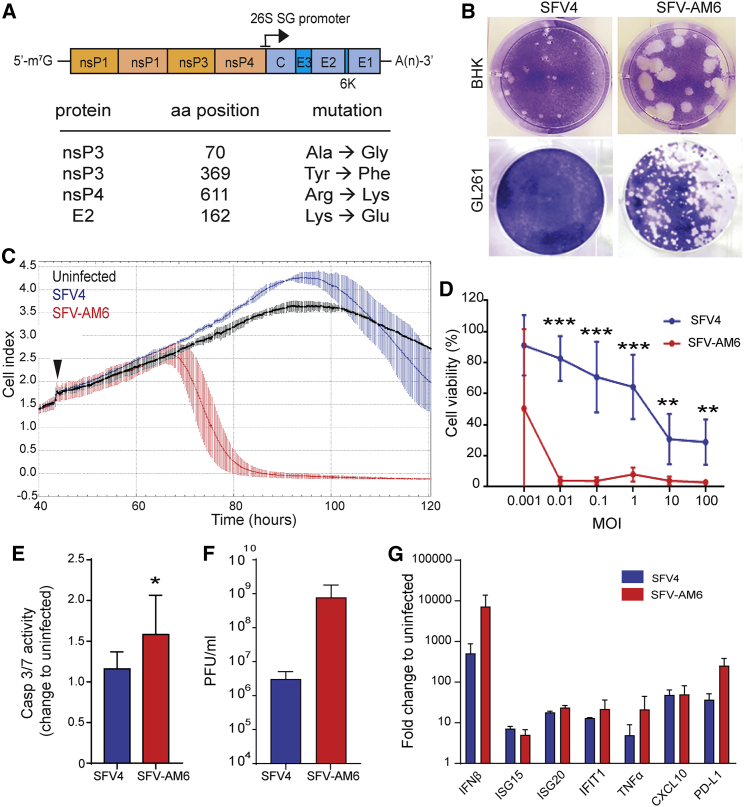
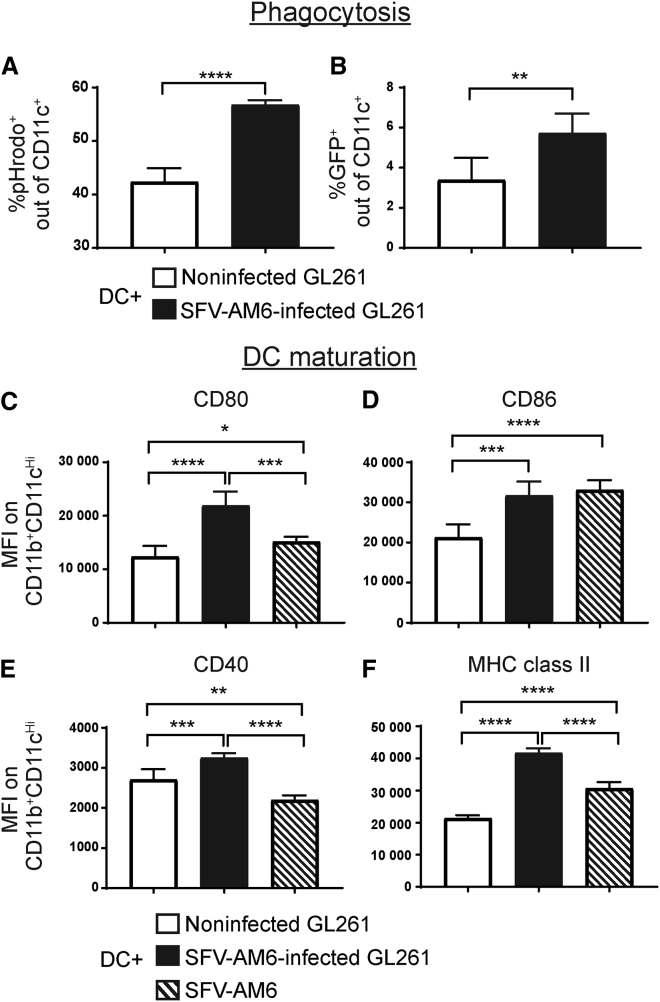
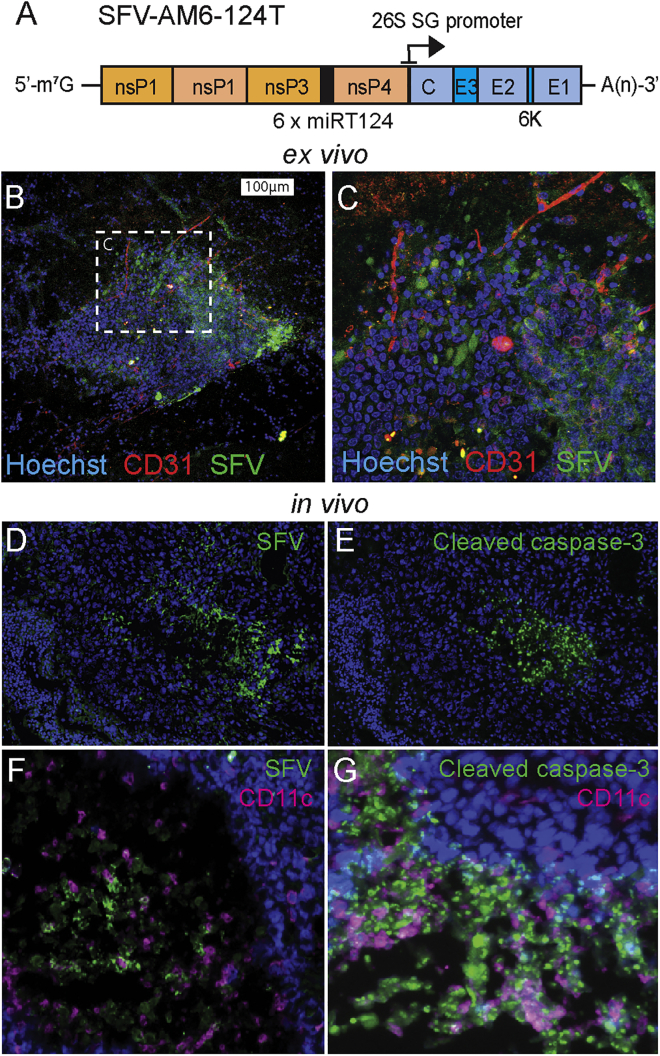
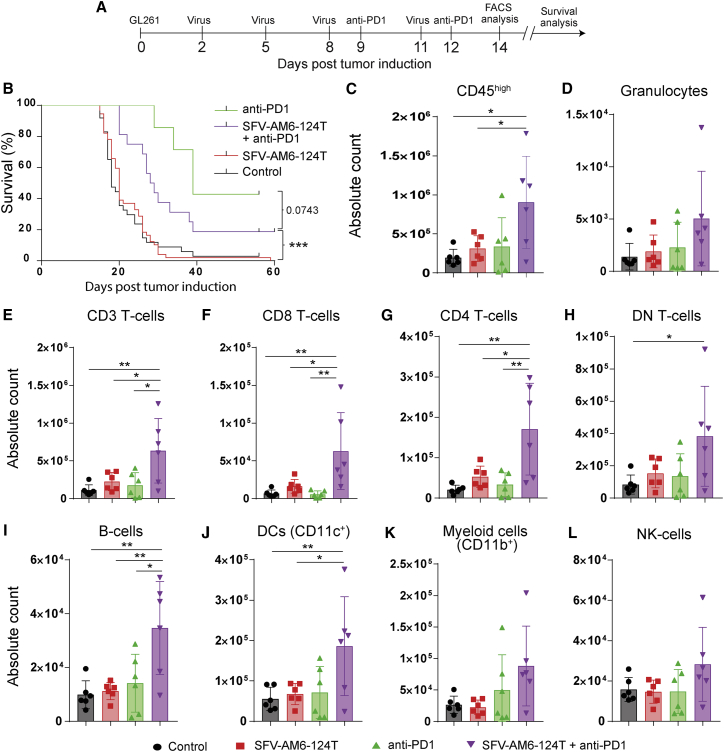
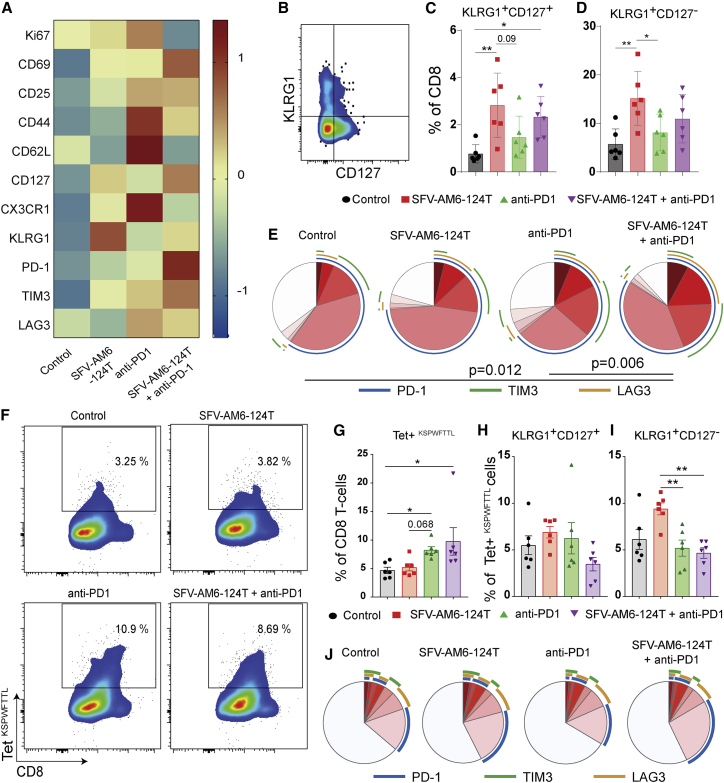
Oncolytic virotherapy holds promise of effective immunotherapy against otherwise nonresponsive cancers such as glioblastoma. Our previous findings have shown that although oncolytic Semliki Forest virus (SFV) is effective against various mouse glioblastoma models, its therapeutic potency is hampered by type I interferon (IFN-I)-mediated antiviral signaling. In this study, we constructed a novel IFN-I-resistant SFV construct, SFV-AM6, and evaluated its therapeutic potency in vitro, ex vivo, and in vivo in the IFN-I competent mouse GL261 glioma model. In vitro analysis shows that SFV-AM6 causes immunogenic apoptosis in GL261 cells despite high IFN-I signaling. MicroRNA-124 de-targeted SFV-AM6-124T selectively replicates in glioma cells, and it can infect orthotopic GL261 gliomas when administered intraperitoneally. The combination of SFV-AM6-124T and anti-programmed death 1 (PD1) immunotherapy resulted in increased immune cell infiltration in GL261 gliomas, including an increased tumor-reactive CD8+ fraction. Our results show that SFV-AM6-124T can overcome hurdles of innate anti-viral signaling. Combination therapy with SFV-AM6-124T and anti-PD1 promotes the inflammatory response and improves the immune microenvironment in the GL261 glioma model.

Keywords: Alphavirus; Semliki Forest virus; anti-PD1; anti-tumor T cells; cancer immunotherapy; glioblastoma; immune checkpoint inhibitors; oncolytic virotherapy; type I interferon.


Conflict of interest statement

The authors declare no competing interests.

Figures

None
Graphical abstract
Figure 1
Figure 1
SFV-AM6 shows enhanced oncolytic potency in GL261 cells in vitro (A) Schematic presentation of the SFV-AM6 genome. (B) Representative images of plaques produced by SFV4 and SFV-AM6 in the BHK-21 and GL261 cell lines. (C) Analysis of cell attachment (cell index) with the xCELLigence system (mean ± SD). GL261 cells infected with SFV4 (blue), SFV-AM6 (red) at an MOI of 0.01, or left uninfected (black) (n = 5) are shown. The time point of infection is marked with a black arrowhead. (D) Cell viability of infected GL261 cells was measured with an MTS assay (mean ± SD) 72 h after infection using various MOIs. (E) Caspase-3/7 activity (mean ± SD) in GL261 cells 16 h after infection at an MOI of 1. (F) Virus titers measured (mean ± SD) by plaque titration 24 h after infection at an MOI of 0.01. (G) qRT-PCR analysis of interferon (IFN)-β and indicated IFN-stimulated genes (ISGs) in GL261 cells, 16 h after infection at an MOI of 1 with SFV4 (blue) or SFV-AM6 (red). Data are plotted as mean ± SD. IFIT1, IFN-induced protein with tetratricopeptide repeats 1; TNF, tumor necrosis factor; CXCL10, C-X-C motif chemokine 10; PD-L1; programmed death-ligand 1. Statistical analysis was performed by a Student’s two-tailed, unpaired t test. ∗p < 0.05, ∗∗p < 0.01, ∗∗∗p < 0.001.
Figure 2
Figure 2
SFV-AM6 infection of GL261 cells triggers phagocytosis and maturation in co-cultured dendritic cells (DCs) (A and B) Flow cytometry analysis of DC phagocytic activity. (A) Percentage of pHrodo reagent-positive DCs (CD11c+) after co-culture with noninfected or SFV-AM6-infected GL261 cells. (B) Analysis of direct GL261-GFP cell phagocytosis by DCs. Percentage of GFP+CD11c+ DCs after co-culture with noninfected or SFV-AM6-infected GL261-GFP cells. (C–F) Mean fluorescence intensity (MFI) of DC maturation markers, CD80 (C), CD86 (D), CD40 (E), and MHC class II (F) on DCs (CD11chigh/CD11b+ cells) co-cultured with SFV-AM6-infected GL261 cells. Noninfected GL261 cells or SFV-AM6 virus alone was used as a control. Data are plotted as mean ± SD. Statistical analysis was done by a two-tailed, unpaired t test. ∗p < 0.05, ∗∗p < 0.01, ∗∗∗p < 0.001.
Figure 3
Figure 3
SFV-AM6-124T infects GL261 tumors ex vivo and in vivo (A) Schematic presentation of the SFV-AM6-124T genome. (B and C) 50,000 PFUs of SFV-AM6-124T virus was added on top of brain slice cultures with GL261 tumors. Samples were fixed 2 days after infection and stained with anti-SFV antibody (green), anti-CD31 (red), and Hoechst (blue). (C) Magnified image of the infected tumor area. (D–G) Intraperitoneally administered SFV-AM6-124T infects GL261 brain tumor in vivo. Representative images from oncolytic regions in orthotopic GL261 tumors from mice treated with SFV-AM6-124T. (D) Staining for SFV proteins in GL261 sample collected from SFV-AM6-124T-treated mice 2 days after last virus dose. Nuclei were stained with Hoechst (blue). (E) Staining for cleaved caspase-3 in the same sample as in (D). (F and G) Sample collected from SFV-AM6-124T-treated mice at the endpoint. (F) Staining for SFV proteins (green) and CD11c (magenta). (G) Staining for cleaved caspase-3 (green) and CD11c (magenta).
Figure 4
Figure 4
Intraperitoneally injected SFV-AM6-124T increases immune cell infiltration in orthotopic GL261 gliomas (A) Mouse treatment scheme. (B) Kaplan-Meier plot of GL261-bearing mice either treated with SFV-AM6-124T (n = 26), anti-PD1 (n = 7), SFV-AM6-124T + anti-PD1 combination (n = 16), or left untreated (n = 24). (C–F) Flow cytometry analysis of CD45+ cells that were isolated from the brains of GL261-bearing mice after different treatments (n = 6). Absolute counts of CD45high cells (C), CD3+ cells (D), CD8+ T cells (E), CD4+ T cells (F), CD3+CD4CD8 double-negative (DN) T cells (G), B cells (H), DCs (I), granulocytes (J), CD11b+ myeloid cells (K), and NK cells (L). Data are plotted as mean ± SD. Statistical analysis was done by one-way ANOVA with Tukey’s post hoc test. ∗p < 0.05, ∗∗p < 0.01, ∗∗∗p < 0.001.
Figure 5
Figure 5
SFV-AM6-124T promotes a distinct CD8+ T cell phenotype in GL261 gliomas (A) MFI heatmap of Ki67, CD69, CD25, CD44, CD62L, CD127, CX3CR1, KLRG1, PD1, TIM3, and LAG3 expression in CD8+ T cells from control and treated tumors. (B) Flow cytometry gating strategy for quantification of KLRG1 and CD127-expressing CD8+ T cells. (C and D) Quantification of KLRG1+/CD127 (C) and KLRG1+/CD127+ (D) cells. (E) Quantification of PD-1, TIM3, and LAG3 co-expression on CD8 T cells with SPICE software. Colors of the pie arcs depict the expression of individual inhibitory receptors, while the pie depicts the average proportion of co-expressed inhibitory receptors. (F) Bivariate plots showing staining for tetramer (Kb-restricted peptide amino acids 604–611 of p15E protein [KSPWFTTL]) on tumor-infiltrating CD8 T cells, and (G) the quantification of tumor-infiltrating tetramer+ CD8 T cells in each treatment group. (H and I) Quantification of KLRG1+/CD127 (H) and KLRG1+/CD127+ (I) tetramer+ CD8 T cell subpopulation. (J) Quantification of PD-1, TIM3, and LAG3 co-expression on tetramer+ CD8 T cells with SPICE software. Panels C, D, G, H and I are plotted as mean ± SD. Statistical analysis was done with one-way ANOVA with Tukey’s post hoc test (C, D, H and I) or Kruskal-Wallis with Dunn's post hoc test (G). ∗p < 0.05, ∗∗p < 0.01, ∗∗∗p < 0.001.

Similar articles

Cited by

References

    1. Louis D.N., Perry A., Reifenberger G., von Deimling A., Figarella-Branger D., Cavenee W.K., Ohgaki H., Wiestler O.D., Kleihues P., Ellison D.W. The 2016 World Health Organization Classification of Tumors of the Central Nervous system: A summary. Acta Neuropathol. 2016;131:803–820. - PubMed
    1. Stupp R., Mason W.P., van den Bent M.J., Weller M., Fisher B., Taphoorn M.J.B., Belanger K., Brandes A.A., Marosi C., Bogdahn U., European Organisation for Research and Treatment of Cancer Brain Tumor and Radiotherapy Groups. National Cancer Institute of Canada Clinical Trials Group Radiotherapy plus concomitant and adjuvant temozolomide for glioblastoma. N. Engl. J. Med. 2005;352:987–996. - PubMed
    1. Ostrom Q.T., Gittleman H., Liao P., Vecchione-Koval T., Wolinsky Y., Kruchko C., Barnholtz-Sloan J.S. CBTRUS statistical report: Primary brain and other central nervous system tumors diagnosed in the United States in 2010–2014. Neuro-oncol. 2017;19(Suppl 5):v1–v88. - PMC - PubMed
    1. Desjardins A., Gromeier M., Herndon J.E., 2nd, Beaubier N., Bolognesi D.P., Friedman A.H., Friedman H.S., McSherry F., Muscat A.M., Nair S. Recurrent glioblastoma treated with recombinant poliovirus. N. Engl. J. Med. 2018;379:150–161. - PMC - PubMed
    1. Lang F.F., Conrad C., Gomez-Manzano C., Yung W.K.A., Sawaya R., Weinberg J.S., Prabhu S.S., Rao G., Fuller G.N., Aldape K.D. Phase I study of DNX-2401 (Delta-24-RGD) oncolytic adenovirus: Replication and immunotherapeutic effects in recurrent malignant glioma. J. Clin. Oncol. 2018;36:1419–1427. - PMC - PubMed

LinkOut - more resources