. 2021 Jan 20:21:74-86.
doi: 10.1016/j.omto.2021.01.008. eCollection 2021 Jun 25.

LINC00461 facilitates HNSCC development and reduces chemosensitivity by impairing miR-195-mediated inhibition of HOXA10

Affiliations

LINC00461 facilitates HNSCC development and reduces chemosensitivity by impairing miR-195-mediated inhibition of HOXA10

Yifang Guan et al. Mol Ther Oncolytics. .

Abstract

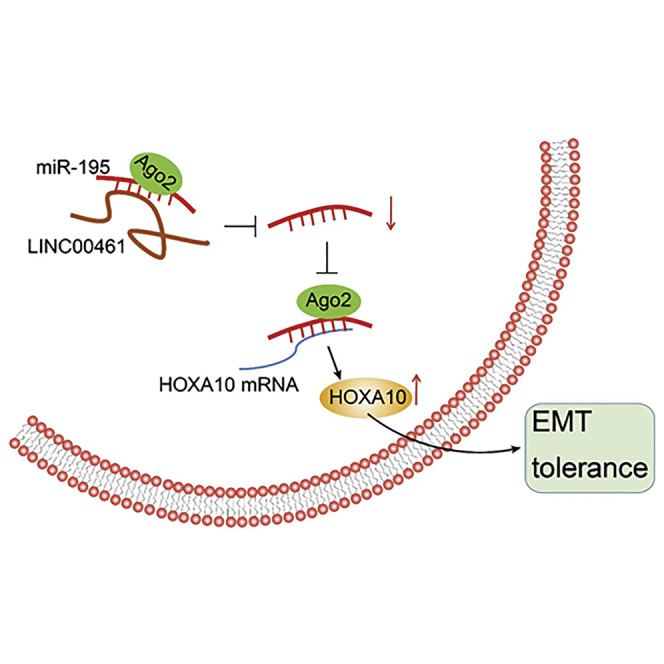
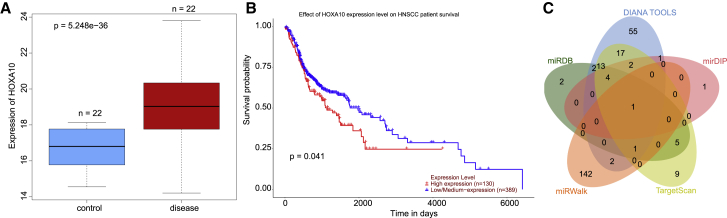
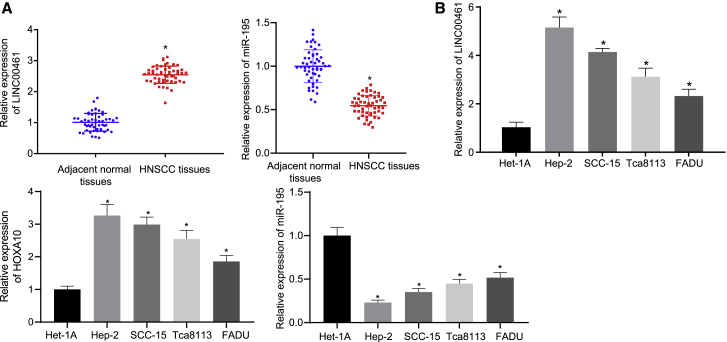
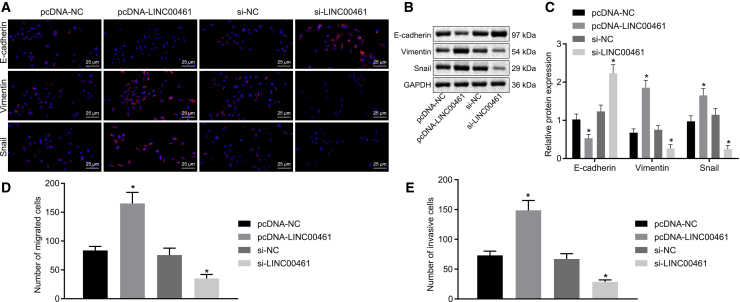
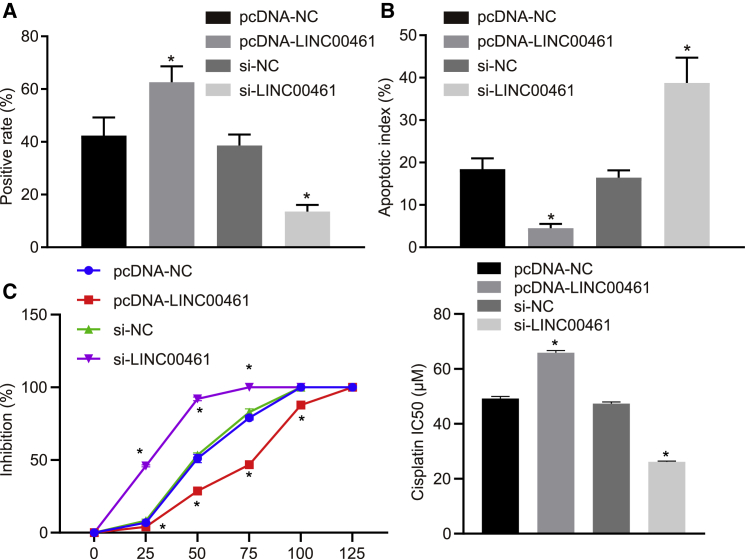
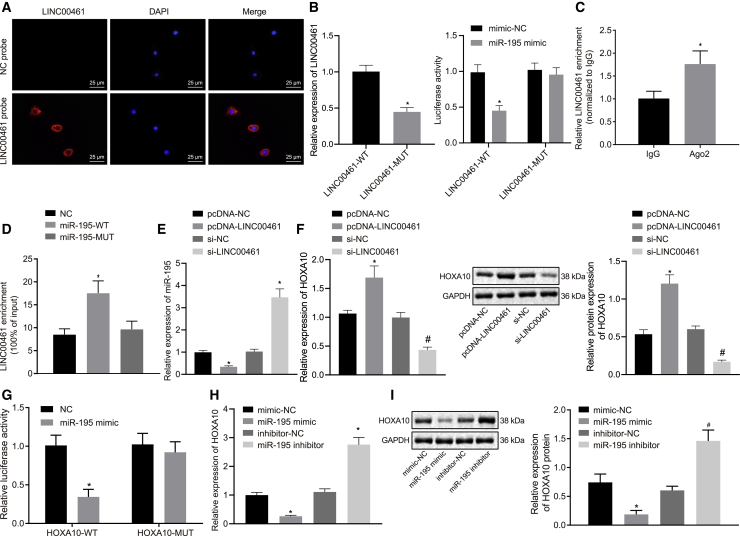
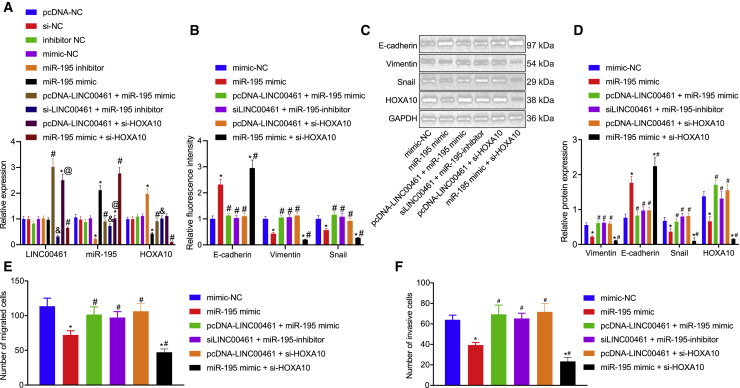
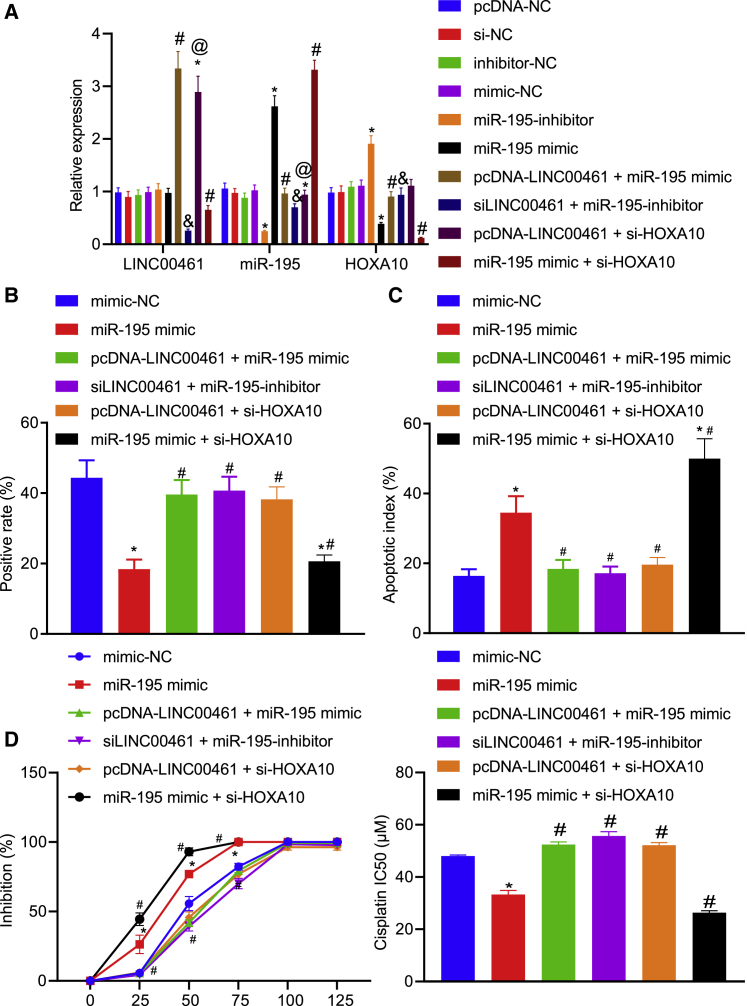
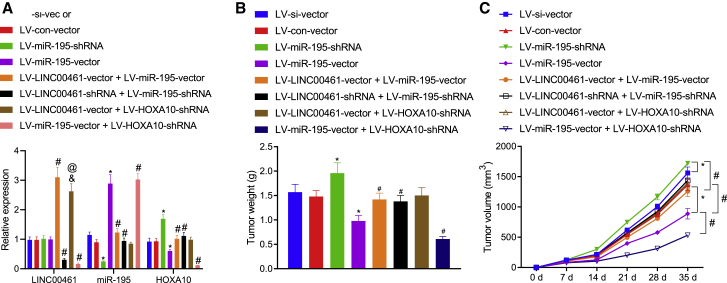
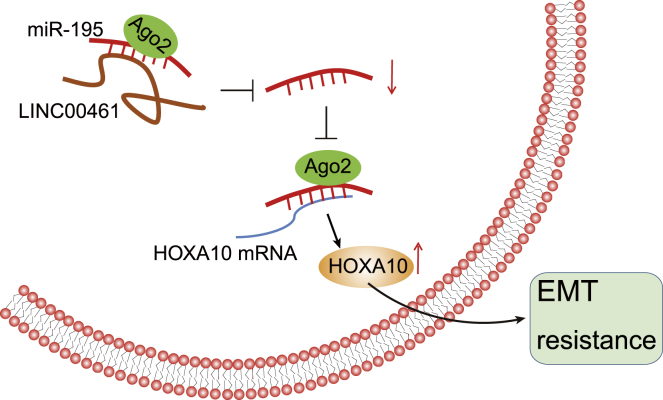
Homeobox A10 (HOXA10) has been regarded to serve as an oncogene in head and neck squamous cell carcinoma (HNSCC). This study was intended to explore the interaction among the long intergenic noncoding RNA 00461 (LINC00461), microRNA (miR)-195, and HOXA10, and to investigate its role in epithelial-mesenchymal transition (EMT) and chemoresistance in HNSCC. The effects of LINC00461, miR-195, and HOXA10 on the EMT and chemoresistance of HNSCC cells were analyzed by comprehensive analysis of gain- and loss-of-function techniques. The intimate relationships among LINC00461, miR-195, and HOXA10 were investigated by several procedures such as RNA-binding protein immunoprecipitation, RNA pull-down, and dual-luciferase reporter assays. A xenotransplantation tumor model in nude mice was established for the assessment of the tumorigenic ability of the cells in vivo. Our findings indicated that LINC00461 was highly expressed in HNSCC and its overexpression induced EMT and precipitated the chemoresistance of HNSCC cells to cisplatin. The LINC00461 could bind to miR-195 while miR-195 targeted HOXA10 independently. Moreover, LINC00461 impaired miR-195-mediated inhibition of HOXA10 to induce EMT and increase the chemoresistance in HNSCC. Tumor weight and volume were reduced by lentivirus-mediated elevation of miR-195 by inhibition of HOXA10, which could be annulled by LINC00461 overexpression. LINC00461 downregulates the expression of miR-195 to subsequently upregulate the expression of HOXA10, thereby promoting EMT and enhancing chemoresistance in HNSCC.

Keywords: chemoresistance; epithelial-mesenchymal transition; head and neck squamous cell carcinoma; homeobox A10; long intergenic noncoding RNA 00461; microRNA-195.


Conflict of interest statement

The authors declare no competing interests.

Figures

None
Graphical abstract
Figure 1
Figure 1
LINC00461 may regulate HOXA10 through binding to miR-195 in HNSCC (A) The boxplot of HOXA10 expression pattern in HNSCC from dataset GSE108061; the blue box at left refers to HOXA10 expression pattern in normal tissues and red box at right refers to HOXA10 expression pattern in the HNSCC tissues (p = 5.248e–36). The sample size for both control and HNSCC tumor is 22, and the y axis represents the expression pattern of HOXA10 relative to housekeeping genes. (B) The survival curves concerning the HOXA10 expression pattern obtained from the TCGA database (https://portal.gdc.cancer.gov), as analyzed by the ualcan tool (http://ualcan.path.uab.edu) (p = 0.041). High expression pattern indicates the TPM value greater than or equal to the upper quartile- low/moderate expression pattern indicates the TPM value less than the upper quartile. (C) Venn diagram of the miRNAs that could regulate HOXA10 predicted by the miRDB (http://www.mirdb.org) (dark green), DIANA TOOLS (http://diana.imis.athena-innovation.gr/DianaTools) (blue), mirDIP (http://ophid.utoronto.ca/mirDIP/) (pink), TargetScan (http://www.targetscan.org/vert_71/) (grass green), and miRWalk databases (http://mirwalk.umm.uni-heidelberg.de) (orange).
Figure 2
Figure 2
High expression pattern of LINC00461 and HOXA10, yet poor miR-195 expression in HNSCC (A) Expression pattern of LINC00176, HOXA10, and miR-195 in the adjacent normal (n = 52) and HNSCC tissues (n = 52). (B) Expression pattern of LINC00461, miR-195, and HOXA10 in the normal head and neck squamous cell lines and HNSCC cell lines. All of the data were measurement data expressed as means ± standard deviations. The data between HNSCC tissues and adjacent normal tissues were compared by paired t test. The data among multiple groups were compared by 1-way ANOVA. The experiment was conducted 3 times independently. ∗p < 0.05 versus adjacent normal tissues or Het-1A cells.
Figure 3
Figure 3
LINC00461 induces the EMT process in HNSCC (A) Immunofluorescence detection of EMT-related factors E-cadherin, Snail, and Vimentin in the HNSCC cell line FADU (400×). Three groups of red fluorescence represent E-cadherin, Snail, and Vimentin proteins, respectively, and blue fluorescence represents nuclei. (B) The protein bands of EMT-related factors E-cadherin, Snail, and Vimentin in the HNSCC cell line FADUs. (C) Quantitative analysis of (B). (D) The number of migrated FADU cells. (E) The number of invasive FADU cells. All of the data are measurement data and expressed as means ± standard deviations. The data among multiple groups were compared using 1-way ANOVA. The experiment was conducted 3 times independently. ∗p < 0.05 versus the pcDNA-NC group or the si-NC group.
Figure 4
Figure 4
Silencing of LINC00461 inhibits chemoresistance of HNSCC to cisplatin (A) The proliferation of HNSCC cell line FADU/DDP. Red fluorescence represents proliferated cells and blue fluorescence represents nuclei. (B) The apoptosis rate of HNSCC cell line FADU/DDP. (C) The resistance to cisplatin in HNSCC cell line FADU/DDP. All of the data were measurement data expressed as means ± standard deviations. The data among multiple groups were compared using 1-way ANOVA. The experiment was conducted 3 times independently. ∗p < 0.05 versus the pcDNA-NC group or the si-NC group.
Figure 5
Figure 5
LINC00461 regulates the HOXA10 expression pattern by competitively binding to miR-195 (A) LINC00461 subcellular localization (400×). (B) The luciferase activity of LINC00461-WT and LINC00461-MUT in cells transfected with miR-195 mimic. (C) The binding of LINC00461 and Ago2 protein. (D) The binding of LINC00461 to miR-195. (E) The expression pattern of miR-195 in FADU cells overexpressing LINC00461. (F) The expression pattern of HOXA10 after overexpression or silencing LINC00461 in FADU cells. (G) The relationship between HOXA10 and miR-195. (H) The mRNA expression pattern of HOXA10 in FADU cells with miR-195 mimic. (I) Western blot analysis of the HOXA10 protein in FADU cells with miR-195 mimic. All of the data were measurement data expressed as means ± standard deviations. The data comparison between the 2 groups was performed with unpaired t test, and data among multiple groups were compared using 1-way ANOVA. The experiment was conducted 3 times independently. In (C), ∗p < 0.05 versus the IgG group. In (D) and (G), ∗p < 0.05 versus the NC group. In (E), ∗p < 0.05 versus the pcDNA-NC group; #p < 0.05 versus the si-NC group. In (B), (H), and (I), ∗p < 0.05 versus the mimic-NC group; #p < 0.05 versus the inhibitor-NC group.
Figure 6
Figure 6
The LINC00461/miR-195/HOXA10 axis mediates the EMT process in HNSCC (A) The expression of LINC00461, miR-195 and HOXA10 in the FADU cells. (B) Statistical graph of the expression of EMT-related factors E-cadherin, N-cadherin, and Vimentin in the FADU cells. (C) Protein bands of EMT-related factors E-cadherin, N-cadherin, and Vimentin in the FADU cells. (D) Quantitative analysis of (C). (E) Transwell assay showing the migration ability of the FADU cells. (F) Transwell assay showing the invasion ability of the FADU cells. All of the data were measurement data expressed as means ± standard deviations. The data among multiple groups were compared using 1-way ANOVA. The experiment was conducted 3 times independently. ∗p < 0.05 versus the mimic-NC group. #p < 0.05 versus the miR-195 mimic group. &p < 0.05 versus the miR-195-inhibitor group. @p < 0.05 versus the pcDNA-LINC00461 + miR-195 mimic group.
Figure 7
Figure 7
The LINC00461/miR-195/HOXA10 axis mediates chemoresistance of HNSCC cells (A) The expression of LINC00461, miR-195, and HOXA10 in the FADU cells detected by qRT-PCR. (B) The proliferative capacity of FADU/DDP cells. Red fluorescence represents proliferated cells and blue fluorescence represents nuclei. (C) The apoptosis rate of FADU/DDP cells. (D) Dose detection and data statistics of cisplatin IC50 following varied treatments. All of the data were measurement data expressed as means ± standard deviations. The data among multiple groups were compared using 1-way ANOVA. The experiment was conducted 3 times independently. ∗p < 0.05 versus the mimic-NC group. #p < 0.05 versus the miR-195 mimic group. &p < 0.05 versus the miR-195-inhibitor group. @p < 0.05 versus the pcDNA-LINC00461 + miR-195 mimic group.
Figure 8
Figure 8
Tumorigenesis in mice is enhanced by LINC00461 by blocking miR-195-mediated inhibition of HOXA10 (A) The expression of LINC00461, miR-195, and HOXA10. (B) Tumor weight in nude mice. (C) Tumor volume in nude mice. All of the data were measurement data expressed as means ± standard deviations. The data among multiple groups were compared using 1-way ANOVA or repeated-measures ANOVA. n = 7 for BALB/c-nu mice following each treatment per experimental xenograft. ∗p < 0.05 versus the LV-si-vector or LV-con-vector group. #p < 0.05 versus the LV-miR-195-shRNA or LV-miR-195-vector group. &p < 0.05 versus LV-LINC00461-vector + LV-miR-195-vector group. @p < 0.05 versus the LV-LINC00461-vector + LV-miR-195-shRNA group.
Figure 9
Figure 9
The graphical summary of the function and mechanism of LINC00461 in HNSCC LINC00461 competitively binds to miR-195 to upregulate HOXA10 expression, thereby inducing EMT and enhancing chemoresistance of HNSCC cells.

Similar articles

Cited by

References

    1. Solomon B., Young R.J., Rischin D. Head and neck squamous cell carcinoma: Genomics and emerging biomarkers for immunomodulatory cancer treatments. Semin. Cancer Biol. 2018;52:228–240. - PubMed
    1. Marur S., Forastiere A.A. Head and neck squamous cell carcinoma: update on epidemiology, diagnosis, and treatment. Mayo Clin. Proc. 2016;91:386–396. - PubMed
    1. Rieke D.T., Klinghammer K., Keilholz U. Targeted therapy of head and neck cancer. Oncol. Res. Treat. 2016;39:780–786. - PubMed
    1. Deneka A.Y., Einarson M.B., Bennett J., Nikonova A.S., Elmekawy M., Zhou Y., Lee J.W., Burtness B.A., Golemis E.A. Synthetic lethal targeting of mitotic checkpoints in hpv-negative head and neck cancer. Cancers (Basel) 2020;12:306. - PMC - PubMed
    1. Kaidar-Person O., Gil Z., Billan S. Precision medicine in head and neck cancer. Drug Resist. Updat. 2018;40:13–16. - PubMed

LinkOut - more resources