. 2021 Mar 10;24(4):102290.
doi: 10.1016/j.isci.2021.102290. eCollection 2021 Apr 23.

A single-cell genomics pipeline for environmental microbial eukaryotes

Affiliations

A single-cell genomics pipeline for environmental microbial eukaryotes

Doina Ciobanu et al. iScience. .

Abstract

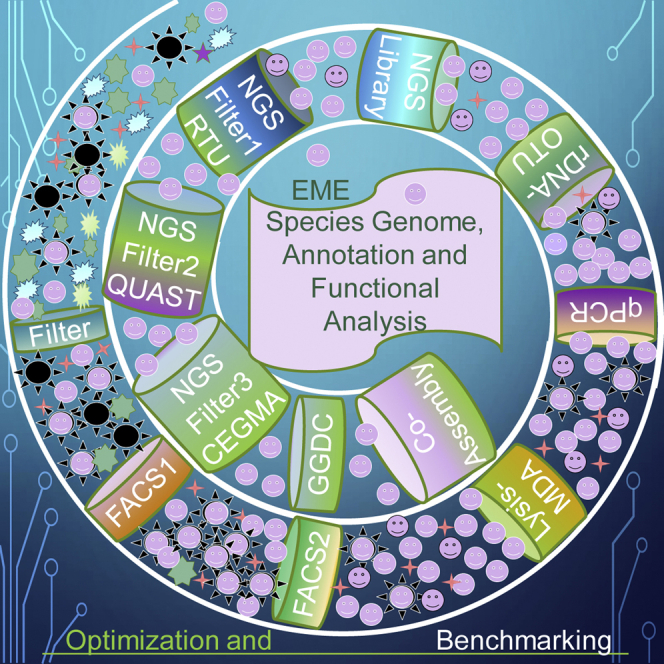
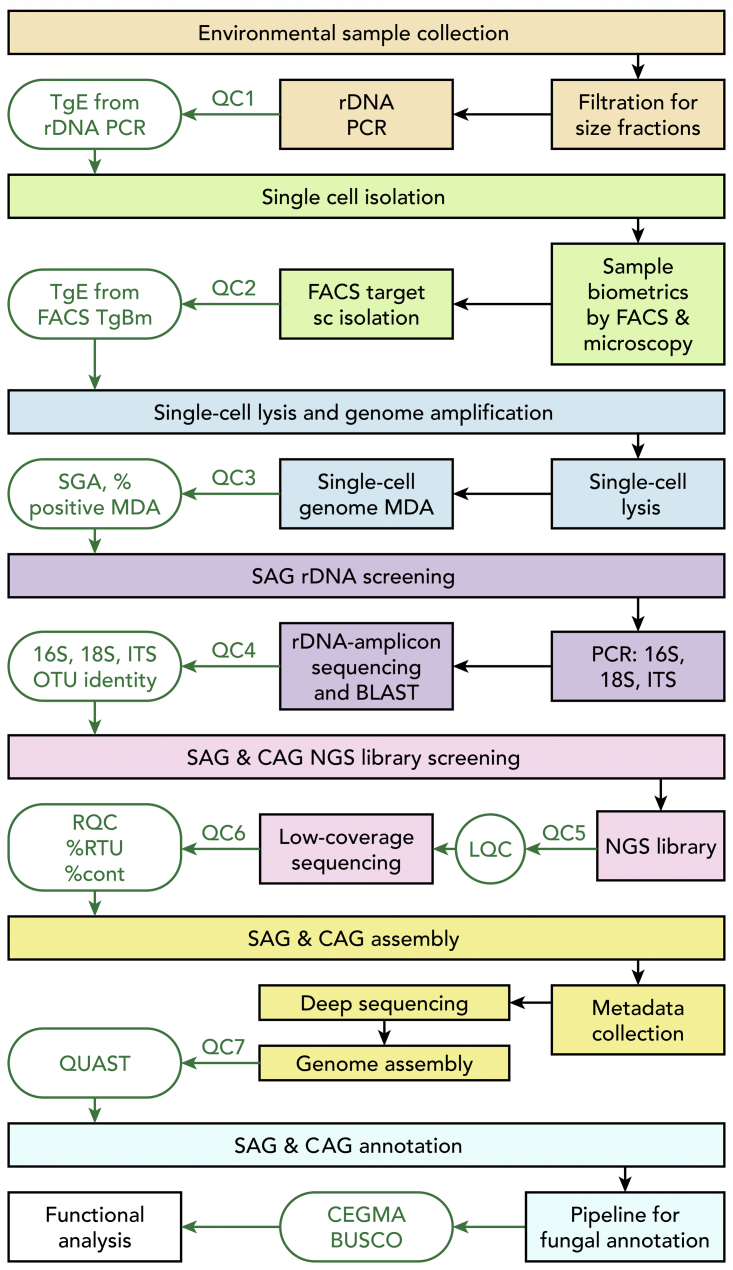
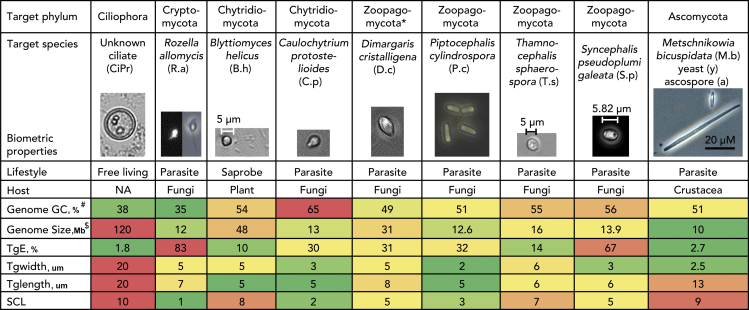
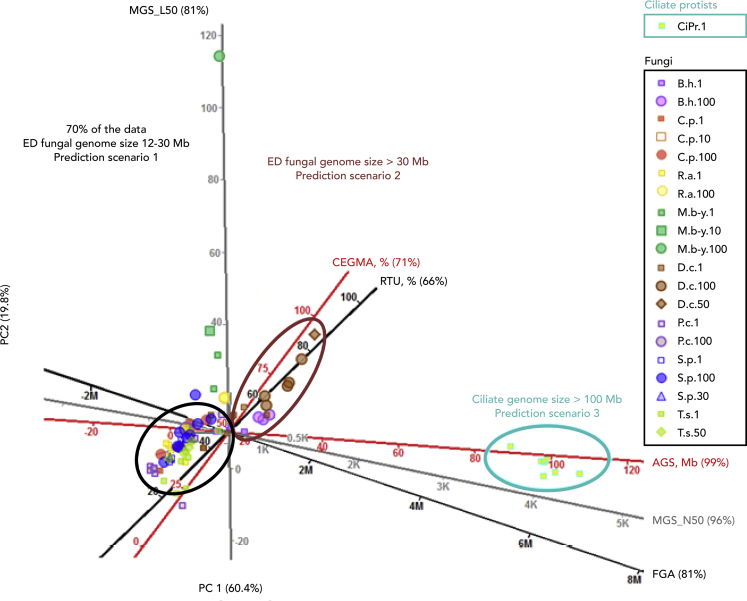
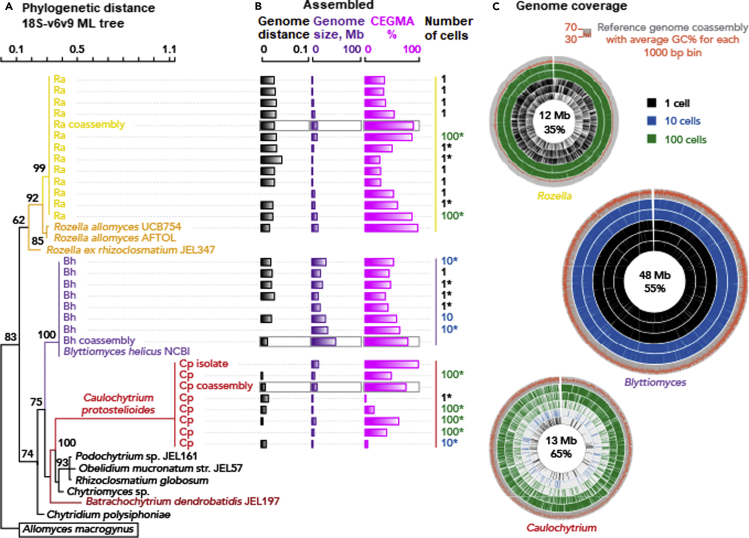
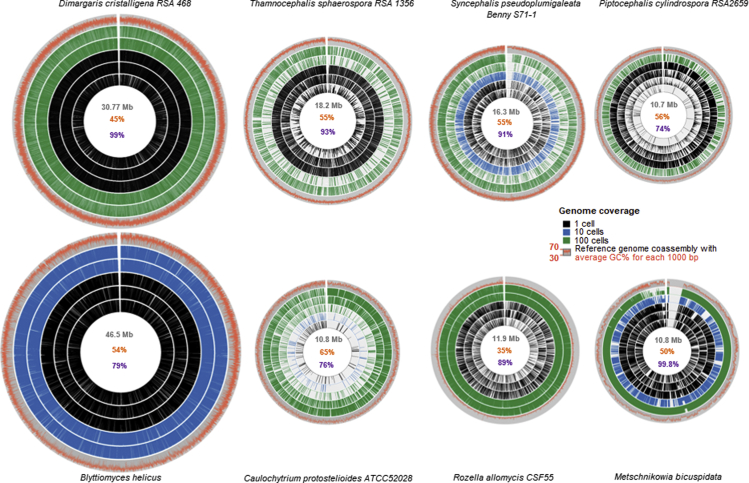
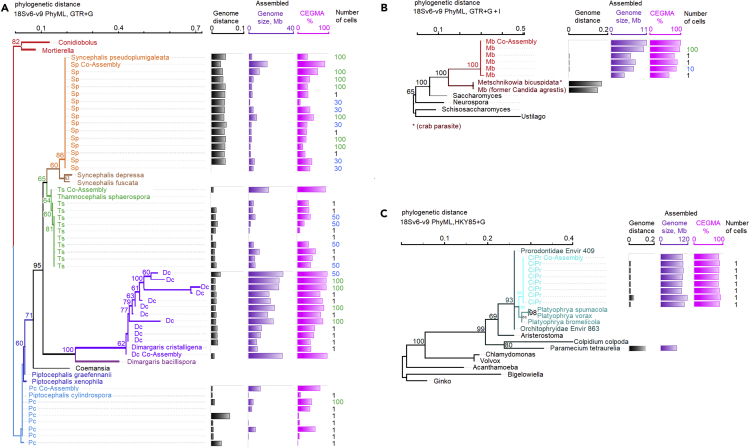
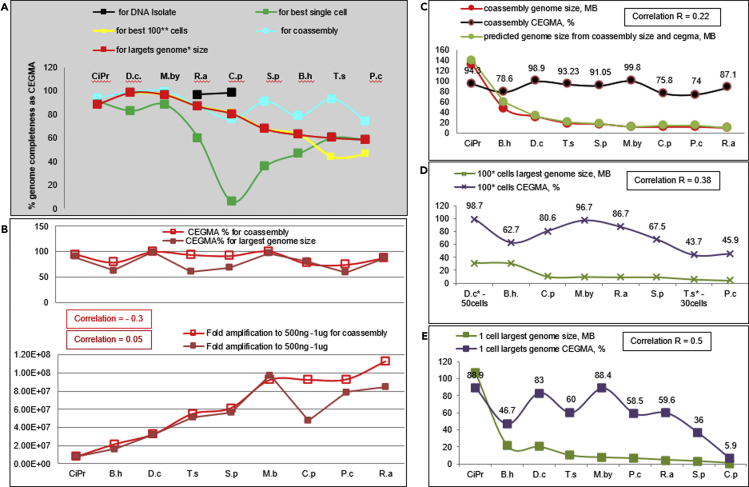
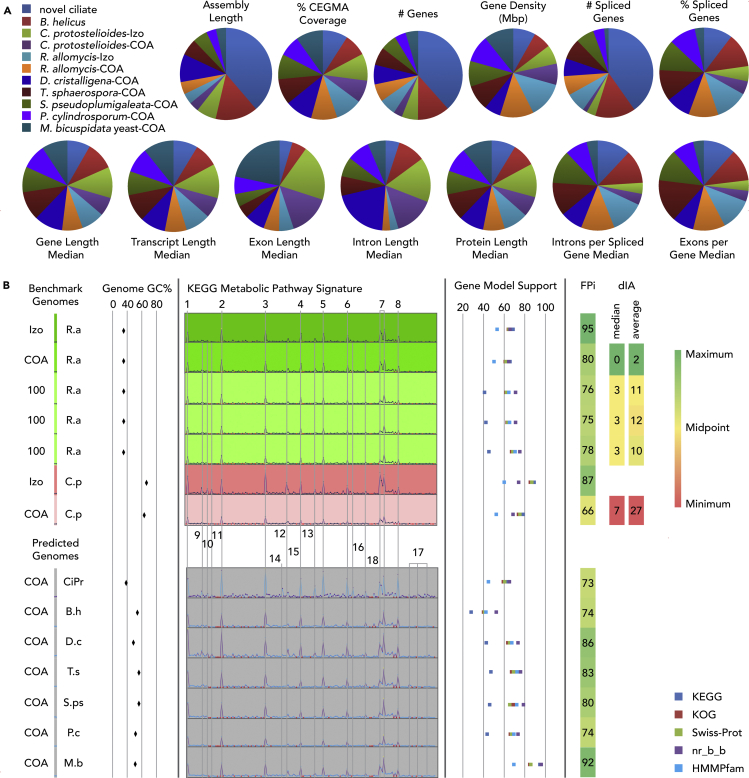
Single-cell sequencing of environmental microorganisms is an essential component of the microbial ecology toolkit. However, large-scale targeted single-cell sequencing for the whole-genome recovery of uncultivated eukaryotes is lagging. The key challenges are low abundance in environmental communities, large complex genomes, and cell walls that are difficult to break. We describe a pipeline composed of state-of-the art single-cell genomics tools and protocols optimized for poorly studied and uncultivated eukaryotic microorganisms that are found at low abundance. This pipeline consists of seven distinct steps, beginning with sample collection and ending with genome annotation, each equipped with quality review steps to ensure high genome quality at low cost. We tested and evaluated each step on environmental samples and cultures of early-diverging lineages of fungi and Chromista/SAR. We show that genomes produced using this pipeline are almost as good as complete reference genomes for functional and comparative genomics for environmental microbial eukaryotes.

Keywords: Genomics; Geomicrobiology; Microbiology.


Figures

None
Graphical abstract
Figure 1
Figure 1
Pipeline schematics for environmental microbial eukaryotic single-cell whole-genome recovery, de novo assembly, and annotation Square boxes show the pipeline steps and components. QC1 through 7 and green ovals show quality check steps and the main criteria used in this study, described in the brief pipeline overview. TgE, target organism enrichment; rDNA, ribosomal DNA; FACS, fluorescent-activated cell sorting; TgBm, target organism biometrics; sc, single cell; MDA, multiple displacement amplification; SGA, start of genome amplification; SAG, single amplified genome; CAG, composite amplified genome; OTU, operational taxonomic unit; BLAST, basic local alignment search tool (Altschul et al., 1990); NGS, next-generation sequencing; LQC, NGS library quality check; RQC, Illumina sequencing read quality check; RTU, random 20-mer uniqueness; cont, contaminant identified by BLAST on NGS read; QUAST, quality assessment tool for genome assemblies (Lazarus et al., 2017); CEGMA, core eukaryotic genes mapping approach (Parra et al., 2007); BUSCO, (Simão et al., 2015). See also Data S2 and Table S10.
Figure 2
Figure 2
Main target single-cell diversity used for pipeline evaluation Shown here are nine of the eleven samples used. For the other two samples, see Table 1. Pictures for the first through eighth species are sized relative the 5μM scale bar. Heatmap colors reflect the spectrum of values: red, highest; yellow, lowest; and green, average. TgE is the FACS target enrichment estimated in step 2 of the pipeline (for step 1 TgE, shape and other details, see Table 1 and Video S1). SCL is the sample complexity level (for details see Table 2). The genome size ($) was not known for any of the target organisms before assembly and was therefore estimated based on the assembly size and genome completeness. The genome average GC% (#) was not known before genome assembly and was therefore predicted based on the GC% of the existing genes or by estimation using the nearest phylogenetic group. ∗The phylum Zoopagomycota was established by (Spatafora et al., 2016) in part using data obtained from these four single-cell genomes. Before this study, the phylogenetic data available for this group were limited. See also Data S1.
Figure 3
Figure 3
Predictive value and applicability of the used QC criteria for a wide phylogenetic group Twenty QC criteria examined (see Data S2) can be reduced to six shown here. Axes color: black, pre-assembly criteria; gray, assembly metrics; red, pre-annotation criteria. Gower & Hand PCA biplot represents similarity between data points, with smaller distance higher similarity. Shown plot explains 80.2% of the variability for fungi plus ciliate protists group. Any point on the plot projected orthogonally onto the axes will show the approximate value of the variable. Percent at the end of the axes labels indicates predictability value of the axes. Species full names are given in Figures 2 and S1. ED, early diverging. See also Table S10.
Figure 4
Figure 4
Intra- and interspecific variabilities (A) Cryptomycota and Chytridiomycota 18S rDNA (region v6 to v9) ML tree based on the HKY85 nucleotide substitution model with bootstrap values shown above 60%. (B) Assembled: Genome distance was calculated using GGDC formula 2, designed for incomplete isolated genomes (Auch et al., 2010; Meier-Kolthoff et al., 2013); the genome size shows the degree of variation in genome recovery between single-cell and multiple-cell sorts, and the core eukaryotic gene mapping approach (CEGMA) value reflects genome completeness. ∗Assemblies used for the genome coverage Circos plots. For all the other species, see Figure 5. (C) Genome coverage shows mapping in 1,000-bp bins from individual select single-cell or multiple-cell libraries to the reference coassembled species genome. See also Figure S6.
Figure 5
Figure 5
Intra- and interspecific genome coverage variability Each species Circos map is scaled relative to the largest genome (Blyttiomyces helicus) true to size. Reference genome (coassembly) is shown as the outer gray circle. Coassembly GC% plotted as a red line over the gray circle. 1,000-bp bins were plotted against reference co-assembly genome and scaled proportionally to the co-assembly genome size. Five representative libraries from single-cell (black); 10-cell, 30-cell, or 50-cell depending on the species (blue); and 100-cell sorts were chosen for each species. For each cell sort category one worst case, one average case, and one best case were picked when available. In the middle of the plot numbers are coassembly genome in gray, GC% in red, and CEGMA completeness in purple. See also Figures S6 and S8.
Figure 6
Figure 6
Intraspecific single-cell genome variability and phylogenetic placement of single- and multi-cell genomes Phylogenetic distance was estimated based on the 18S rDNA region v6 through v9 using PhyML package (Guindon et al., 2010). Genome distance was estimated using Genome-to-Genome Distance Calculator (GGDC), formula 2 (Meier-Kolthoff et al., 2013). See Table 3 for Genome-to-Genome Distance between genera. (A) Zoopagomycota phylogenetic tree and GGDC, genome size, and completeness. Best nucleotide substitution model estimated HKY85, random starting tree, estimated best tree with bootstrap analysis, bootstrap shown values above 60%. Tree: Branches are shown as: Dc, Dimargaris cristalligena RSA 468; Ts, Thamnocephalis sphaerospora, Sp, Syncephalis pseudoplumigaleata; Pc, Piptocephalis cylindrospora RSA2659. (B) Ascomycota single-cell phylogenetic tree and GGDC, genome size, and completeness. Best nucleotide substitution model estimated GTR+G+I, random starting tree, estimated best tree with bootstrap analysis, bootstrap shown values above 60%. Tree: Branches are shown as Mb, Metschnikowia bicuspidata in red with closest species in dark red. (C) Compost ciliate single-cell phylogenetic tree and GGDC, genome size and completeness. Best nucleotide substitution model estimated HKY85+G, with bootstrap analysis, shown values above 60%. Branches for the single-cells are shown with: aqua, ciliate Protist (CiPr). Species with closest 18S are shown in dark teal. Non-Alveolata branches are shown in black.
Figure 7
Figure 7
Amplification bias for coassemblies and largest assembled genomes (from 1 or 100 cells) (A) Genome completeness as CEGMA across species for best genomes. (B) Correlation between fold amplification and CEGMA for coassembly and for largest genome. (C–E) Correlation between assembly size and CEGMA. Correlation is Pierson value (R) for genome size and CEGMA. (C) For coassembly. (D) For 100-cells genomes where available. (E) For single-cell genomes. See also Figure S4.
Figure 8
Figure 8
Single-cell genome coassembly quality assessment for functional genomics studies (A) Comparative analysis of annotated genomes. See also Table S7. (B) Functional prediction value assessment. Izo, isolate unamplified genome assembly; COA, coassembly of several single- and/or multiple-cell assemblies, and 100-100 cell-sort genome assembly. For the fungi, the scale for the KEGG metabolic pathway signature was the same (0–678). For the CiPr (ciliate protist), the scale was 0–1252. FPi – functional genomics prediction index, where i = geomean % complete genes and % CEGMA coverage; dIA, absent entries in the amplified genome compared with the isolate genome. Abbreviations for species names are explained in Table 1. Detailed information for each KEGG entry is available in Table S9. KEGG peak numbers: 1 through 8 are category total, 9 through 18 are specific enrichments in subgroups of the respective category. 1. Amino acid metabolism, 2. Biosynthesis of secondary metabolites, 3. Carbohydrate metabolism, 4. Glycan biosynthesis and metabolism, 5. Lipid metabolism, 6. Metabolism of cofactors and vitamins, 7. Nucleotide metabolism and overview of biosynthesis of alkaloids and hormones, 8. Xenobiotic biodegradation and metabolism, 9. Tryptophan metabolism, 10. Biosynthesis of polyketides and nonribosomal peptides, 11. Biosynthesis of siderophore group nonribosomal peptides, 12. Starch and sucrose metabolism, 13. Lipopolysaccharide biosynthesis, 14. Pentose phosphate pathway, 15. Energy metabolism, 16. Nicotinate and nicotinamide metabolism (cyt p450), 17. Benzoate degradation via CoA ligation, drug metabolism cytochrome p450, gamma-hexachlorocyclohexane degradation, metabolism of xenobiotics by cytochrome p450, 18. Metabolism of other amino acids.

Similar articles

Cited by

References

    1. Ahrendt S.R., Quandt C.A., Ciobanu D., Clum A., Salamov A., Andreopoulos B., Cheng J.F., Woyke T., Pelin A., Henrissat B. Leveraging single-cell genomics to expand the fungal tree of life. Nat. Microbiol. 2018;3:1417–1428. - PMC - PubMed
    1. Alexander W.G., Wisecaver J.H., Rokas A., Hittinger C.T. Horizontally acquired genes in early-diverging pathogenic fungi enable the use of host nucleosides and nucleotides. Proc. Natl. Acad. Sci. U S A. 2016;113:4116–4121. - PMC - PubMed
    1. Altschul S.F., Gish W., Miller W., Myers E.W., Lipman D.J. Basic local alignment search tool. J. Mol. Biol. 1990;215:403–410. - PubMed
    1. Arriola E., Lambros M.B., Jones C., Dexter T., Mackay A., Tan D.S., Tamber N., Fenwick K., Ashworth A., Dowsett M. Evaluation of Phi29-based whole-genome amplification for microarray-based comparative genomic hybridisation. Lab. Invest. 2007;87:75–83. - PubMed
    1. Auch A.F., von Jan M., Klenk H.P., Göker M. Digital DNA-DNA hybridization for microbial species delineation by means of genome-to-genome sequence comparison. Stand. Genomic Sci. 2010;2:117–134. - PMC - PubMed