. 2021 Mar 21;24(4):102345.
doi: 10.1016/j.isci.2021.102345. eCollection 2021 Apr 23.

Circadian fluctuations in glucocorticoid level predict perceptual discrimination sensitivity

Affiliations

Circadian fluctuations in glucocorticoid level predict perceptual discrimination sensitivity

Jonas Obleser et al. iScience. .

Abstract

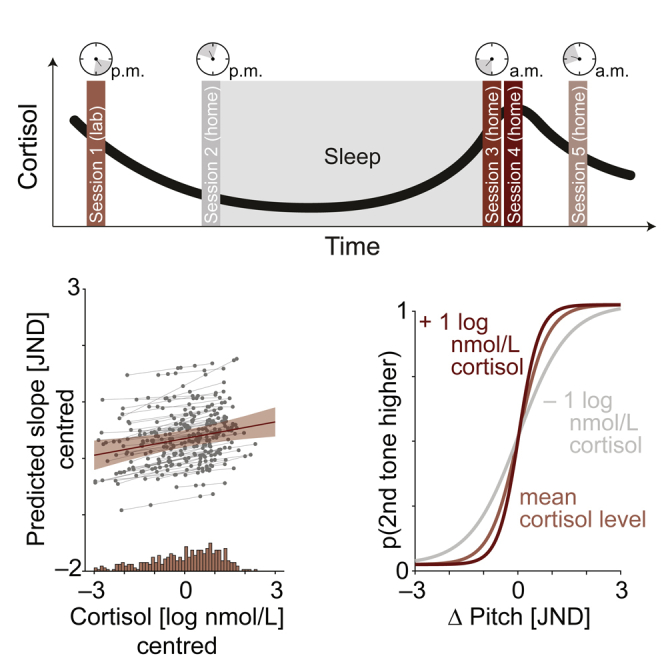
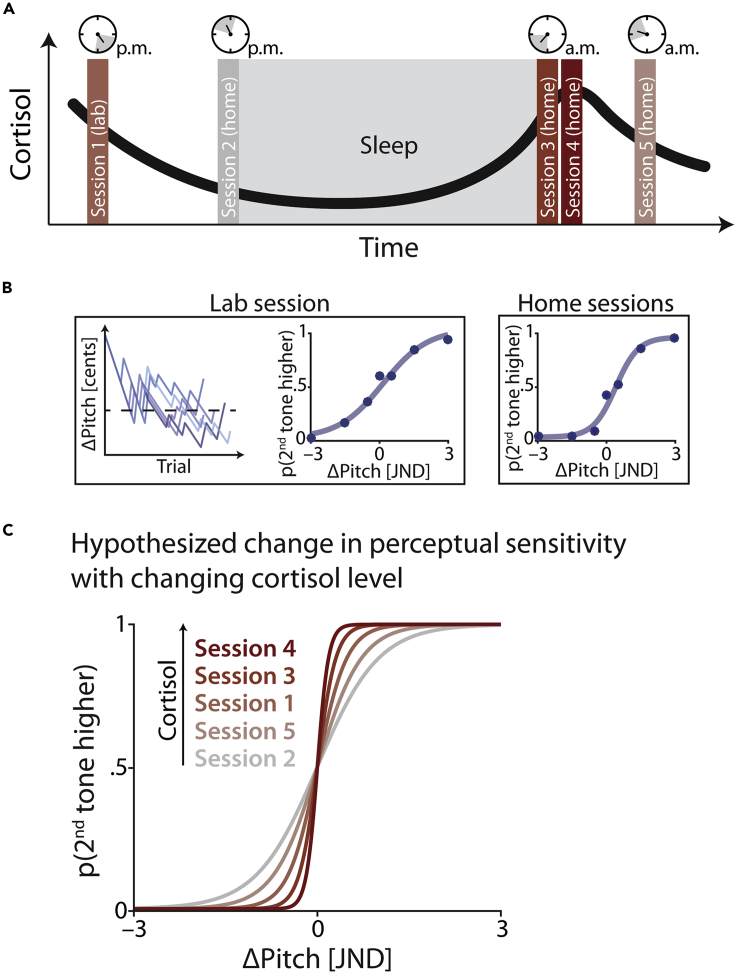
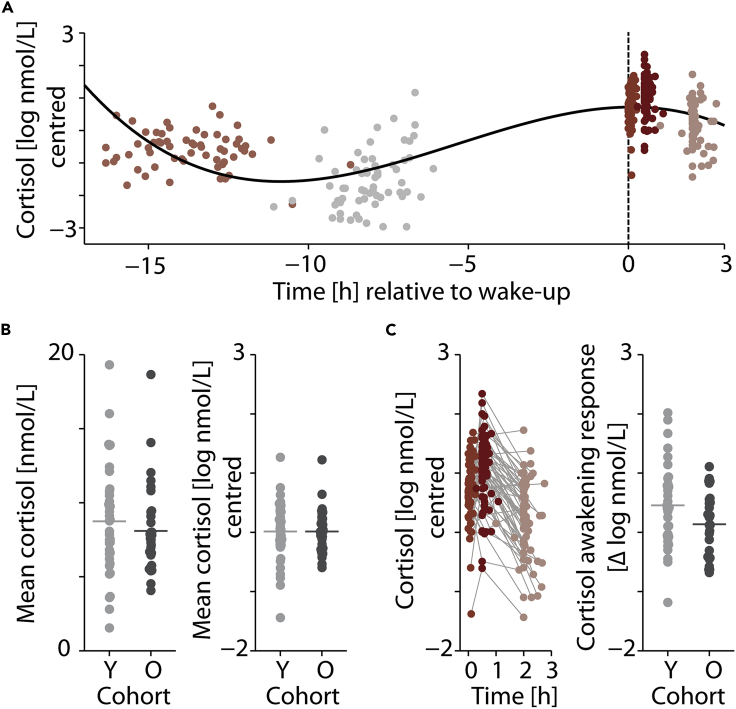
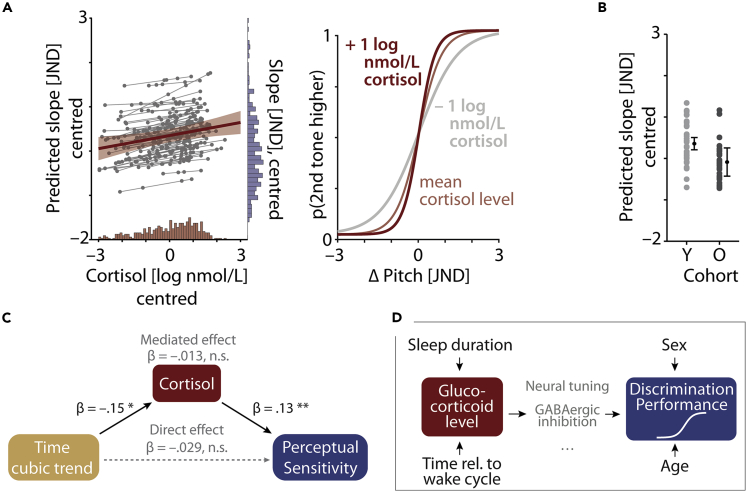
Slow neurobiological rhythms, such as the circadian secretion of glucocorticoid (GC) hormones, modulate a variety of body functions. Whether and how endocrine fluctuations also exert an influence on perceptual abilities is largely uncharted. Here, we show that phasic increases in GC availability prove beneficial to auditory discrimination. In an age-varying sample of N = 68 healthy human participants, we characterize the covariation of saliva cortisol with perceptual sensitivity in an auditory pitch discrimination task at five time points across the sleep-wake cycle. First, momentary saliva cortisol levels were captured well by the time relative to wake-up and overall sleep duration. Second, within individuals, higher cortisol levels just prior to behavioral testing predicted better pitch discrimination ability, expressed as a steepened psychometric curve. This effect of GCs held under a set of statistical controls. Our results pave the way for more in-depth studies on neuroendocrinological determinants of sensory encoding and perception.

Keywords: Biological Sciences; Endocrinology; Neuroscience; Sensory Neuroscience.


Conflict of interest statement

The authors declare no competing interests.

Figures

None
Graphical abstract
Figure 1
Figure 1
Experimental design and hypothesis (A) Design. In five sessions, participants were asked to take saliva samples, from which their cortisol levels were measured. After a first laboratory session (in the afternoon), participants were asked to perform the other four sessions at home. To capture circadian differences in cortisol levels (black curve), these “home” sessions were timed to align with the individual participant's sleep-wake cycle such that sessions 2 and 3 had to be completed immediately before going to sleep and immediately after wake-up, respectively. Two further sessions (4 and 5) were performed 30 and 120 min after wake-up. (B) Psychophysical testing. In addition to the collection of saliva samples, participants performed a pitch discrimination task in each session. In the lab session, we first assessed individual participants' pitch discrimination thresholds (just-noticeable difference; JND) using five separate staircases (see methods for details). These individual JNDs were then used in an online experiment, which participants performed in all five sessions. Psychometric functions (shown in blue) were fit to the data obtained in each session. The slope of the psychometric function served as a measure of perceptual sensitivity. (C) Hypothesis. Increased levels of GC availability should result in steeper psychometric functions, reflecting higher perceptual sensitivity. Note that here sessions are not ordered chronologically but by cortisol level. All illustrations in (A)–(C) are schematic, visualizing the hypothesized results of the current study.
Figure 2
Figure 2
Momentary states of glucocorticoid levels (salivary cortisol) (A) Changes in individual salivary cortisol concentration measured in log nmol/L across five experimental sessions. Cortisol levels are mean centered across all N = 68 participants. Sessions are grouped by color and aligned by wake-up time (dashed vertical line). Black curve shows the cubic trend of time that was modeled using polynomial regression. (B) Left image: individual mean cortisol levels [nmol/L] across sessions shown separately for the younger (Y, light gray) and older (O, dark gray) age cohort. Dots represent individual mean values (N = 68); horizontal lines show the respective group average. Right image: individual mean cortisol levels per cohort after log-transformation and mean centering for statistical analysis. (C) Left image: trajectory of individual cortisol levels [log nmol/L] following wake-up. Time is expressed relative to wake-up time. Note the rise in cortisol levels 30 min after wake-up (session 4, dark red). Right image: individual cortisol awakening response (CAR) expressed as the difference in cortisol levels [log nmol/L, centered] 30 min after wake-up relative to wake-up shown separately for the younger (Y, light gray) and older (O, dark gray) age cohort. Horizontal lines indicate the group mean.
Figure 3
Figure 3
Salivary cortisol predicts perceptual discrimination sensitivity (A) Left image: change in perceptual sensitivity (operationalized by the slope of psychometric function) as predicted by cortisol. Predicted group-level fixed-effect (red slope) with 95% confidence interval (CI) error band is shown along with the estimated subject-specific random slopes (thin gray lines) and single-subject, single-session predictions (gray dots). Note that subject-specific random slopes did not improve the model fit and were added for illustrative purposes only. Histograms on the bottom and right side of the plot display the distribution of log-transformed cortisol and raw slope values, respectively. Right image: illustration of how variation in cortisol level impacts the steepness of the psychometric curve. (B) Difference in perceptual sensitivity between age groups. Colored dots (light gray, young [Y] cohort; dark gray, older [O] cohort) show single-subject predicted slope values based on the best-fitting linear mixed-effects model. Black dots represent the fixed-effect group-level prediction and 95% CI. (C) Results of causal mediation analysis. Formally accounting for the potentially mediating role of cortisol does not lead to a significant change in the effect of the cubic trend of time on perceptual sensitivity. ∗p < .05; ∗∗p < .01. (D) Summary of effects observed. The panel summarizes observed (black solid arrows) and statistically excluded (absence of arrows) effects. Intervening (i.e., mediating) effects of how GCs can act upon resulting perceptual outcomes must obviously exist but remain subject to future experimentation. For illustration only, viable paths via a sharpening of neural tuning and/or increased levels of GABAergic inhibition are shown in gray. See also Figures S1–S3 and Tables S1–S4.

Similar articles

Cited by

References

    1. Al-Mana D., Ceranic B., Djahanbakhch O., Luxon L.M. Hormones and the auditory system: a review of physiology and pathophysiology. Neuroscience. 2008;153:881–900. - PubMed
    1. Al’Absi M., Hugdahl K., Lovallo W.R. Adrenocortical stress responses and altered working memory performance. Psychophysiology. 2002;39:95–99. - PubMed
    1. Atiani S., Elhilali M., David S.V., Fritz J.B., Shamma S.A. Task difficulty and performance induce diverse adaptive patterns in gain and shape of primary auditory cortical receptive fields. Neuron. 2009;61:467–480. - PMC - PubMed
    1. Basinou V., Park J.S., Cederroth C.R., Canlon B. Circadian regulation of auditory function. Hear. Res. 2017;347:47–55. - PMC - PubMed
    1. Beluche I., Carrière I., Ritchie K., Ancelin M.L. A prospective study of diurnal cortisol and cognitive function in community-dwelling elderly people. Psychol. Med. 2010;40:1039–1049. - PMC - PubMed