. 2021 Jun 11;2(6):755-772.e5.
doi: 10.1016/j.medj.2021.04.008. Epub 2021 Apr 13.

Mucosal-associated invariant T cell responses differ by sex in COVID-19

Affiliations

Mucosal-associated invariant T cell responses differ by sex in COVID-19

Chen Yu et al. Med. .

Abstract

Background: Sexual dimorphisms in immune responses contribute to coronavirus disease 2019 (COVID-19) outcomes, but the mechanisms governing this disparity remain incompletely understood.

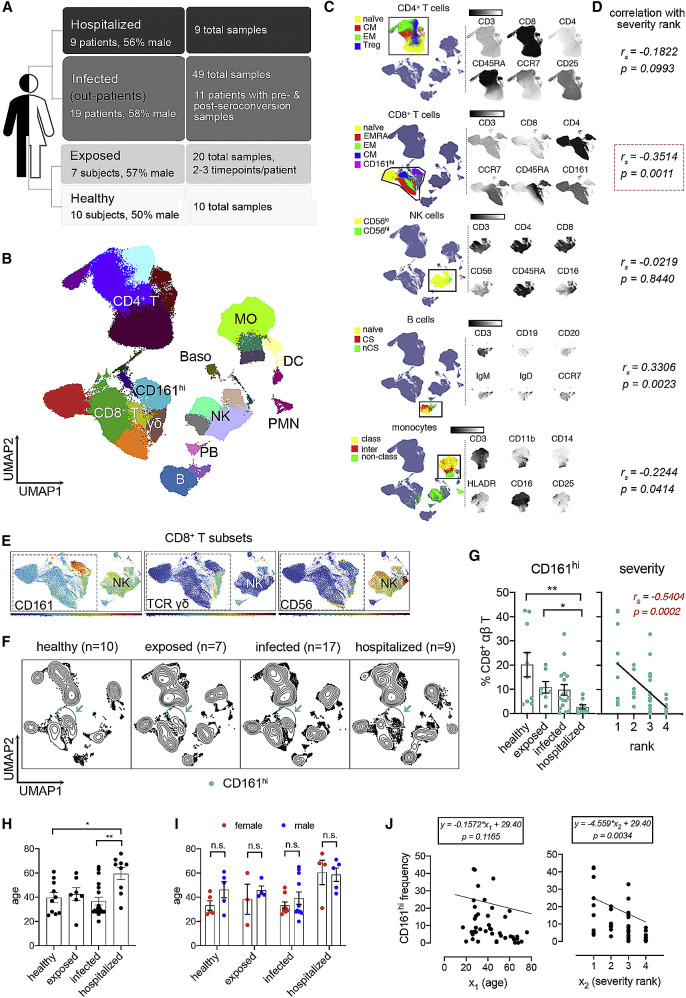
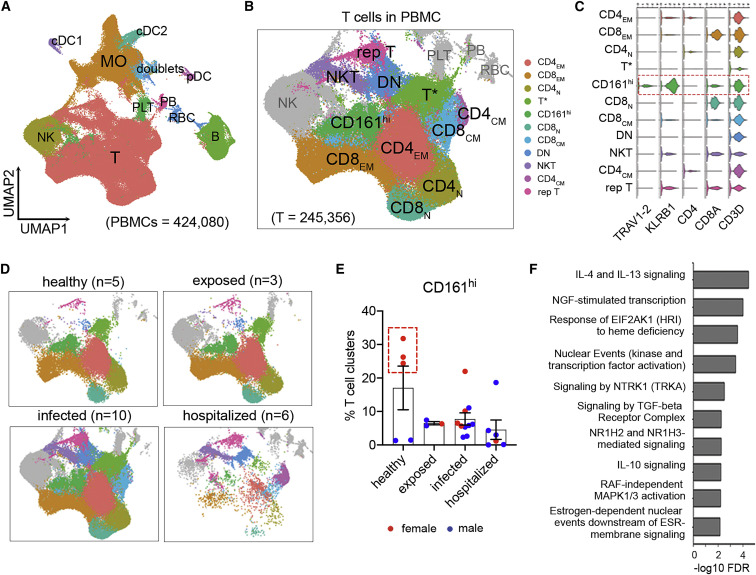
Methods: We carried out sex-balanced sampling of peripheral blood mononuclear cells from hospitalized and non-hospitalized individuals with confirmed COVID-19, uninfected close contacts, and healthy control individuals for 36-color flow cytometry and single-cell RNA sequencing.

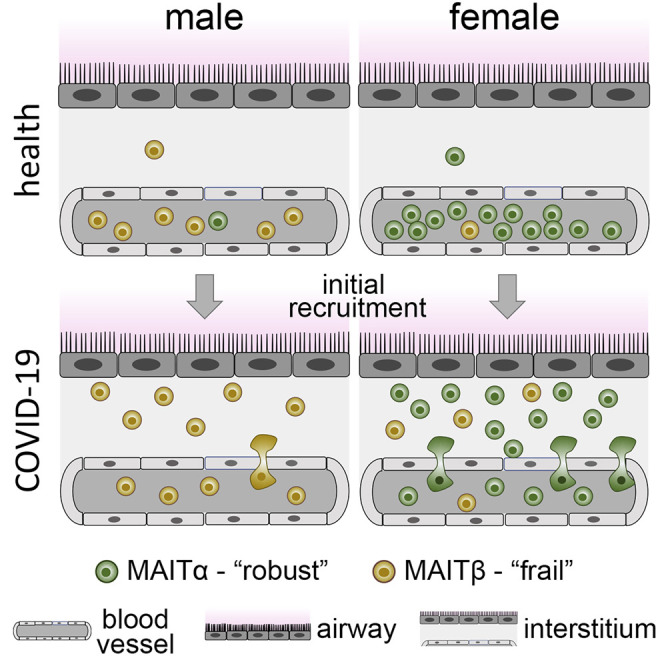
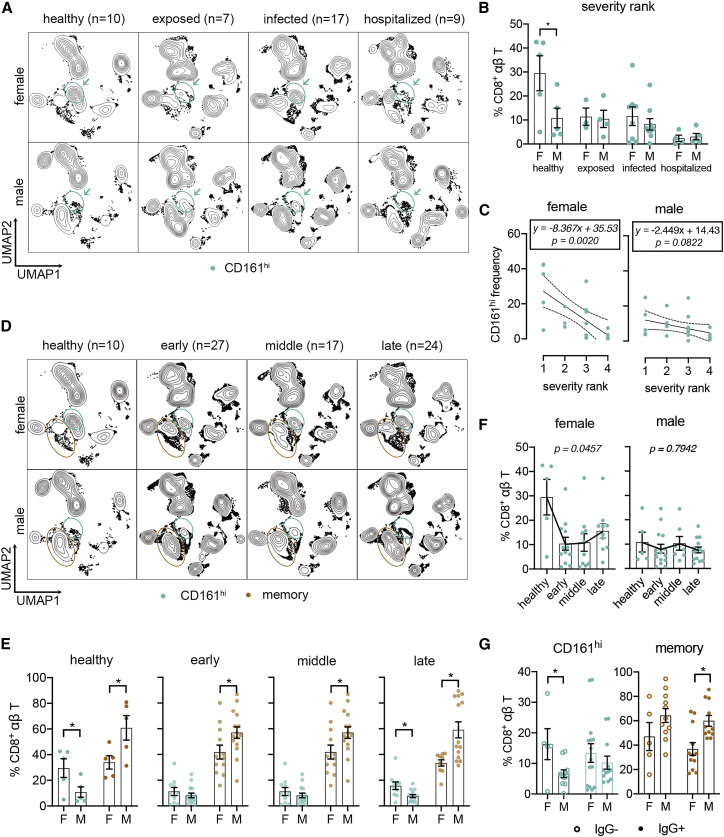
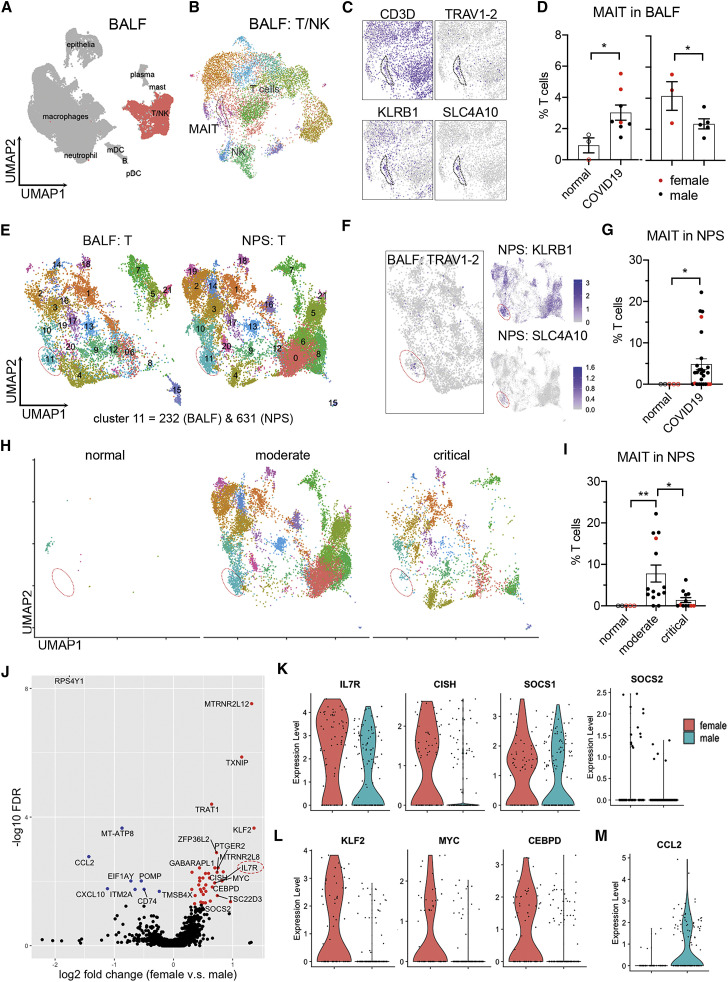
Findings: Our results revealed a pronounced reduction of circulating mucosal-associated invariant T (MAIT) cells in infected females. Integration of published COVID-19 airway tissue datasets suggests that this reduction represented a major wave of MAIT cell extravasation during early infection in females. Moreover, MAIT cells from females possessed an immunologically active gene signature, whereas cells from males were pro-apoptotic.

Conclusions: Our findings uncover a female-specific protective MAIT cell profile, potentially shedding light on reduced COVID-19 susceptibility in females.

Funding: This work was supported by NIH/NIAID (U01AI066569 and UM1AI104681), the Defense Advanced Projects Agency (DARPA; N66001-09-C-2082 and HR0011-17-2-0069), the Veterans Affairs Health System, and Virology Quality Assurance (VQA; 75N93019C00015). The content is solely the responsibility of the authors and does not necessarily represent the official view of the National Institutes of Health. COVID-19 samples were processed under Biosafety level 2 (BSL-2) with aerosol management enhancement or BSL-3 in the Duke Regional Biocontainment Laboratory, which received partial support for construction from NIH/NIAID (UC6AI058607).

Keywords: IL-7; SARS-CoV-2; apoptosis; innate immunity; monocyte.


Conflict of interest statement

M.T.M. reports grants for biomarker diagnostics from the Defense Advanced Research Projects Agency (DARPA), National Institutes of Health (NIH), Sanofi, and the Department of Veterans Affairs. T.W.B. reports grants from DARPA and is a consultant for Predigen. M.T.M., T.W.B., E.L.T., and C.W.W. report pending patents on molecular methods to diagnose and treat respiratory infections. E.L.T. reports grants on biomarker diagnostics from DARPA and the NIH/Antibacterial Resistance Leadership Group (ARLG) and an ownership stake in Predigen. G.S.G. reports an ownership stake in Predigen. C.W.W. reports grants for biomarker diagnostics from DARPA, NIH/ARLG, Predigen, and Sanofi and has received consultancy fees from bioMerieux, Roche, Biofire, Giner, and Biomeme.

Figures

None
Graphical abstract
Figure 1
Figure 1
Loss of peripheral CD8+CD161hi T cell frequencies correlates with increased severity of COVID-19 (A) Overview of groups in this study. (B) UMAP visualization of PBMC subsets identified by FlowSOM clustering. Samples from all participants were pooled and down-sampled to 3,000 live CD45+ cells per sample. MO, monocyte; NK, natural killer; DC, dendritic cell; PMN, polymorphonuclear neutrophil; Baso, basophil. (C) Representative marker expression by CD4+ T cell, CD8+ T cell, MO, NK cell, and B cell subsets. (D) Correlation analysis of immune cell subsets as shown in (C) with disease severity rank. (E) Expression of CD161, TCR γδ and CD56 in CD8+ T cell subsets. NK cells were used as a positive control for CD56 expression. (F) UMAP of samples grouped by disease severity rank. Samples collected within 3 days from initial symptom score recording were included. (G) Frequencies of CD161hi T cells (mean ± standard error) in different severity groups (left) and their correlation with severity rank (right). (H and I) Age comparisons among severity rank and between sexes. (J) Multiple linear regression of age (x1) and severity rank (x2) with CD161hi cell frequencies. Regression models with p values are shown for age and severity rank. Significance was determined by Kruskal-Wallis test with Dunn’s test (E) or ANOVA (H and I): ∗p < 0.05, ∗∗p < 0.01, ∗∗∗p < 0.001. Correlation efficiency was calculated by Spearman’s rank correlation (D and G). See also Figure S1 and Tables 1 and S1.
Figure 2
Figure 2
Sex-specific responses of circulating CD8+ T cells in individuals with COVID-19 (A) UMAP of samples stratified by sex and severity rank as shown in Figure 1F. (B) Frequencies of CD161hi cells between females and males at each rank group. (C) Linear regression of CD161hi cells with severity rank between sexes. Dashed lines indicate 95% confidence intervals. Regression models with p values are shown for each sex. (D) UMAP of samples stratified by sex and time after symptom onset (early, ≤14 days; middle, >15 days and ≤21 days; late, >22 days). (E) Frequencies of CD161hi and memory CD8+ T cells between sexes and time points. (F) Sex-specific changes of CD161hi cells frequencies shown in (E). (G) Frequencies of CD161hi and memory CD8+ T cells in samples from subjects with confirmed COVID-19 pre- and post-seroconversion. Data were plotted as mean ± standard error (B and E–G). Significance was determined by Mann-Whitney test (B, E, and G) and Kruskal-Wallis test with Dunn’s test (F): ∗p < 0.05. See also Figure S2.
Figure 3
Figure 3
Characterization of CD8+CD161hi T cells among COVID-19 PBMCs using scRNA-seq (A) UMAP and unsupervised cluster analysis of PBMCs. RBC, red blood cell; PB, plasmablast; PLT, platelet. (B and C) Visualization of T cell subsets with high resolution in UMAP (B) and expression of their marker genes as indicated in violin plots (C). The T∗ cluster likely represents a dropout population with low unique molecular identifier (UMI) counts. N, naive; EM, effector memory; CM, central memory; DN, double negative; rep, replicating. (D) Changes of T cell subsets with severity rank. N, number of individuals. (E) Frequencies of CD161hi clusters relative to all T cell subsets. Females were plotted in red and males in blue. The red dashed box delineates healthy females. (F) Top enriched pathways of CD161hi clusters in the Reactome Pathway Database, ranked by false discovery rate (FDR; −log10 scale). Data were plotted as mean ± standard error. Significance was determined by Kruskal-Wallis test (E). See also Figure S3 and Table S2.
Figure 4
Figure 4
Receptor-ligand interaction inferences uncover unique interactions between CD8+CD161hi T cells and MOs (A and B) Visualization (A) and percentage distribution (B) of different MO subsets identified in Figure S3A. Three MO subsets represent resting classical (cl) CD14, non-classical (nc) CD16, and intermediate (int) MO as seen in healthy subjects. Two MO subsets involved in IFN signaling are associated with individuals with COVID-19. Based on differential expression of CD14 and CD16, they are referred to as activated CD14 and activated CD16 MO (CD14 MOA and CD16 MOA, respectively). (C) Overview of selected ligand-receptor interactions inferenced using CellPhoneDB in the COVID-19 PBMC single-cell dataset. The red box delineates specific interactions of CD161hi T cells with MOs. p values and scales are indicated by circle size and color, respectively. (D) Expression of representative ligand and receptor pairs between MAIT cells and MOs as indicated. Red and blue circles indicate CD161hi clusters and MOs, respectively. (E) Heatmap of interaction counts between major T cell and MO subsets.
Figure 5
Figure 5
Heterogeneity and distinct dynamics of circulating MAIT cells across sexes in COVID-19 (A) Subclustering of CD161hi cells (n = 21,610), showing two MAIT cell clusters and one γδ T cluster. (B) Marker gene expression of three CD161hi clusters. (C) Heatmap of the top 25 discriminative genes between MAITα and MAITβ clusters. Expression level was scaled by Z score distribution. (D and E) Representative top enriched pathways of MAITα and MAITβ in the Reactome Pathway Database (ranked by FDR, −log10 scale). The top 100 DEGs ranked by fold change between MAITα and MAITβ were used for this analysis. (F and G) UMAP visualization of MAIT cluster changes (F) and their frequencies (G) with severity rank. (H) Frequencies of MAIT clusters, grouped by time after symptom onset. (I and J) Sex differences of MAIT clusters as shown in (H). Data were plotted as mean ± standard error (G–J). Significance was determined by Mann-Whitney test (I). ∗p < 0.05. See also Figure S4 and Tables S3 and S4.
Figure 6
Figure 6
Sex differences of MAIT cells in airway tissue samples from individuals with COVID-19 (A and B) Clustering analysis of scRNA-seq data from the COVID-19 BALF dataset with subtracted T and NK cells. (C) MAIT cell cluster indicated by marker genes. (D) Frequencies of MAIT cells in BALF between normal subjects and individuals with COVID-19 (left) and across sexes within subjects with COVID-19 (right). (E) Integrated clustering analysis of NPSs with BALF using Seurat 3. Cluster 11, MAIT cells. (F) Referenced MAIT cell cluster in NPSs by expression of TRAV1-2 in BALF and the indicated marker genes in NPSs. (G) Frequencies of MAIT cells in NPSs from healthy subjects and subjects with COVID-19. (H and I) Visualization (H) and frequencies (I) of MAIT cells in NPSs, grouped by disease severity. (J) Volcano plot showing DEGs of BALF MAIT cells between sex with log2 fold change and −log10 FDR. (K–M) Expression of DEGs in IL-7 signaling (K), transcription factors (L), and CCL2 (M). Data were plotted as mean ± standard error (D, G, and I), with females in red and males in black. Significance was determined by unpaired one-tailed Student’s t test (D), Mann-Whitney test (G), and Kruskal-Wallis test with Dunn’s post hoc test (I): ∗p < 0.05, ∗∗p < 0.01. See also Figure S5.

References

    1. Dong E., Du H., Gardner L. An interactive web-based dashboard to track COVID-19 in real time. Lancet Infect. Dis. 2020;20:533–534. - PMC - PubMed
    1. Scully E.P., Haverfield J., Ursin R.L., Tannenbaum C., Klein S.L. Considering how biological sex impacts immune responses and COVID-19 outcomes. Nat. Rev. Immunol. 2020;20:442–447. - PMC - PubMed
    1. Alghamdi I.G., Hussain I.I., Almalki S.S., Alghamdi M.S., Alghamdi M.M., El-Sheemy M.A. The pattern of Middle East respiratory syndrome coronavirus in Saudi Arabia: a descriptive epidemiological analysis of data from the Saudi Ministry of Health. Int. J. Gen. Med. 2014;7:417–423. - PMC - PubMed
    1. Karlberg J., Chong D.S., Lai W.Y. Do men have a higher case fatality rate of severe acute respiratory syndrome than women do? Am. J. Epidemiol. 2004;159:229–231. - PMC - PubMed
    1. Leong H.N., Earnest A., Lim H.H., Chin C.F., Tan C., Puhaindran M.E., Tan A., Chen M.I., Leo Y.S. SARS in Singapore--predictors of disease severity. Ann. Acad. Med. Singap. 2006;35:326–331. - PubMed

Publication types