

Trends in life expectancy and healthy life years at birth and age 65 in the UK, 2008-2016, and other countries of the EU28: An observational cross-sectional study
- PMID: 33870247
- PMCID: PMC8042672
- DOI: 10.1016/j.lanepe.2020.100023
Trends in life expectancy and healthy life years at birth and age 65 in the UK, 2008-2016, and other countries of the EU28: An observational cross-sectional study
Abstract
Background: As society ages, promoting the health of the extra years of life is of paramount importance for health, social care and pension provision. Increases in life expectancy in the UK and elsewhere have slowed in recent years, but the reasons for this are unclear. No formal comparison of trends in healthy life years between the UK and the other countries of the EU28 in recent times has been published. These countries are geographically proximate, and share many social, cultural and demographic properties, making them interesting and useful comparators, especially as the UK prepared to leave the European Union in 2020.
Methods: We calculated sex-specific healthy life years (HLY), unhealthy life years (ULY), mild and severe ULY at birth and age 65 using life tables and age-specific prevalence of activity limitation amongst the EU28 between 2008 and 2016 from EuroHex. Trends in life expectancy, HLY, ULY and proportion of life spent healthy (HLY%) were compared. We then decomposed HLY temporal changes into relative effects of changes in healthy life and mortality, by age group.
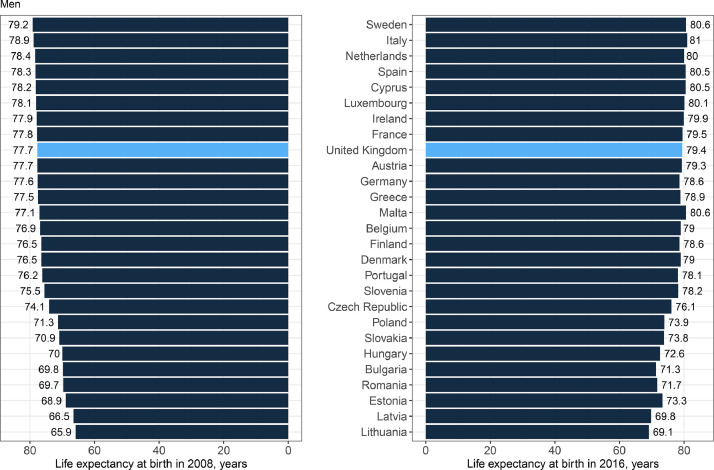
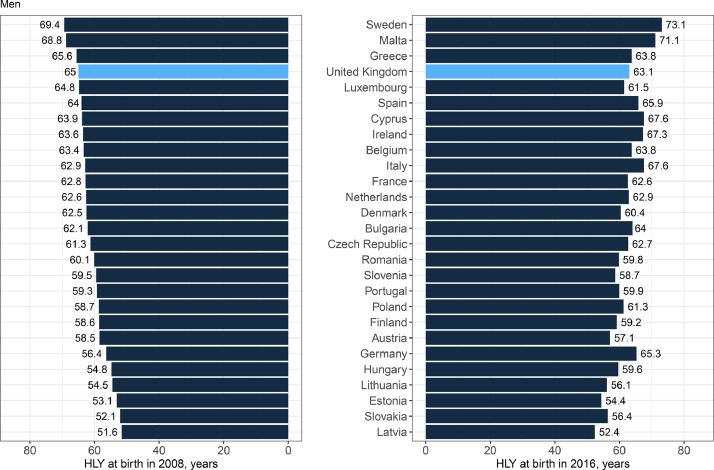
Findings: Life expectancy at birth, and age 65, in the UK were increasing rapidly in 2008 but slowed around 2011. Germany, Portugal and France showed evidence of a similar slowing. HLY at birth in the UK decreased, whereas it increased in most EU28 countries. The UK experienced a period of absolute expansion of unhealthy life in both sexes. The reduction in HLY at birth in the UK was mainly attributable to increases in unhealthy life in younger age groups.
Interpretation: The UK's performance relative to the other countries of the EU28 was poor after 2011, combining static life expectancy and reductions in healthy life years. These trends suggest that the UK government's Ageing Society Grand Challenge (to increase the healthy life expectancy by five years by 2035) will be difficult to attain.
Funding: National Institute for Health Research (NIHR) Policy Research Programme conducted through the NIHR Older People and Frailty Policy Research Unit, PR-PRU-1217-21502. The views expressed are those of the authors and not necessarily those of the NIHR or the Department of Health and Social Care.
© 2021 The Authors.
Conflict of interest statement
Dr Welsh has nothing to disclose. Dr Jagger has nothing to disclose. Dr Matthews has nothing to disclose.
Figures


References
-
- Public Health England . 2018. A review of recent trends in mortality in England.https://assets.publishing.service.gov.uk/government/uploads/system/uploa...
-
- Marshall L., Finch D., Cairncross L., Bibby J. 2019. Mortality and life expectancy trends in the UK: stalling progress.https://www.health.org.uk/sites/default/files/upload/publications/2019/H...
-
- Marmot M., Allen J., Boyce T., Goldblatt P., Morrison J. 2020. Health equity in England : the marmot review 10 years on. London. - PubMed
Grants and funding
LinkOut - more resources
Full Text Sources
Other Literature Sources
Research Materials
