. 2021 Oct 28;224(8):1287-1293.
doi: 10.1093/infdis/jiab215.

Severe Acute Respiratory Syndrome Coronavirus 2 Total and Subgenomic RNA Viral Load in Hospitalized Patients

Affiliations

Severe Acute Respiratory Syndrome Coronavirus 2 Total and Subgenomic RNA Viral Load in Hospitalized Patients

Derek E Dimcheff et al. J Infect Dis. .

Abstract

Background: Previous studies demonstrated that severe acute respiratory syndrome coronavirus 2 (SARS-CoV-2) RNA can be detected for weeks after infection. The significance of this finding is unclear and, in most patients, does not represent active infection. Detection of subgenomic RNA has been proposed to represent productive infection and may be a useful marker for monitoring infectivity.

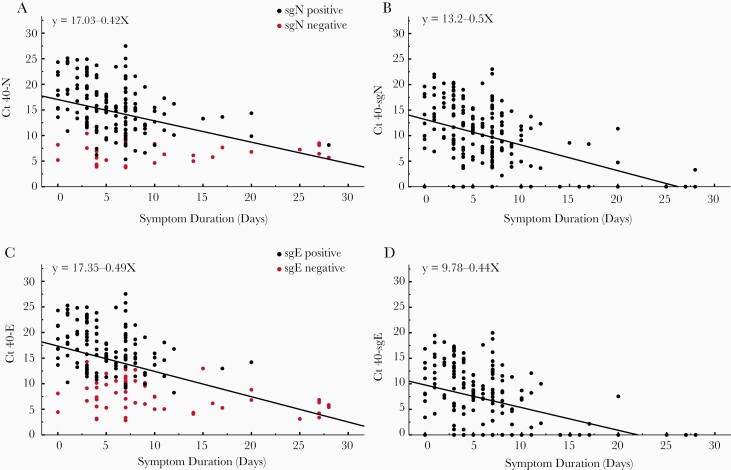
Methods: We used quantitative reverse-transcription polymerase chain reaction (RT-qPCR) to quantify total and subgenomic nucleocapsid (sgN) and envelope (sgE) transcripts in 185 SARS-CoV-2-positive nasopharyngeal swab samples collected on hospital admission and to relate to symptom duration.

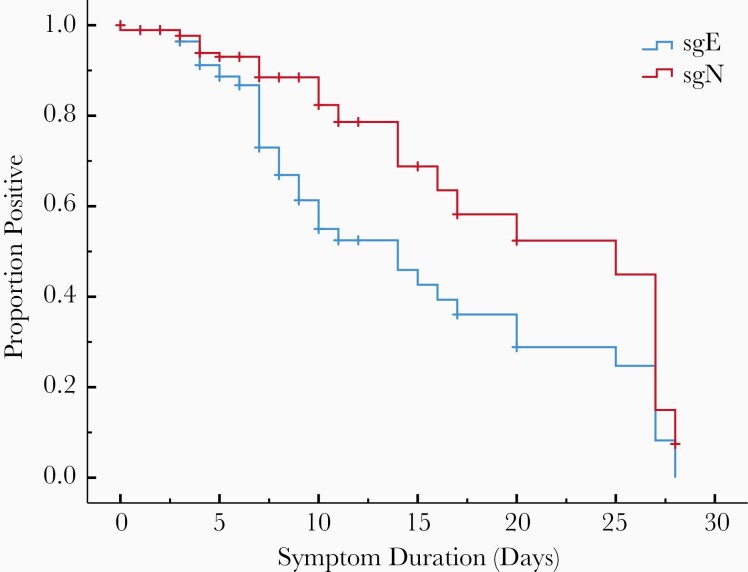
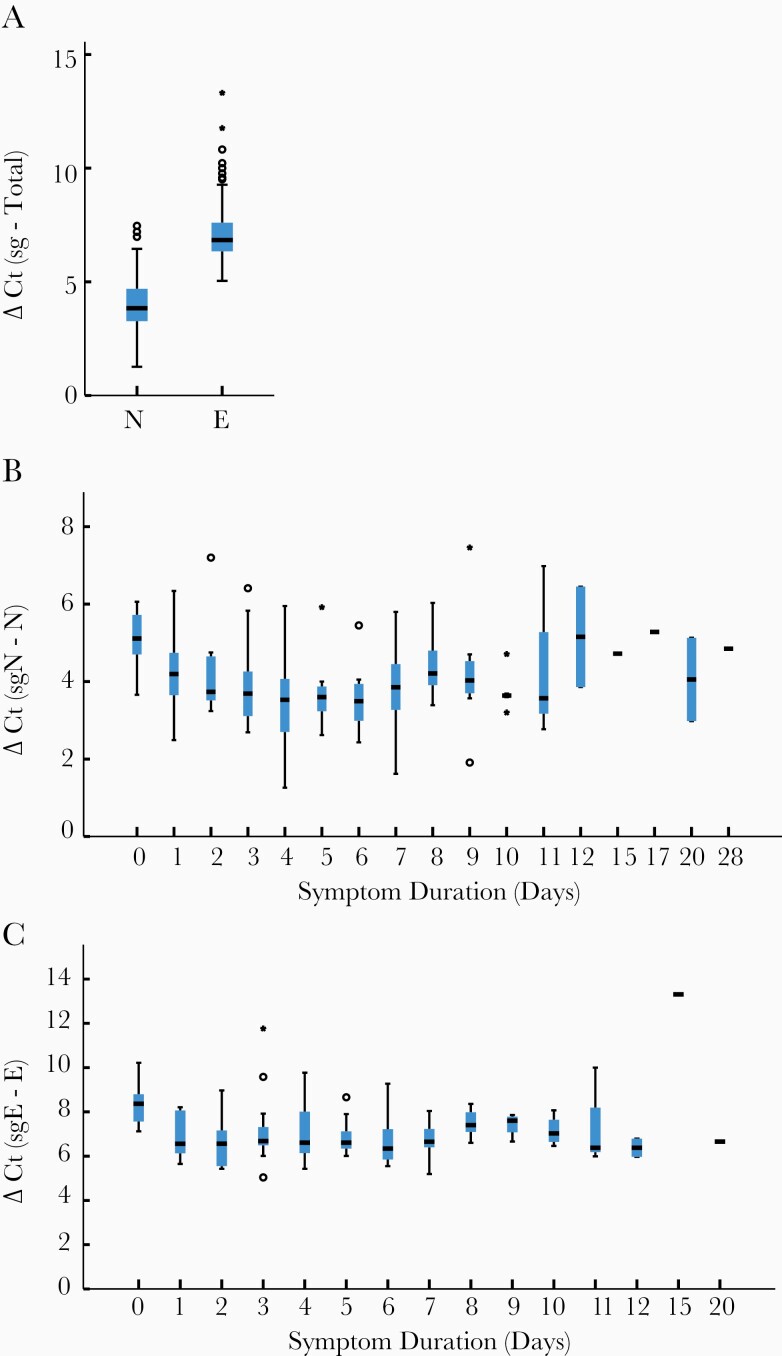
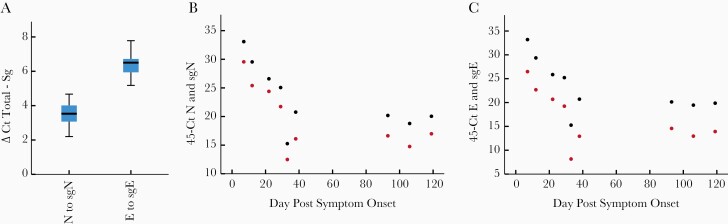
Results: We find that all transcripts decline at the same rate; however, sgE becomes undetectable before other transcripts. The median duration of symptoms to a negative test is 14 days for sgE and 25 days for sgN. There is a linear decline in subgenomic compared to total RNA, suggesting that subgenomic transcript copy number is dependent on copy number of total transcripts. The mean difference between total and sgN is 16-fold and the mean difference between total and sgE is 137-fold. This relationship is constant over duration of symptoms, allowing prediction of subgenomic copy number from total copy number.

Conclusions: Subgenomic RNA may be no more useful in determining infectivity than a copy number threshold determined for total RNA.

Keywords: RT-qPCR; SARS-CoV-2; subgenomic RNA.


Figures

Figure 1.
Figure 1.
Comparison of cycle threshold (Ct) vs day from symptom onset for clinical samples obtained from 185 inpatients. Vertical axis represents 40 minus the Ct. Total N (A), subgenomic N (sgN; B), total E (C), and subgenomic E (sgE; D). Red dots in A and C represent subgenomic-negative samples and black dots represent subgenomic-positive samples. Of the 185 patients, 57 were negative for sgE and 28 were negative for sgN (shown on y-axis). Pearson correlation coefficients: N: –0.420, P < .0001; sgN: –0.457, P < .0001; E: –0.468, P < .0001; sgE: –0.416, P < .0001. Linear regression equations are indicated in each panel.
Figure 2.
Figure 2.
Kaplan–Meier analysis showing proportion of patients with positive quantitative reverse-transcription polymerase chain reaction (RT-qPCR) for subgenomic transcripts vs day from symptom onset. The median duration from symptom onset to a negative subgenomic N (sgN) RT-qPCR was 25 days and 14 days for subgenomic E (sgE). This difference between the curves by log-rank test was significant (P = .001). Vertical hash marks indicate censored cases.
Figure 3.
Figure 3.
Box plots comparing difference in cycle threshold (Ct) values, delta Ct (subgenomic Ct – total Ct) for clinical samples. Total N was expressed at 16-fold (4.0 [standard deviation {SD}, 1.1] cycles) greater than subgenomic N (sgN) and total E was expressed at 137.2-fold (7.1 [SD, 1.3] cycles) greater than subgenomic E (sgE) expression (A). This relationship was found at all times after symptom onset for N (B) and E (C). Horizontal hash represents median value; if no interquartile range (IQR) is shown, then n = 1 for that sample. Moderate (1.5 × IQR) and extreme outliers (3 × IQR) are noted by circles and stars, respectively.
Figure 4.
Figure 4.
Relationship between total and subgenomic RNA in a persistently infectious patient. Total N was expressed at a 11-fold (3.5 standard deviation {SD}, 0.75] cycles) higher level than subgenomic N (sgN), and total E was expressed at an 84-fold (6.4 [SD, 0.8] cycles) higher level than subgenomic E (sgE) when all time points were combined (A). Time course showing 45 minus cycle thresholds (Ct) for total (black) and subgenomic RNA (red) over time. This patient showed persistently positive total and subgenomic RNA for 119 days. The ratio of total N and sgN of 3 to 4 cycles was maintained over the duration of infection (B). This was also observed for E and sgE with the ratio of 6 to 7 cycles maintained thorough the course of infection (C).

Update of

Similar articles

Cited by

References

    1. Vogels CBF, Brito AF, Wyllie AL, et al. . Analytical sensitivity and efficiency comparisons of SARS-CoV-2 RT-qPCR primer-probe sets. Nat Microbiol 2020; 5:1299–305. - PMC - PubMed
    1. Corman VM, Landt O, Kaiser M, et al. . Detection of 2019 novel coronavirus (2019-nCoV) by real-time RT-PCR. Euro Surveill 2020; 25:2000045. - PMC - PubMed
    1. SoRelle JA, Frame I, Falcon A, et al. . Clinical validation of a SARS-CoV-2 real-time reverse transcription PCR assay targeting the nucleocapsid gene. J Appl Lab Med 2020; 5:889–96. - PMC - PubMed
    1. Walsh KA, Jordan K, Clyne B, et al. . SARS-CoV-2 detection, viral load and infectivity over the course of an infection. J Infect 2020; 81:357–71. - PMC - PubMed
    1. Arons MM, Hatfield KM, Reddy SC, et al. ; Public Health–Seattle and King County and CDC COVID-19 Investigation Team . Presymptomatic SARS-CoV-2 infections and transmission in a skilled nursing facility. N Engl J Med 2020; 382:2081–90. - PMC - PubMed

Publication types

MeSH terms

Substances