

Ambient air pollution and posttransplant outcomes among kidney transplant recipients
- PMID: 33870639
- PMCID: PMC8500923
- DOI: 10.1111/ajt.16605
Ambient air pollution and posttransplant outcomes among kidney transplant recipients
Abstract
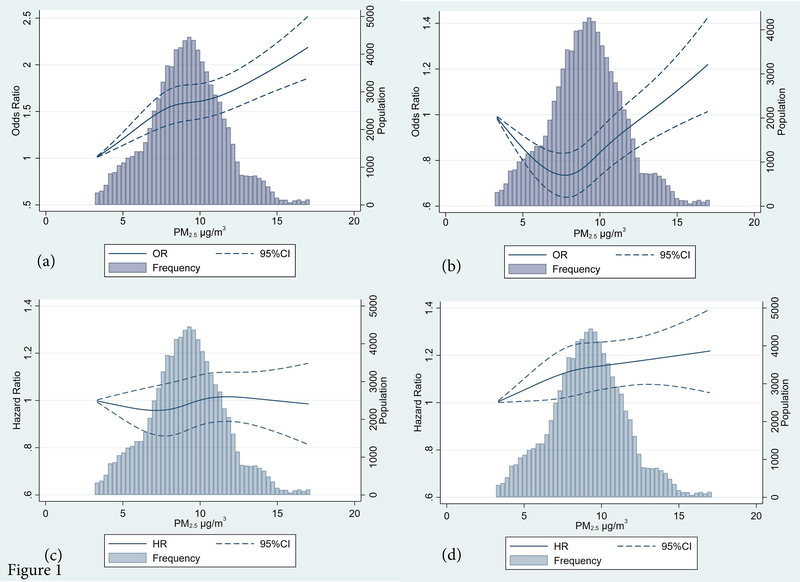
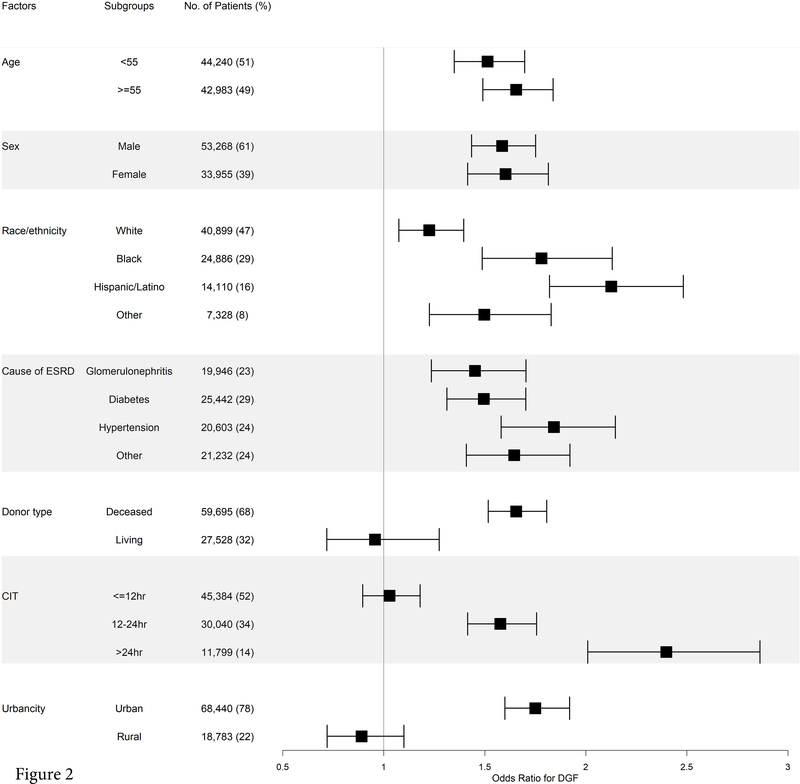
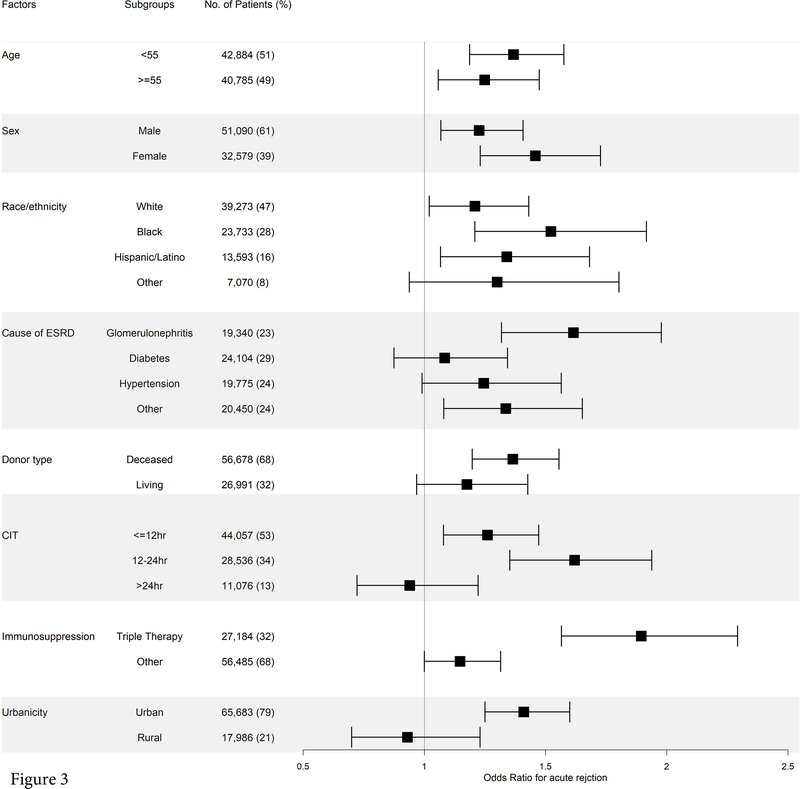
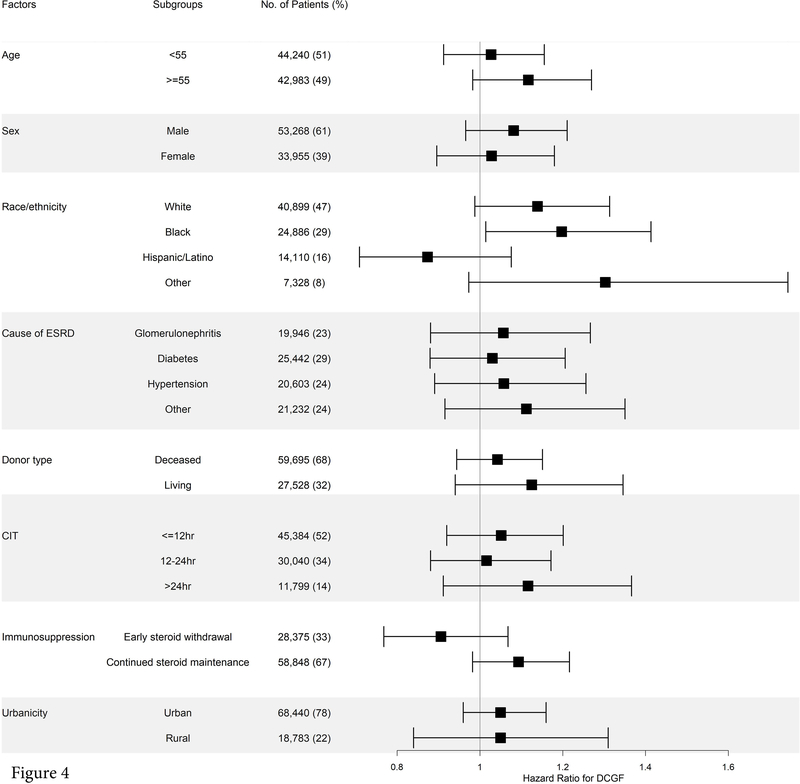
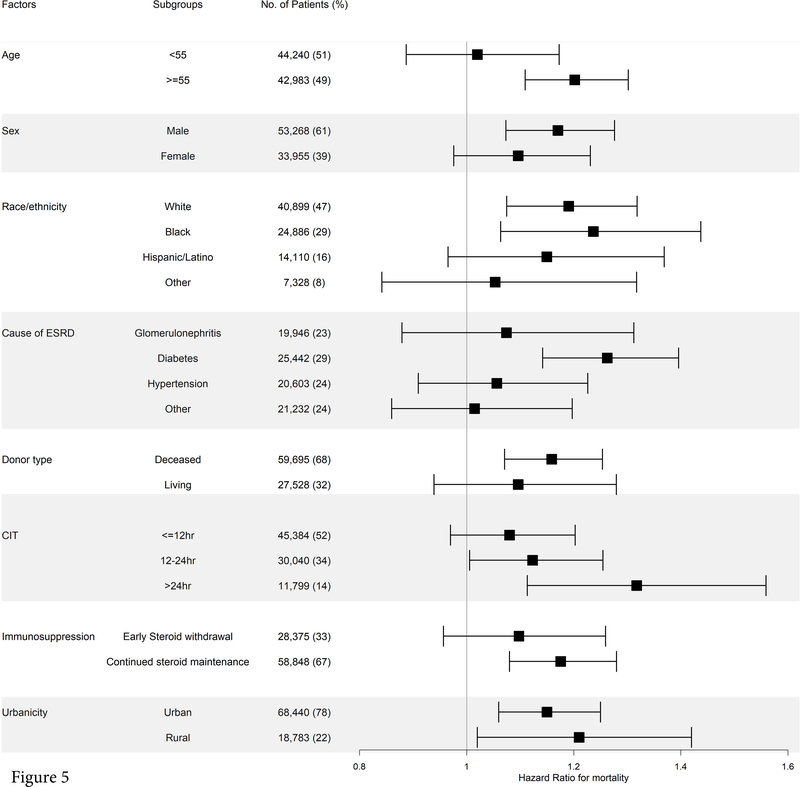
Fine particulate matter (PM2.5 ), a common form of air pollution which can induce systemic inflammatory response, is a risk factor for adverse health outcomes. Kidney transplant (KT) recipients are likely vulnerable to PM2.5 due to comorbidity and chronic immunosuppression. We sought to quantify the association between PM2.5 and post-KT outcomes. For adult KT recipients (1/1/2010-12/31/2016) in the Scientific Registry of Transplant Recipients, we estimated annual zip-code level PM2.5 concentrations at the time of KT using NASA's SEDAC Global PM2.5 Grids. We determined the associations between PM2.5 and delayed graft function (DGF) and 1-year acute rejection using logistic regression and death-censored graft failure (DCGF) and mortality using Cox proportional hazard models. All models were adjusted for sociodemographics, recipient, transplant, and ZIP code level confounders. Among 87 233 KT recipients, PM2.5 was associated with increased odds of DGF (OR = 1.59; 95% CI: 1.48-1.71) and 1-year acute rejection (OR = 1.31; 95% CI: 1.17-1.46) and increased risk of all-cause mortality (HR = 1.15; 95% CI: 1.07-1.23) but not DCGF (HR = 1.05; 95% CI: 0.97-1.51). In conclusion, PM2.5 was associated with higher odds of DGF and 1-year acute rejection and elevated risk of mortality among KT recipients. Our study highlights the importance of considering environmental exposure as risk factors for post-KT outcomes.
Keywords: clinical research/practice; health services and outcomes research; kidney transplantation/nephrology; patient survival; registry/registry analysis.
© 2021 The Authors. American Journal of Transplantation published by Wiley Periodicals LLC on behalf of The American Society of Transplantation and the American Society of Transplant Surgeons.
Conflict of interest statement
DISCLOSURE
The authors of this manuscript have conflicts of interest to disclose as described by the
Figures
Comment in
-
Ecological factors and posttransplant outcomes: Causation or correlation?Am J Transplant. 2021 Oct;21(10):3219-3220. doi: 10.1111/ajt.16716. Epub 2021 Jul 12. Am J Transplant. 2021. PMID: 34117719 Free PMC article. No abstract available.
Similar articles
-
Association of Ambient Fine Particulate Matter Air Pollution With Kidney Transplant Outcomes.JAMA Netw Open. 2021 Oct 1;4(10):e2128190. doi: 10.1001/jamanetworkopen.2021.28190. JAMA Netw Open. 2021. PMID: 34618038 Free PMC article.
-
Kidney transplant outcomes in recipients with visual, hearing, physical and walking impairments: a prospective cohort study.Nephrol Dial Transplant. 2020 Jul 1;35(7):1262-1270. doi: 10.1093/ndt/gfz164. Nephrol Dial Transplant. 2020. PMID: 31411724 Free PMC article.
-
Delayed Graft Function in Simultaneous Liver Kidney Transplantation.Transplantation. 2020 Mar;104(3):542-550. doi: 10.1097/TP.0000000000002908. Transplantation. 2020. PMID: 31403551 Free PMC article.
-
In kidney recipients from the same deceased donor, discordance in delayed graft function is associated with the worst outcomes.Clin Transplant. 2022 Sep;36(9):e14779. doi: 10.1111/ctr.14779. Epub 2022 Jul 27. Clin Transplant. 2022. PMID: 35848635 Review.
-
Effect of blood transfusion post kidney transplantation on de novo human leukocytes antigen donor-specific antibody development and clinical outcomes in kidney transplant recipients: A systematic review and meta-analysis.Transpl Immunol. 2023 Jun;78:101801. doi: 10.1016/j.trim.2023.101801. Epub 2023 Feb 24. Transpl Immunol. 2023. PMID: 36841513
Cited by
-
Association Between Long‑Term Exposure to Air Pollution and the Rate of Mortality After Hip Fracture Surgery in Patients Older Than 60 Years: Nationwide Cohort Study in Taiwan.JMIR Public Health Surveill. 2024 Mar 18;10:e46591. doi: 10.2196/46591. JMIR Public Health Surveill. 2024. PMID: 38342504 Free PMC article.
-
Ecological factors and posttransplant outcomes: Causation or correlation?Am J Transplant. 2021 Oct;21(10):3219-3220. doi: 10.1111/ajt.16716. Epub 2021 Jul 12. Am J Transplant. 2021. PMID: 34117719 Free PMC article. No abstract available.
-
The Physiological Effects of Air Pollution: Particulate Matter, Physiology and Disease.Front Public Health. 2022 Jul 14;10:882569. doi: 10.3389/fpubh.2022.882569. eCollection 2022. Front Public Health. 2022. PMID: 35910891 Free PMC article. Review.
-
Place-based heterogeneity in lung transplant recipient outcomes.Am J Transplant. 2022 Dec;22(12):2981-2989. doi: 10.1111/ajt.17170. Epub 2022 Aug 25. Am J Transplant. 2022. PMID: 35962587 Free PMC article.
-
Adverse Effects of fine particulate matter on human kidney functioning: a systematic review.Environ Health. 2022 Feb 8;21(1):24. doi: 10.1186/s12940-021-00827-7. Environ Health. 2022. PMID: 35135544 Free PMC article.
References
-
- Brook RD, Rajagopalan S, Pope CA 3rd, Brook JR, Bhatnagar A, Diez-Roux AV et al. Particulate matter air pollution and cardiovascular disease: An update to the scientific statement from the American Heart Association. Circulation 2010;121(21):2331–2378. - PubMed
Publication types
MeSH terms
Grants and funding
LinkOut - more resources
Full Text Sources
Other Literature Sources
Medical
