. 2021 Jul 29;38(8):3247-3266.
doi: 10.1093/molbev/msab099.

Inferring Adaptive Codon Preference to Understand Sources of Selection Shaping Codon Usage Bias

Affiliations

Inferring Adaptive Codon Preference to Understand Sources of Selection Shaping Codon Usage Bias

Janaina Lima de Oliveira et al. Mol Biol Evol. .

Abstract

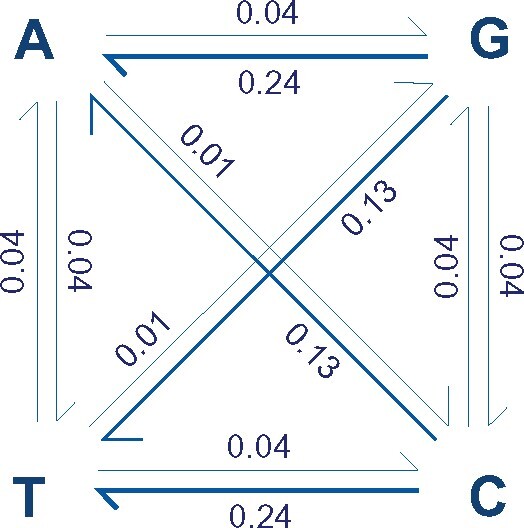
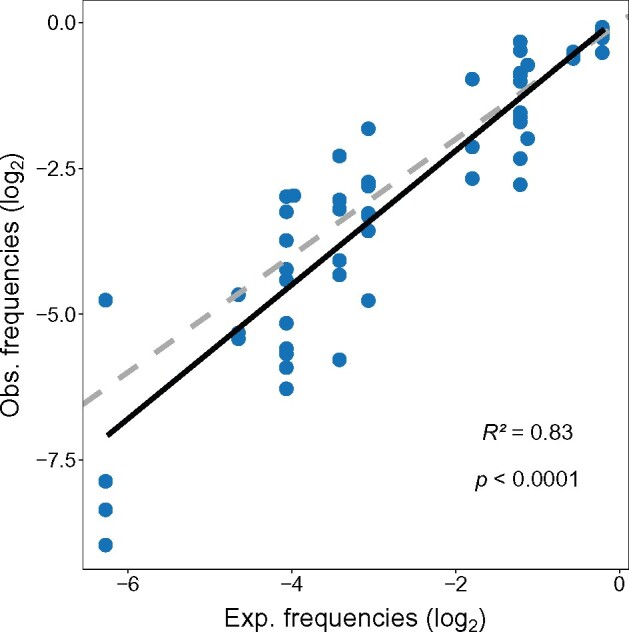
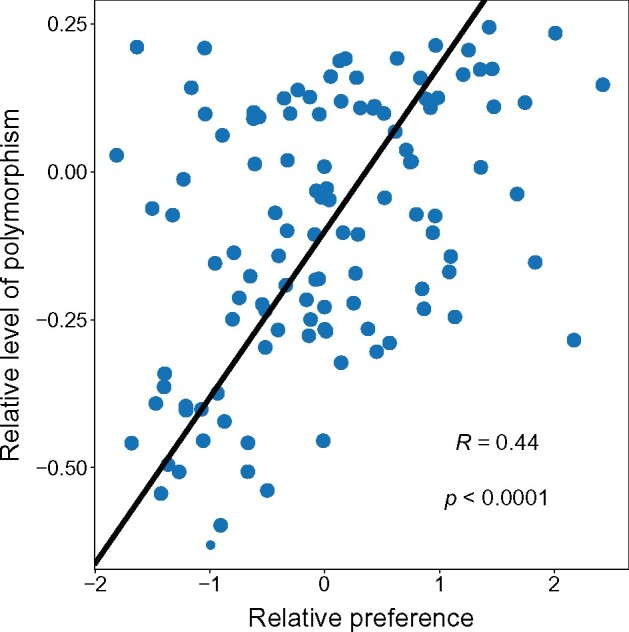
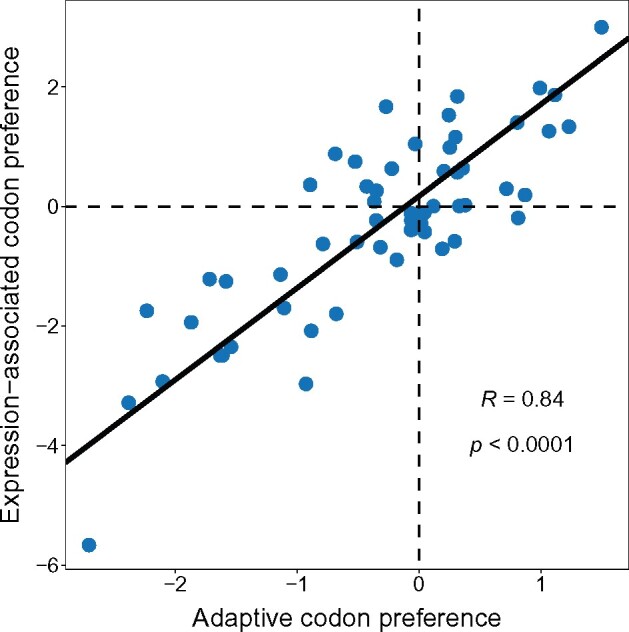
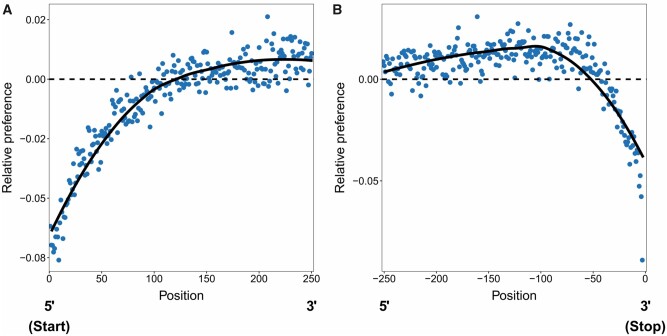
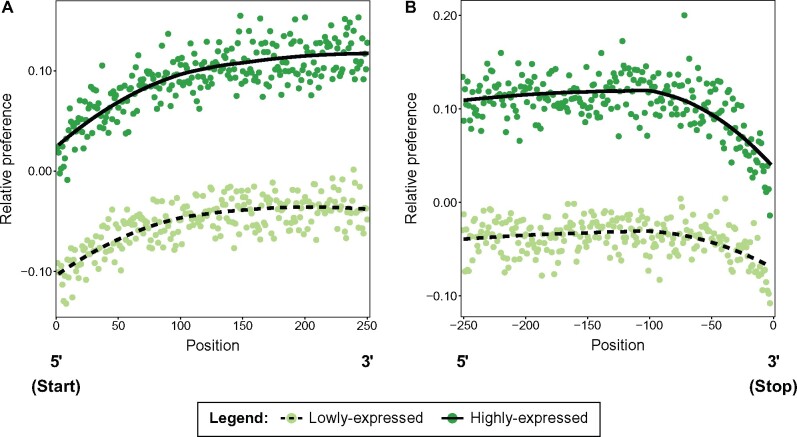
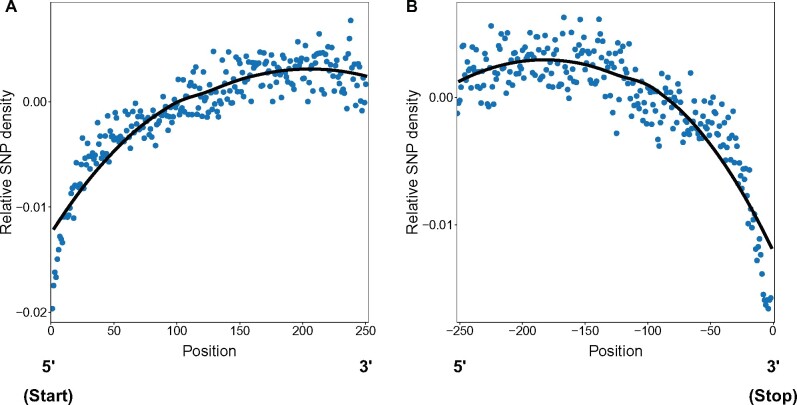
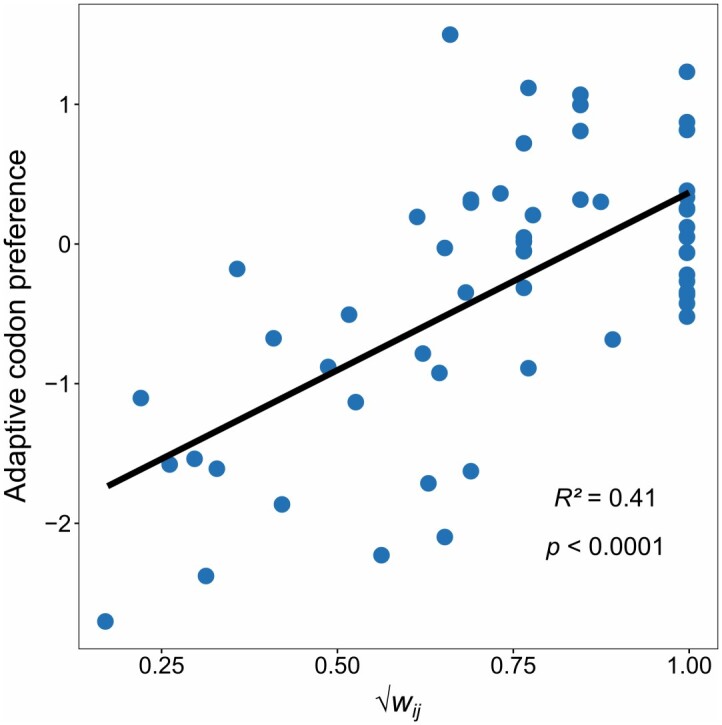
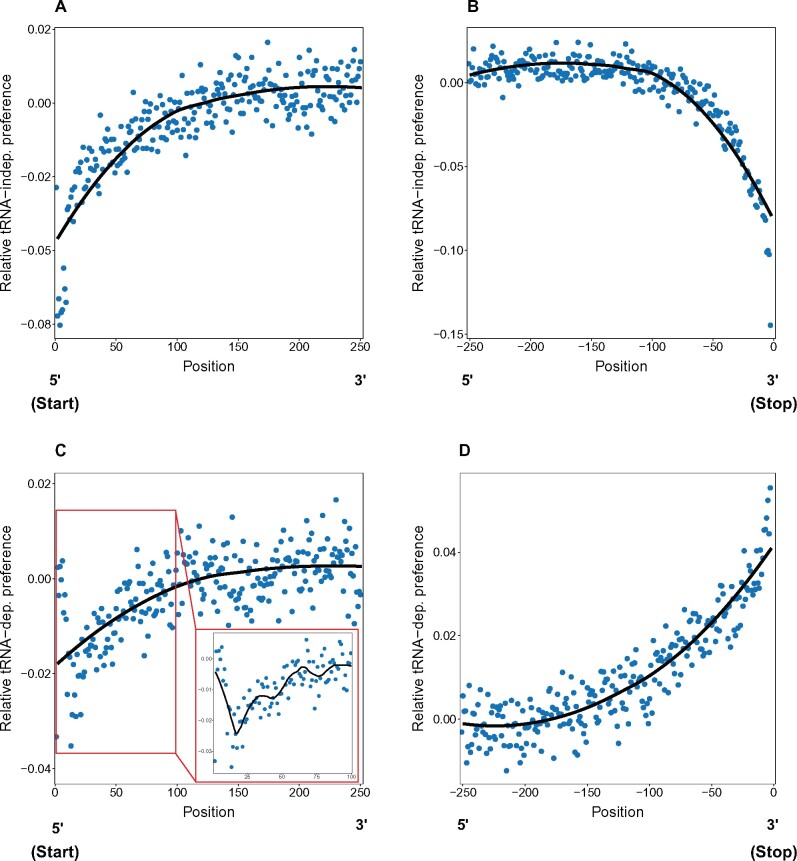
Alternative synonymous codons are often used at unequal frequencies. Classically, studies of such codon usage bias (CUB) attempted to separate the impact of neutral from selective forces by assuming that deviations from a predicted neutral equilibrium capture selection. However, GC-biased gene conversion (gBGC) can also cause deviation from a neutral null. Alternatively, selection has been inferred from CUB in highly expressed genes, but the accuracy of this approach has not been extensively tested, and gBGC can interfere with such extrapolations (e.g., if expression and gene conversion rates covary). It is therefore critical to examine deviations from a mutational null in a species with no gBGC. To achieve this goal, we implement such an analysis in the highly AT rich genome of Dictyostelium discoideum, where we find no evidence of gBGC. We infer neutral CUB under mutational equilibrium to quantify "adaptive codon preference," a nontautologous genome wide quantitative measure of the relative selection strength driving CUB. We observe signatures of purifying selection consistent with selection favoring adaptive codon preference. Preferred codons are not GC rich, underscoring the independence from gBGC. Expression-associated "preference" largely matches adaptive codon preference but does not wholly capture the influence of selection shaping patterns across all genes, suggesting selective constraints associated specifically with high expression. We observe patterns consistent with effects on mRNA translation and stability shaping adaptive codon preference. Thus, our approach to quantifying adaptive codon preference provides a framework for inferring the sources of selection that shape CUB across different contexts within the genome.

Keywords: biased gene conversion; codon usage bias; translation; weak selection.


Figures

Fig. 1.
Fig. 1.
Nucleotide substitution matrix. For each SNP, variants were classified as ancestral (the nucleotide segregating at higher frequency) or derived (the nucleotide segregating at lower frequency). Derived variants were considered mutations from the ancestral allele, and the proportion of all mutations from one nucleotide to each other nucleotide was estimated. Values are proportions of mutations that belong to each category. For example, 1% of all mutations are A to C transversions.
Fig. 2.
Fig. 2.
Base composition at mutational equilibrium (GCeq) explains most of the variation in the relative frequencies of synonymous codon usage (with both frequencies on a log2 scale). The solid line represents the best-fit relationship (from a regression of observed frequencies on expected, where intercept = 0.1 slope = 1.15), whereas the dashed line indicates the 1:1 relationship.
Fig. 3.
Fig. 3.
The relative level of polymorphism in each class of synonymous mutation is positively correlated to the relative preference associated with that synonymous change. “The relative level of polymorphism” is the log10 difference between the proportion of polymorphism in a mutational class compared with the neutral expectation. The “relative preference” is defined as the difference between the preference of the codon associated with a given synonymous mutation and the average preference of all synonymous mutational options for the given resident codon. Individual points correspond to the different possible synonymous mutational classes. The line represents the best-fit line from a reduced major axis regression model.
Fig. 4.
Fig. 4.
Adaptive codon preference is correlated to, but not the same as, codon preference derived from highly expressed genes. “Expression-associated codon preference” is defined by comparing codon use from the 1,000 most highly expressed genes to the 1,000 most lowly expressed, whereas “adaptive codon preference” represents deviations of relative codon frequencies from the mutational null. The line represents the best fit from a reduced major axis regression model.
Fig. 5.
Fig. 5.
Patterns of codon preference across codon positions within genes. (A) the average relative codon preference starting from the beginning of genes, (B) and leading up to the stop codon (indicated by position zero, so negative positions are distances before the stop codon). In both plots, the lines represent splines (from an LOESS model), dashed lines represent the genome-wide average preference (zero), and the points represent the individual estimates at each codon position. Relative codon preference represents the average preference of codons present at each codon position relative to (i.e., as a deviation from) the genome-wide average (so a value of zero indicates a match to the genome-wide average, whereas negative values indicate preference below the overall average, etc.).
Fig. 6.
Fig. 6.
Patterns of codon preference across codon positions within lowly and highly expressed genes. In both plots, the lines represent splines (from an LOESS model; solid line = highly expressed genes, dashed line = lowly expressed genes) and the points represent the individual estimates at each codon position (darker points = highly expressed genes, lighter points = lowly expressed genes). (A) Pattern of codon preference starting from the beginning of genes, (B) pattern of codon preference leading up to the stop codon (indicated by position zero, so negative positions are distances before the stop codon). Average preference of codons is measured relative to (i.e., as a deviation from) the genome-wide value.
Fig. 7.
Fig. 7.
Relative SNP density across codon positions at the beginning and ends of genes. The relative SNP density is the difference between the observed SNP density at a codon position (as a proportion of all SNPs) and that expected based on the expected local mutation rate, which depends on the average GC content at the position.
Fig. 8.
Fig. 8.
Codon preference is correlated to the relative codon adaptation index (wij; after square-root transformation). Codon preference represents the deviation of relative codon frequencies from the neutral expectation at mutational equilibrium.
Fig. 9.
Fig. 9.
Patterns of average relative tRNA-dependent and tRNA-independent codon preference across codon positions within genes. The first two panels (A and B) show patterns of tRNA-independent preference at the beginning (A) and the ends of genes (B). The other two panels (C and D) show patterns of tRNA-dependent preference at the beginning (C) and ends (D) of genes. At the beginning of genes, codon positions are numbered from the start codon, whereas at the ends of genes, the negative positions give the distance before the stop codon. In all plots, the lines represent splines (from an LOESS model), and the points represent the individual estimates at each codon position. All preference values are given as deviations from the genome-wide mean for that given type of preference (so the zero position indicates values that match the overall mean).

References

    1. Aken BL, Ayling S, Barrell D, Clarke L, Curwen V, Fairley S, Fernandez Banet J, Billis K, García Girón C, Hourlier T, et al. 2016. The Ensembl gene annotation system. Database (Oxford) 2016:baw093. - PMC - PubMed
    1. Allert M, Cox JC, Hellinga HW.. 2010. Multifactorial determinants of protein expression in prokaryotic open reading frames. J Mol Biol. 402(5):905–918. - PMC - PubMed
    1. Bentele K, Saffert P, Rauscher R, Ignatova Z, Blüthgen N.. 2013. Efficient translation initiation dictates codon usage at gene start. Mol Syst Biol. 9:675. - PMC - PubMed
    1. Bloomfield G, Paschke P, Okamoto M, Stevens TJ, Urushihara H.. 2019. Triparental inheritance in Dictyostelium. Proc Natl Acad Sci U S A. 116(6):2187–2192. - PMC - PubMed
    1. Boël G, Letso R, Neely H, Price WN, Wong K-H, Su M, Luff JD, Valecha M, Everett JK, Acton TB, et al. 2016. Codon influence on protein expression in E. coli correlates with mRNA levels. Nature 529(7586):358–363. - PMC - PubMed

Publication types