. 2021 Aug 13;33(7):2164-2182.
doi: 10.1093/plcell/koab113.

Time of the day prioritizes the pool of translating mRNAs in response to heat stress

Affiliations

Time of the day prioritizes the pool of translating mRNAs in response to heat stress

Titouan Bonnot et al. Plant Cell. .

Abstract

The circadian clock helps organisms to anticipate and coordinate gene regulatory responses to changes in environmental stimuli. Under growth limiting temperatures, the time of the day modulates the accumulation of polyadenylated mRNAs. In response to heat stress, plants will conserve energy and selectively translate mRNAs. How the clock and/or the time of the day regulates polyadenylated mRNAs bound by ribosomes in response to heat stress is unknown. In-depth analysis of Arabidopsis thaliana translating mRNAs found that the time of the day gates the response of approximately one-third of the circadian-regulated heat-responsive translatome. Specifically, the time of the day and heat stress interact to prioritize the pool of mRNAs in cue to be translated. For a subset of mRNAs, we observed a stronger gated response during the day, and preferentially before the peak of expression. We propose previously overlooked transcription factors (TFs) as regulatory nodes and show that the clock plays a role in the temperature response for select TFs. When the stress was removed, the redefined priorities for translation recovered within 1 h, though slower recovery was observed for abiotic stress regulators. Through hierarchical network connections between clock genes and prioritized TFs, our work provides a framework to target key nodes underlying heat stress tolerance throughout the day.


Figures

Figure 1
Figure 1
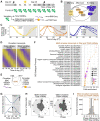
The Arabidopsis circadian transcriptome and translatome. A, Experimental design. B, Simplified circadian clock model showing connections and timing of expression of the clock components. C, Transcript profiles of circadian clock genes in total mRNAs. Data are from RNA-seq, and are scaled (means, n =3). A spline function was used to connect time points. D, Heatmaps of the 8,028 and 10,657 transcripts exhibiting significant circadian oscillations in total and TRAP mRNAs, respectively. Data are scaled by row and are ordered by phase (timing of peak of abundance). The color scale represents the normalized transcript level, with yellow and purple representing high and low transcript abundance, respectively. E, Venn diagram depicting the overlapping circadian transcripts between total and TRAP mRNAs. F, Selected over-represented GO biological processes in the list of 6,840 circadian transcripts described in (E). For all enriched terms, see Supplemental Data Set S3. G, Diagram defining the phase as the time of peak abundance, a phase of 0 and 12 corresponding to a peak abundance occurring at dawn and on the evening, respectively. H, Circular plots representing the phase distribution of the circadian total and TRAP mRNAs. I, Histogram showing the phase difference between total and TRAP mRNAs for the 6,840 shared circadian transcripts. The dashed brown rectangle highlights circadian transcripts having a phase difference of 1.5 h or less between the two mRNA populations, which correspond to 88% of the shared transcripts. In A–C, G–H, gray areas represent the subjective night.
Figure 2
Figure 2
Identification of translatome-specific circadian transcripts. A, Venn diagrams showing the overlapping circadian transcripts identified in DIURNAL data sets (Mockler et al., 2007, Hsu and Harmer 2012; Romanowski et al., 2020), and the circadian total and TRAP mRNAs identified in Figure 1D; and the overlaps between the 667 TRAP-specific circadian transcripts and a diel translatome (Missra et al., 2015) and rhythmic proteome data sets (Krahmer et al., 2019). Red font and red shading highlight the 667 TRAP-specific circadian transcripts. Additional comparisons are shown in Supplemental Figure S3. B and C, Heatmap (B) and over-represented GO biological processes (C) of the 667 TRAP-specific circadian transcripts. In (B), data are scaled by row and ordered by phase. The color scale represents the normalized transcript level, with yellow and purple representing high and low transcript abundance, respectively. D, Transcript profiles of selected TRAP-specific circadian genes involved in the cell cycle (means ± sd, n =3). Grey areas represent the subjective night. All panels correspond to data obtained at 22°C
Figure 3
Figure 3
Heat stress regulates circadian genes at both transcriptional and translational levels. A, Experimental design. B, Venn diagram depicting the overlapping circadian DRGs between total and TRAP mRNAs. C, Selected enriched biological processes in the sets of upregulated and downregulated circadian DRGs. For all enriched terms, see Supplemental Data Set S3. D, Principal component analysis (PCA) of the 5,445 circadian DRGs. PC1 and PC2 separate temperatures and mRNA populations, respectively, and PC3 and PC4 separate times of the day. Gray lines link times of the day, from early morning to late night. E, Bar plots representing numbers of DRGs in Total and TRAP mRNAs at the different times of the day (upper plots), and numbers of DRGs responding to heat stress at a single time of day (1) to all times of day (8) and either specifically in total or TRAP mRNAs, or both (lower plots). F, Transcript abundance of major circadian clock genes, HSP90-3 and PIP2,3, in total and TRAP mRNAs (means ± sd, n =3). Stars above the plots indicate a significant difference between measurements taken at 37°C and 22°C (FDR <0.05 and log2 fold change > |1|). In (A) and (F), gray areas represent the subjective night
Figure 4
Figure 4
Timing effect of heat stress on the circadian translatome. A, Transcript abundance of selected genes in total and TRAP mRNAs (means ± sd, n =3). Stars above the plots indicate a significant difference between 37°C and 22°C (FDR <0.05 and log2 fold change > |1|). B, Example representing how the phase enrichment is calculated. C, Circular plots showing the phase enrichment at each time of the day (ZT48–ZT69) of the 4,524 circadian TRAP DRGs, as compared to all circadian TRAP mRNAs (10,657). Highlighting that significant upregulation occur primarily when heat stress occurred before or after but not during the peak of transcript abundance. At each time of the day, the number of circadian TRAP DRGs is indicated in parentheses. In (A) to (C), gray areas represent the subjective night. D, Histograms representing the proportions of DRGs with a similar response to heat at all times of the day
Figure 5
Figure 5
Time of the day influences the magnitude of response to heat. A, Groups of circadian TRAP DRGs whose magnitude of response to heat stress is dependent (groups 3–4) or not (groups 1 and 2) on the time of the day. A likelihood ratio test looking at the statistical interaction between the effects of temperature and time of the day was used for this analysis (Supplemental Data Set S4). For each group, phase distributions are represented, bars representing the number of TRAP DRGs for each phase. Phase proportions were compared to proportions in all circadian TRAP mRNAs (10,657). Below phase plots, transcript abundance profiles of two selected genes within the group are shown (means ± sd, n =3). Stars above the plots indicate a significant difference between 37°C and 22°C (FDR < 0.05 and log2 fold change > |1|). Data correspond to TRAP mRNAs. Gray areas from ZT60 to ZT72 represent the subjective night. Numbers in parentheses indicate the total number of DRGs within the groups. B, Model representing a hierarchy between groups of transcripts to access ribosomes under heat stress
Figure 6
Figure 6
Circadian networks of TFs translationally regulated by heat stress. Network of TFs exhibiting circadian oscillations and differentially regulated under heat stress in TRAP mRNAs; and identified as targets of proteins encoded by clock genes in published ChIP-Seq analyses were selected to build the networks. Edges correspond to interactions between clock proteins and their targets. In (A), all nodes except CCA1, LHY, PRR5, LUX, and TOC1 belong to group 3 presented in Figure 5A and clock gene targets are sorted by TF family. In (B), target nodes correspond to all clock targets that are TFs exhibiting circadian oscillations and differentially regulated under heat stress at the translatome level. The accession numbers for all genes represented in the network are provided in Supplemental Data Set S11. Edge colors differentiate targets of the different clock proteins. Nodes on the external layer (e.g. PIF7) correspond to TFs targeted by one clock protein and nodes on the internal layer (e.g. CDF1) are targeted by at least two clock proteins. Nodes are sorted by the timing of peak abundance of the corresponding transcript, from ZT0 (early morning) to ZT22.5 (end of night). Node colors reflect the heat stress response of the corresponding transcript and correspond to the average of log2 fold change values obtained in TRAP mRNAs. The grey area represents the subjective night. Names of TFs connected in the network presented in (A) are highlighted (e.g. DREB2A)
Figure 7
Figure 7
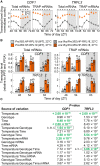
Influence of the circadian clock on the heat stress response of selected TFs. A and B, Transcript levels of selected heat-responsive TFs measured by RNA-Seq (A) and RT-qPCR (B; means ± sd, n =3). In (A), stars above the plots indicate a significant difference between measurements taken at 37°C and 22°C (FDR < 0.05 and log2 fold change > |1|). In (B), transcript levels were measured in the WT (Pro35S:HF-RPL18) and clock mutant (cca1 lhy/Pro35S:HF-RPL18). In (A) and (B), gray areas represent the subjective night. C, Multivariate analysis of variance of transcript abundance of selected TFs quantified in (B). Statistical significance (P <0.05) is indicated in bold and green (see Supplemental Table S2 for the full table of results). Tukey’s HSD tests were performed to compare group levels for the significant sources of variation revealed by the multivariate analysis. To show the influence of the genotype on the temperature responses of the two selected TFs, letters were assigned to group levels significantly different based on Tukey’s HSD tests, for the interactions Temperature: Genotype (CDF1; A, B, C) and Temperature: Genotype: Time (TRFL3; a, b, c). For example, for CDF1, group levels for the significant interaction “Temperature: Genotype” were WT 22°C; WT 37°C; cca1 lhy 22°C and cca1 lhy 37°C. Tukey tests showed that cca1lhy 37°C group A was significantly higher than WT 37°C group B. These two group levels corresponding to heat stress data were significantly higher than group levels corresponding to data obtained at 22°C (WT 22°C and cca1 lhy 22°C, group C). Within each group level (e.g. WT 22°C), all times of the day and both mRNA populations were considered
Figure 8
Figure 8
Recovery of the circadian translatome following a heat stress. A, Experimental design of the recovery experiment. B, Numbers of DRGs after heat stress (0 h of recovery) and at 1, 3, and 6 h of recovery. C, Clustering analysis of the 2,824 TRAP circadian DRGs identified in the recovery experiment. The number of transcripts by group is indicated in parentheses. Clock genes and selected TFs are indicated in the corresponding group. On each cluster plot, the black dashed line represents a log2 fold change = 0 (i.e. no change between measurements taken at 37°C and at 22°C), the black solid line represents the mean and the gray shading represents the sd. D, Heatmap of selected TFs during recovery. The 29 selected TFs showed high priority to access ribosomes under heat stress (group 3, Figure 5A) and were identified as direct targets of clock proteins in published ChIP-Seq analyses (Figure 6A). These TFs were classified in groups B, D, or F in (C). Stars indicate significant differences between the recovery and control conditions. In (C) and (D), color scales represent log2 fold change values (Recovery versus Control)
None

References

    1. Adams S, Grundy J, Veflingstad SR, Dyer NP, Hannah MA, Ott S, Carré IA (2018) Circadian control of abscisic acid biosynthesis and signalling pathways revealed by genome-wide analysis of LHY binding targets. New Phytol 220:893–907 - PubMed
    1. Backman TWH, Girke T (2016) systemPipeR: NGS workflow and report generation environment. BMC Bioinform 17:388 - PMC - PubMed
    1. Bao Y, Howell SH (2017) The unfolded protein response supports plant development and defense as well as responses to abiotic stress. Front Plant Sci 8:1–6 - PMC - PubMed
    1. Benjamini Y, Hochberg Y (1995) Controlling the false discovery rate: a practical and powerful approach to multiple testing. J R Stat Soc Ser B 57:289–300
    1. Blair EJ, Bonnot T, Hummel M, Hay E, Marzolino JM, Quijada IA, Nagel DH (2019) Contribution of time of day and the circadian clock to the heat stress responsive transcriptome in Arabidopsis. Sci Rep 9:4814 - PMC - PubMed

Publication types

MeSH terms