Multicenter Study
. 2021 Jul;174(7):927-935.
doi: 10.7326/M20-5043. Epub 2021 Apr 20.

Treatment Patterns and Clinical Outcomes After the Introduction of the Medicare Sepsis Performance Measure (SEP-1)

Affiliations
Multicenter Study

Treatment Patterns and Clinical Outcomes After the Introduction of the Medicare Sepsis Performance Measure (SEP-1)

Ian J Barbash et al. Ann Intern Med. 2021 Jul.

Abstract

Background: Medicare requires that hospitals report on their adherence to the Severe Sepsis and Septic Shock Early Management Bundle (SEP-1).

Objective: To evaluate the effect of SEP-1 on treatment patterns and patient outcomes.

Design: Longitudinal study of hospitals using repeated cross-sectional cohorts of patients.

Setting: 11 hospitals within an integrated health system.

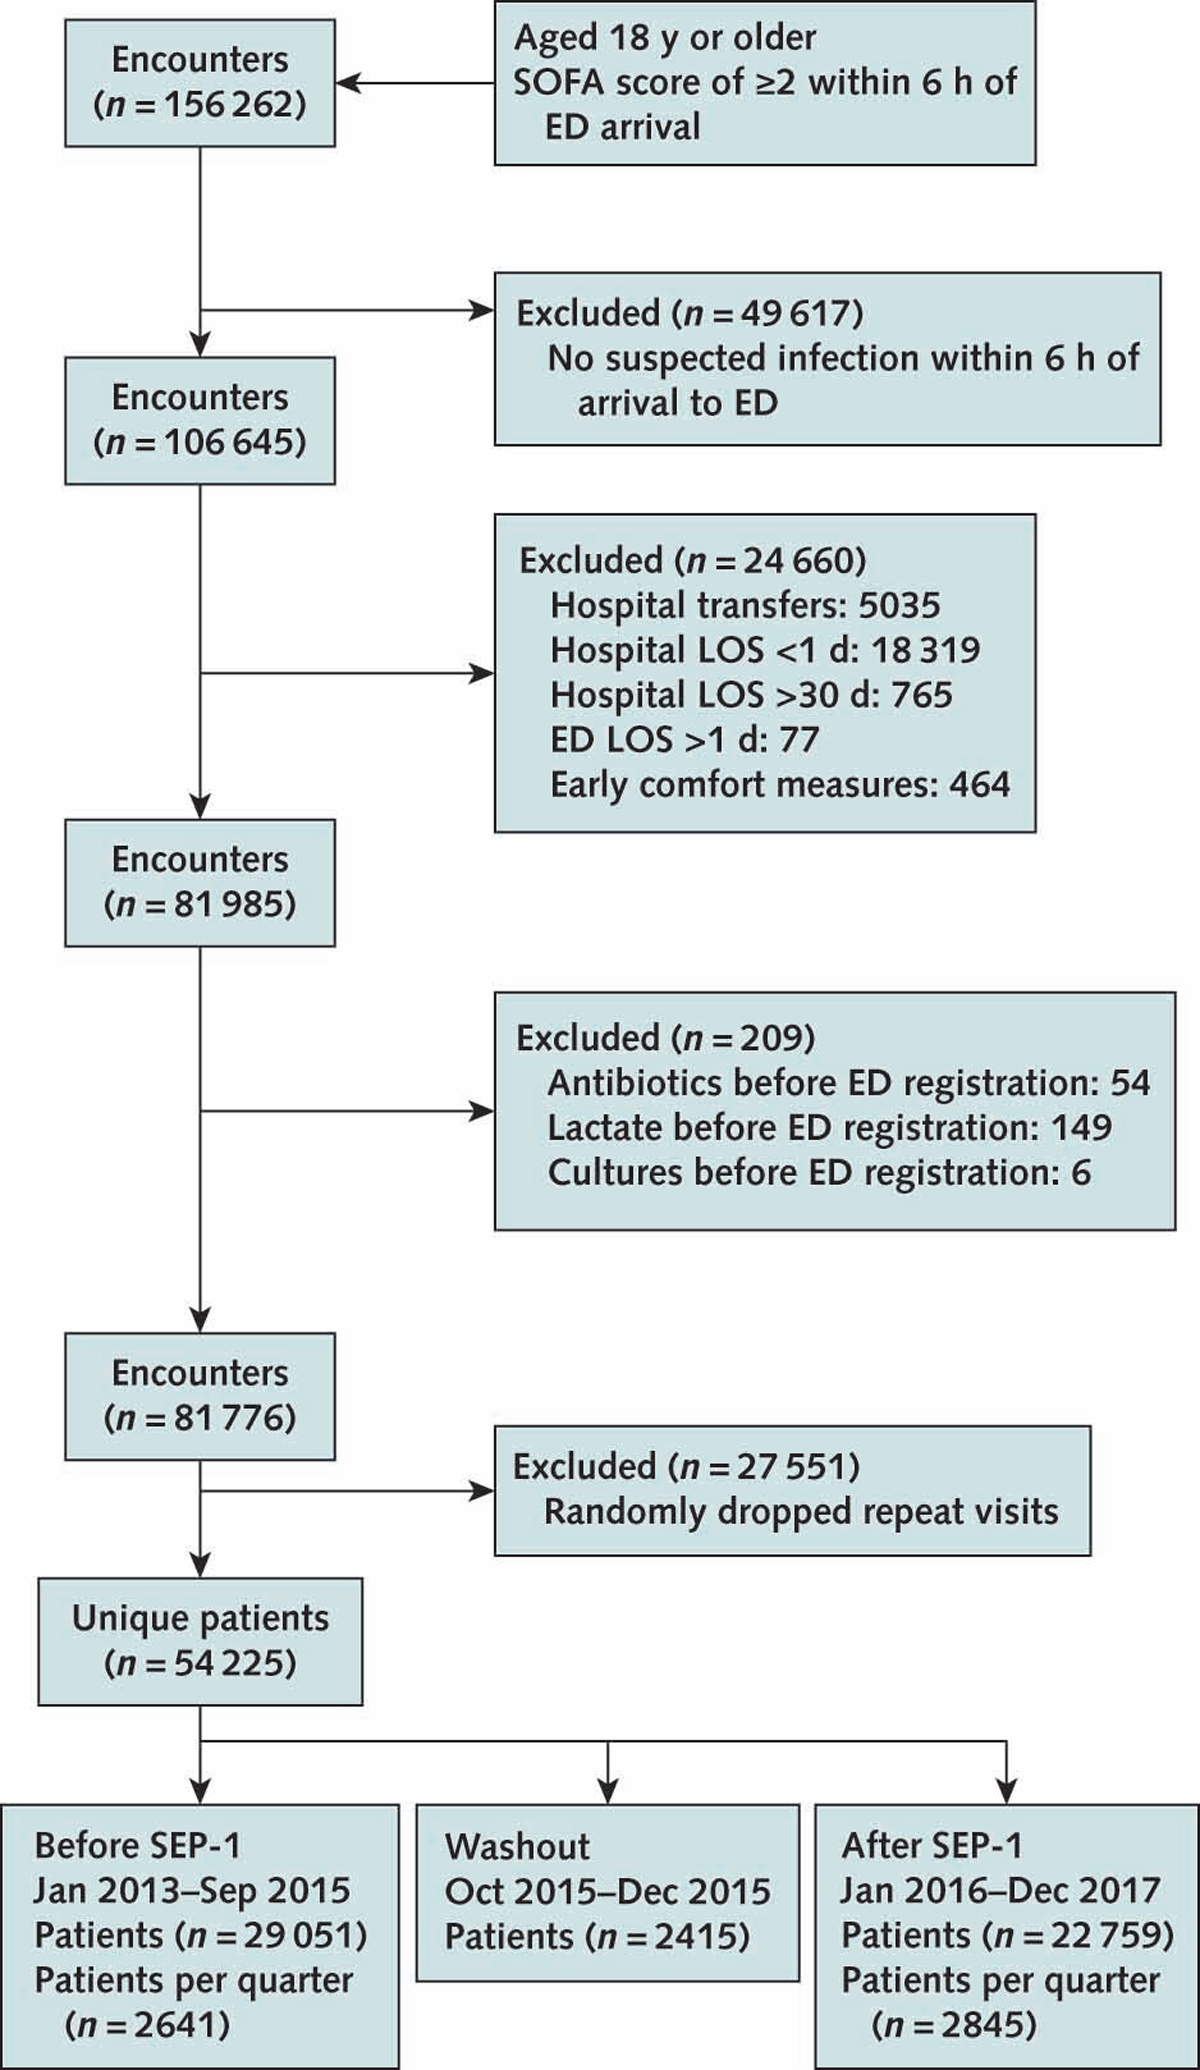
Patients: 54 225 encounters between January 2013 and December 2017 for adults with sepsis who were hospitalized through the emergency department.

Intervention: Onset of the SEP-1 reporting requirement in October 2015.

Measurements: Changes in SEP-1-targeted processes, including antibiotic administration, lactate measurement, and fluid administration at 3 hours from sepsis onset; repeated lactate and vasopressor administration for hypotension within 6 hours of sepsis onset; and sepsis outcomes, including risk-adjusted intensive care unit (ICU) admission, in-hospital mortality, and home discharge among survivors.

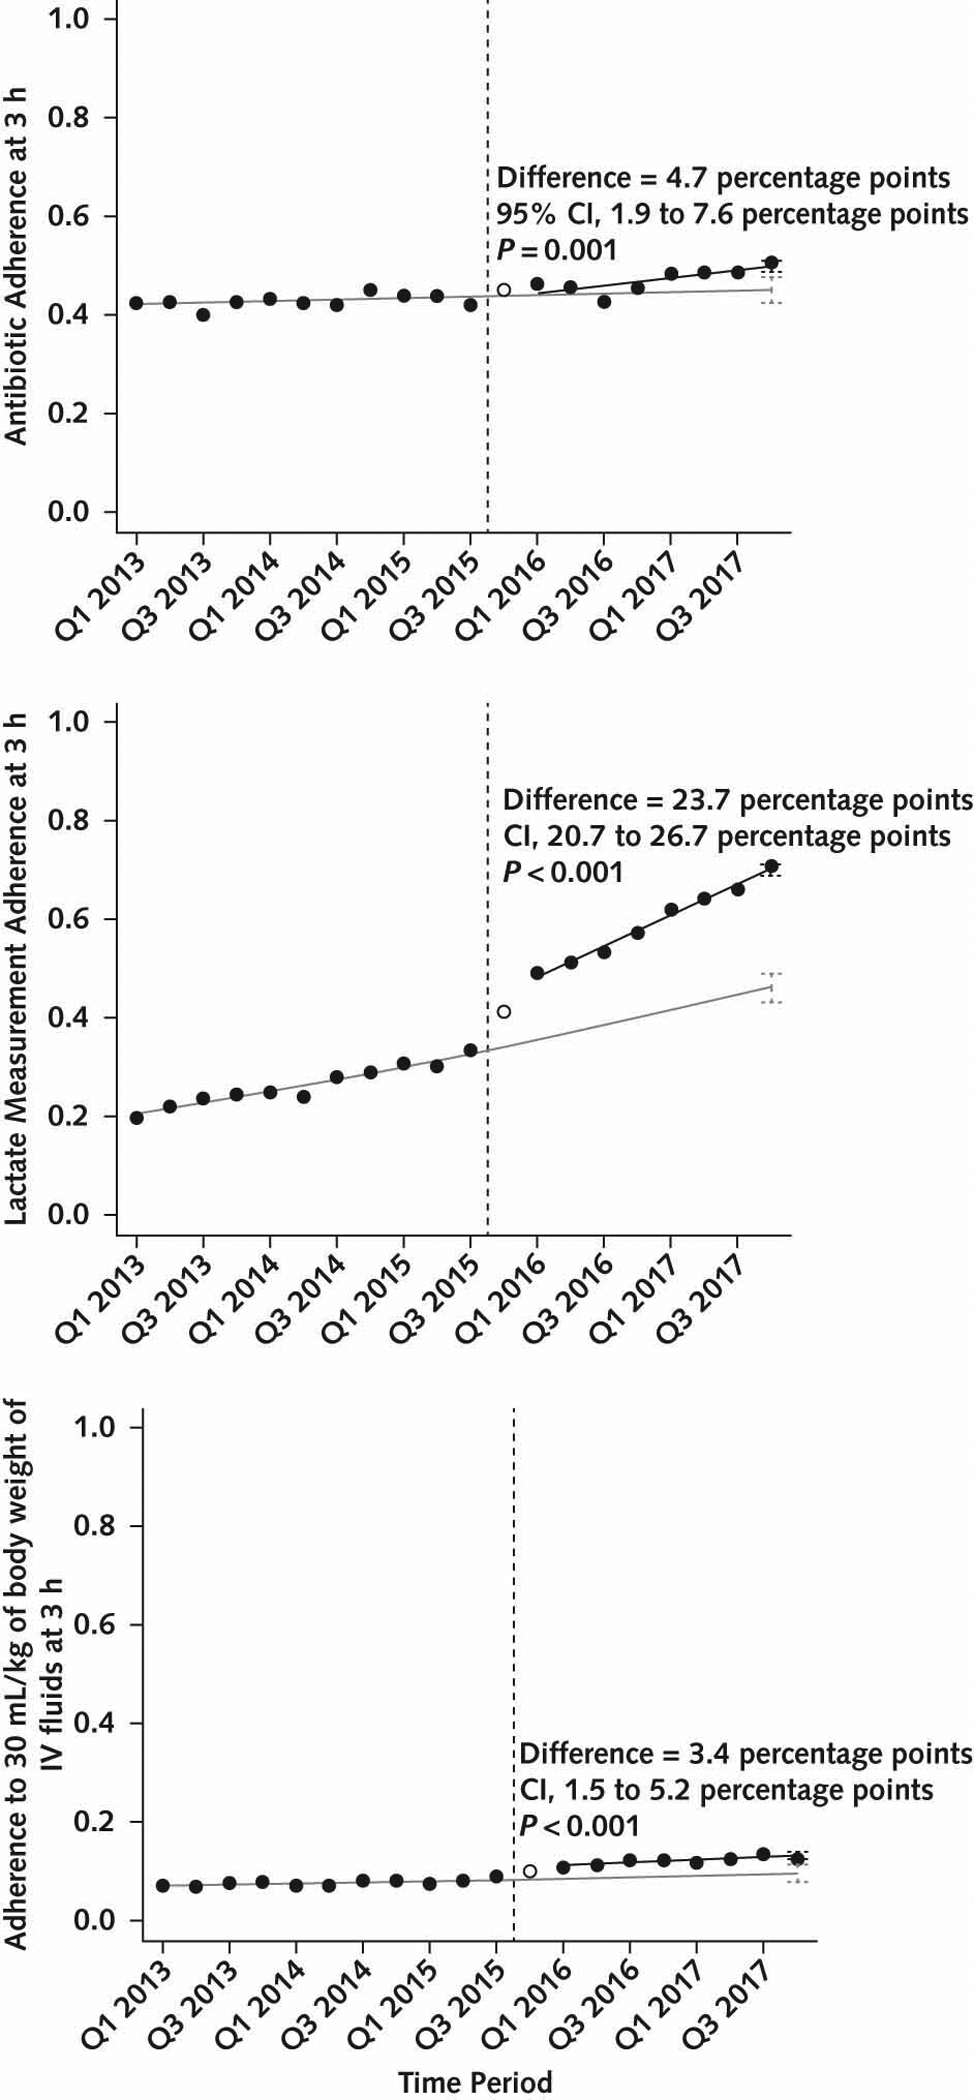
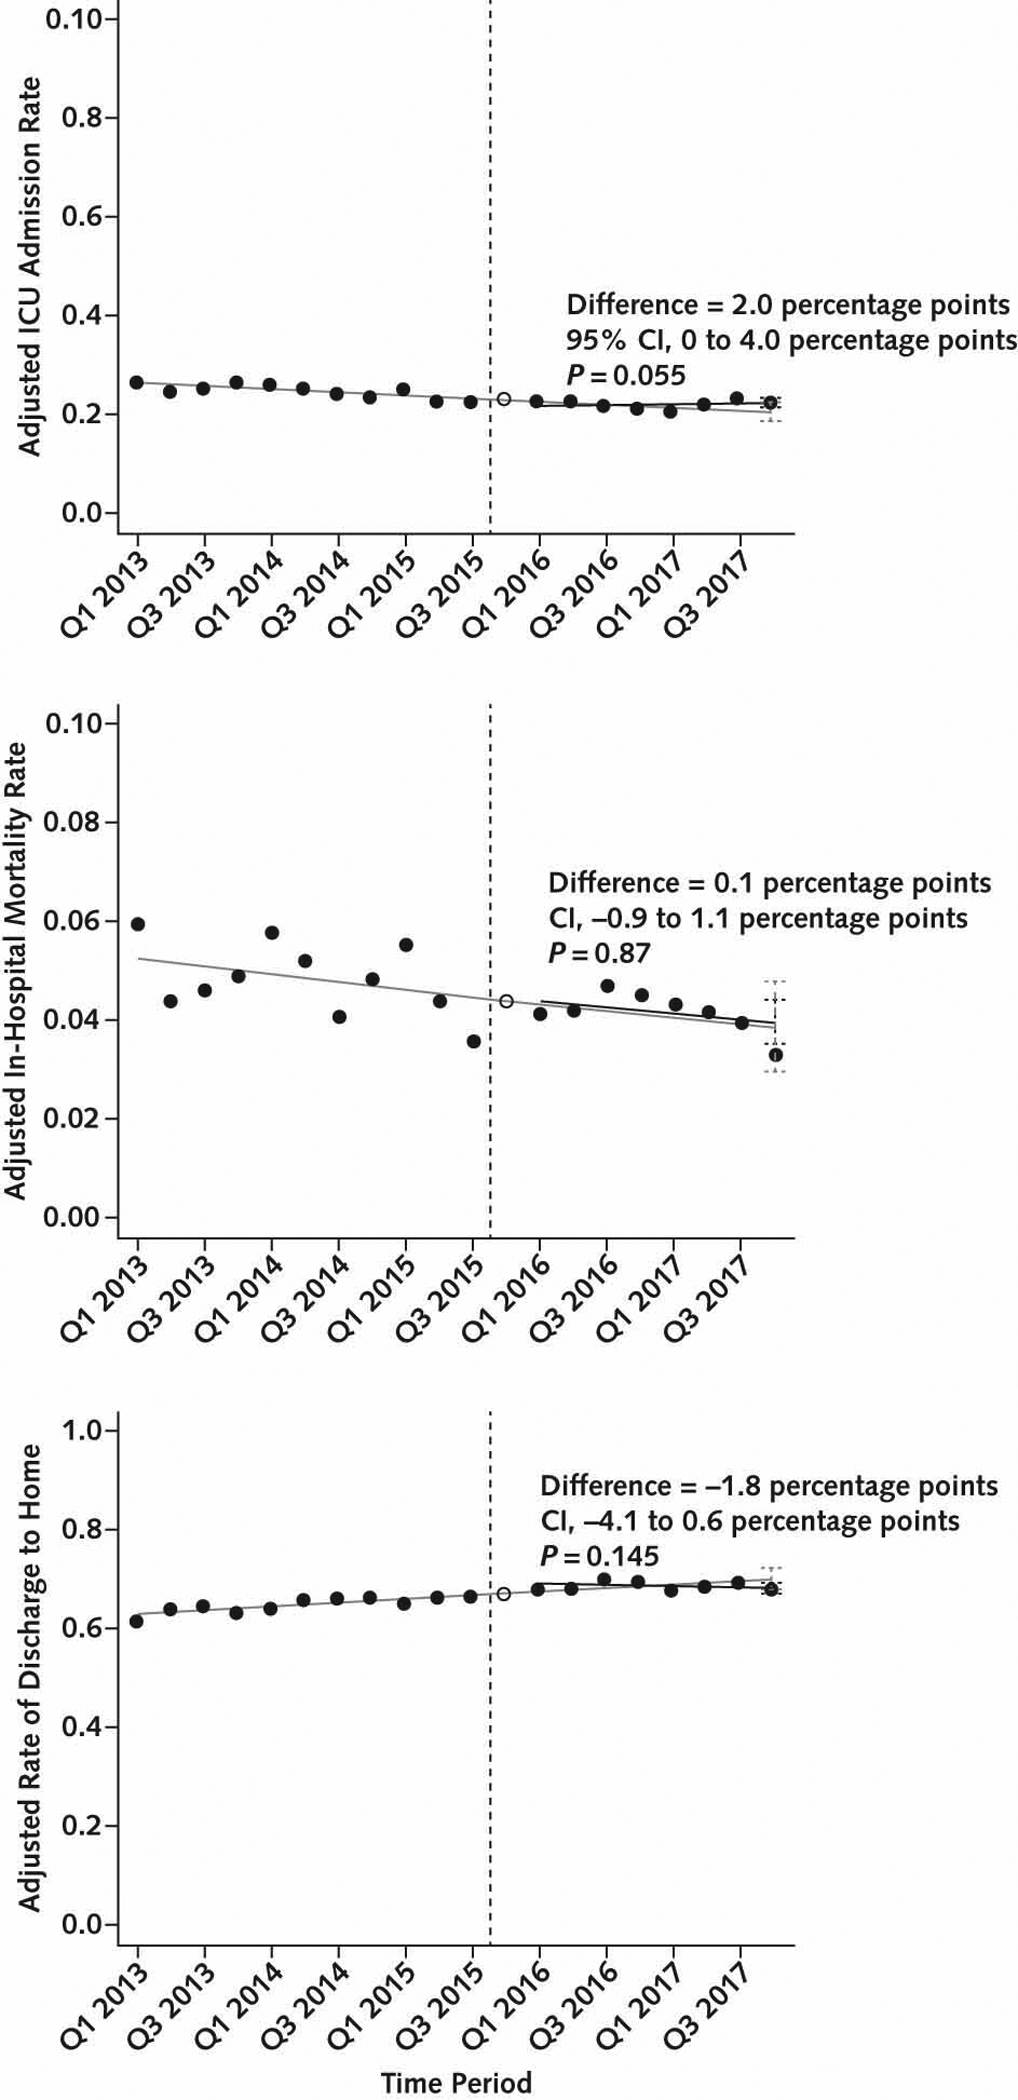
Results: Two years after its implementation, SEP-1 was associated with variable changes in process measures, with the greatest effect being an increase in lactate measurement within 3 hours of sepsis onset (absolute increase, 23.7 percentage points [95% CI, 20.7 to 26.7 percentage points]; P < 0.001). There were small increases in antibiotic administration (absolute increase, 4.7 percentage points [CI, 1.9 to 7.6 percentage points]; P = 0.001) and fluid administration of 30 mL/kg of body weight within 3 hours of sepsis onset (absolute increase, 3.4 percentage points [CI, 1.5 to 5.2 percentage points]; P < 0.001). There was no change in vasopressor administration. There was a small increase in ICU admissions (absolute increase, 2.0 percentage points [CI, 0 to 4.0 percentage points]; P = 0.055) and no changes in mortality (absolute change, 0.1 percentage points [CI, -0.9 to 1.1 percentage points]; P = 0.87) or discharge to home.

Limitation: Data are from a single health system.

Conclusion: Implementation of the SEP-1 mandatory reporting program was associated with variable changes in process measures, without improvements in clinical outcomes. Revising the measure may optimize its future effect.

Primary funding source: Agency for Healthcare Research and Quality.


Figures

Figure 1.
Figure 1.
Patient selection flow diagram. ED = emergency department; LOS = length of stay; SEP-1 = Severe Sepsis and Septic Shock Early Management Bundle; SOFA = Sequential Organ Failure Assessment.
Figure 2.
Figure 2.
Changes in unadjusted process measures in overall cohort. The solid black circles represent unadjusted quarterly rates of 3 process measures: antibiotics (top), lactate (middle), and IV fluids (bottom). The hollow circle is the washout quarter. The vertical dashed line is the time of SEP-1 implementation in Q4 2015. The solid gray line is baseline trend without SEP-1, fitted in the baseline period and projected into the post-SEP-1 period. The solid black line is the fitted line for the trend in the post-SEP-1 period. The black vertical error bars in Q4 2017 represent 95% CIs surrounding the point estimate for the expected value of the process measure from the fitted line in the presence of SEP-1. The gray vertical error bars in Q4 2017 represent 95% CIs surrounding the point estimate for the expected value of the process measure from the fitted line in the pre-SEP-1 baseline, projected into the post–SEP-1 period. The difference between these expected values is the effect estimate for SEP-1 in Q4 2017. IV = intravenous; Q = quarter; SEP-1 = Severe Sepsis and Septic Shock Early Management Bundle.
Figure 3.
Figure 3.
Changes in risk-adjusted outcome measures in overall cohort. The solid black circles represent risk-adjusted quarterly rates of 3 outcome measures: ICU admission (top), in-hospital mortality (middle), and discharge home among survivors (bottom). The hollow circle is the washout quarter. The vertical dashed line is the time of SEP-1 implementation in Q4 2015. The solid gray line is baseline trend without SEP-1, fitted in the baseline period and projected into the post–SEP-1 period. The solid black line is the fitted line for the trend in the post–SEP-1 period. The black vertical error bars in Q4 2017 represent 95% CIs surrounding the point estimate for the expected value of the outcome measure from the fitted line in the presence of SEP-1. The gray vertical error bars in Q4 2017 represent 95% CIs surrounding the point estimate for the expected value of the outcome measure from the fitted line in the pre-SEP-1 baseline, projected into the post–SEP-1 period. The difference between these expected values is the effect estimate for SEP-1 in Q4 2017. ICU = intensive care unit; Q = quarter; SEP-1 = Severe Sepsis and Septic Shock Early Management Bundle.

Comment in

References

    1. Rhee C, Dantes R, Epstein L, et al. Incidence and trends of sepsis in US hospitals using clinical vs claims data, 2009–2014. JAMA. 2017;318:1241–1249. doi:10.1001/jama.2017.13836 - DOI - PMC - PubMed
    1. Liu V, Escobar GJ, Greene JD, et al. Hospital deaths in patients with sepsis from 2 independent cohorts. JAMA. 2014;312:90–2. - PubMed
    1. Buchman TG, Simpson SQ, Sciarretta KL, et al. Sepsis among Medicare beneficiaries: 1. The burdens of sepsis, 2012–2018. Crit Care Med. 2020;48:276–288. doi:10.1097/CCM.0000000000004224 - DOI - PMC - PubMed
    1. Seymour CW, Gesten F, Prescott HC, et al. Time to treatment and mortality during mandated emergency care for sepsis. N Engl J Med. 2017;376:2235–2244. doi:10.1056/NEJMoa1703058 - DOI - PMC - PubMed
    1. Levy MM, Gesten FC, Phillips GS, et al. Mortality changes associated with mandated public reporting for sepsis: the results of the New York State initiative. Am J Respir Crit Care Med. 2018;198:1406–1412. doi:10.1164/rccm.201712-2545OC - DOI - PMC - PubMed

Publication types

MeSH terms