. 2021 May 10;6(9):e138484.
doi: 10.1172/jci.insight.138484.

Fidgetin-like 2 negatively regulates axonal growth and can be targeted to promote functional nerve regeneration

Affiliations

Fidgetin-like 2 negatively regulates axonal growth and can be targeted to promote functional nerve regeneration

Lisa Baker et al. JCI Insight. .

Abstract

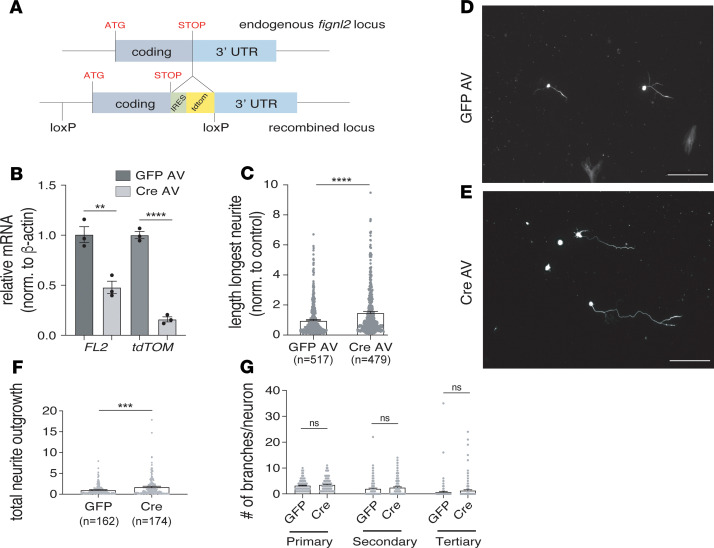
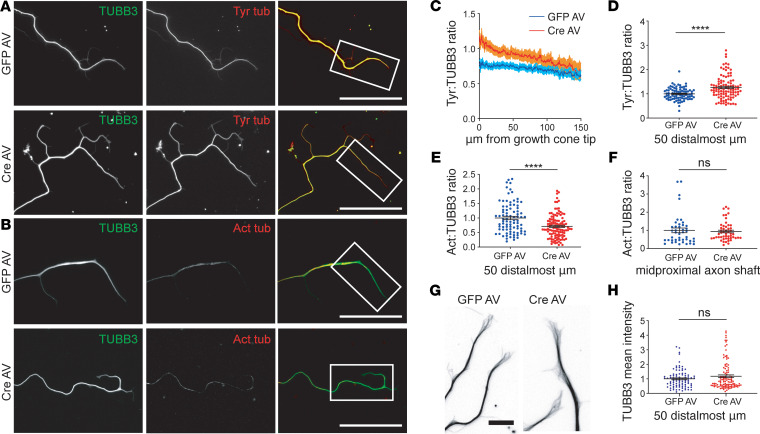
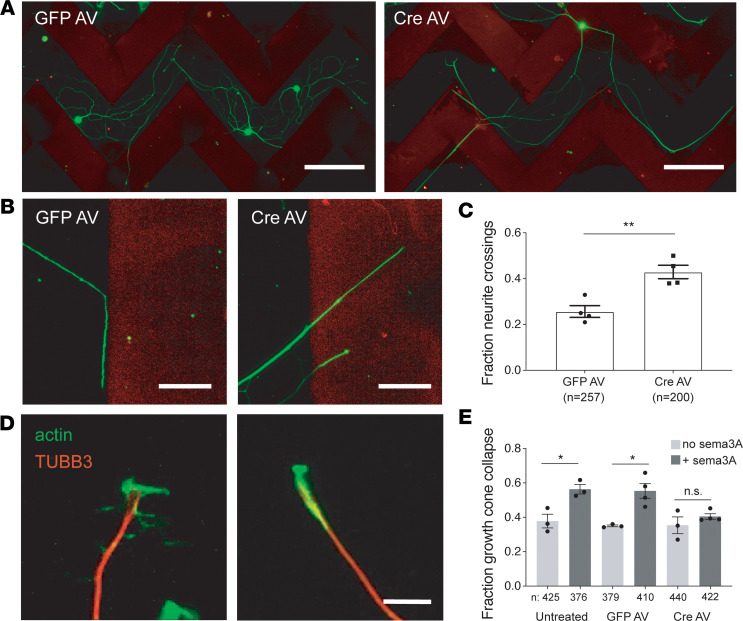
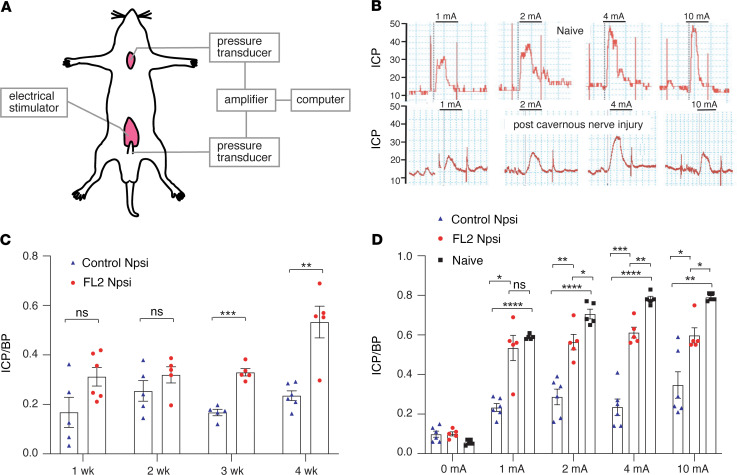
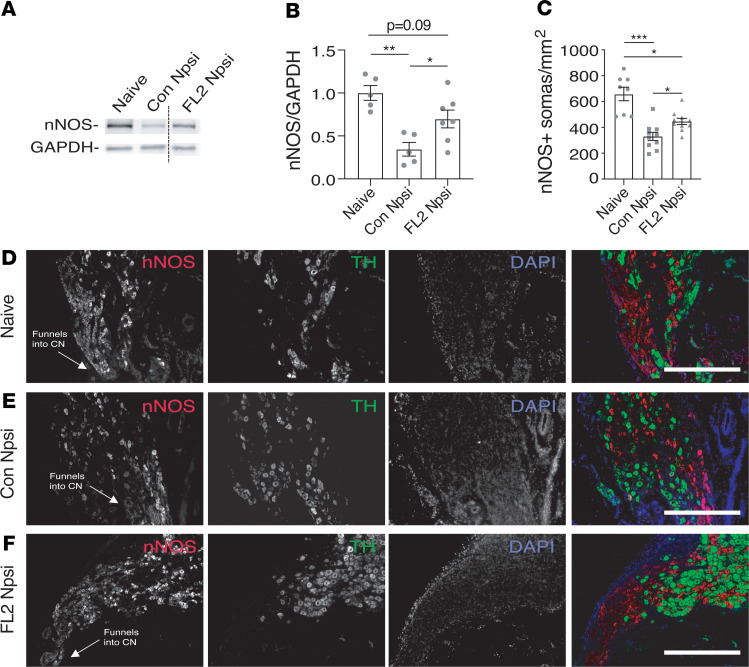
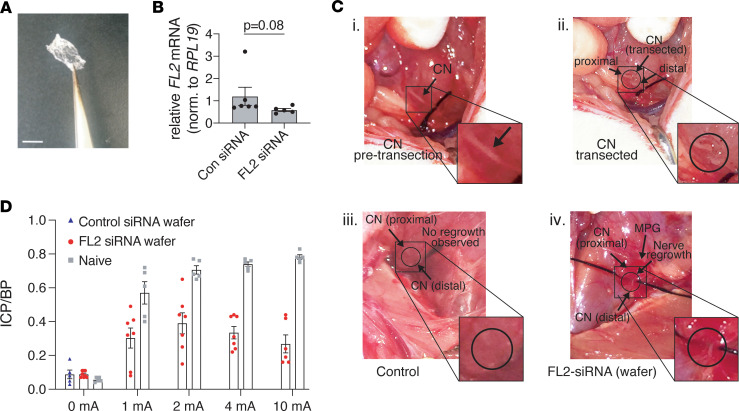
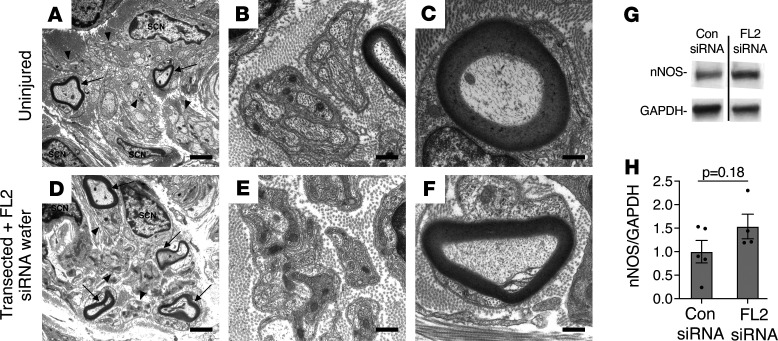
The microtubule (MT) cytoskeleton plays a critical role in axon growth and guidance. Here, we identify the MT-severing enzyme fidgetin-like 2 (FL2) as a negative regulator of axon regeneration and a therapeutic target for promoting nerve regeneration after injury. Genetic knockout of FL2 in cultured adult dorsal root ganglion neurons resulted in longer axons and attenuated growth cone retraction in response to inhibitory molecules. Given the axonal growth-promoting effects of FL2 depletion in vitro, we tested whether FL2 could be targeted to promote regeneration in a rodent model of cavernous nerve (CN) injury. The CNs are parasympathetic nerves that regulate blood flow to the penis, which are commonly damaged during radical prostatectomy (RP), resulting in erectile dysfunction (ED). Application of FL2-siRNA after CN injury significantly enhanced functional nerve recovery. Remarkably, following bilateral nerve transection, visible and functional nerve regeneration was observed in 7 out of 8 animals treated with FL2-siRNA, while no control-treated animals exhibited regeneration. These studies identify FL2 as a promising therapeutic target for enhancing regeneration after peripheral nerve injury and for mitigating neurogenic ED after RP - a condition for which, at present, only poor treatment options exist.

Keywords: Cytoskeleton; Neuroscience; Prostate cancer; Reproductive Biology; Urology.


Conflict of interest statement

Conflict of interest: DJS is the chief scientific officer at MicroCures, Inc., and DJS, KPD, and JF hold stock in MicroCures, Inc. LB and AHK are research scientists at MicroCures, Inc.

Figures

Figure 1
Figure 1. FL2 depletion accelerates the rate of axon regeneration in adult DRG neurons.
(A) Schematic of internal ribosome entry site–tdTomato (IRES-tdTomato) knockin and LoxP sites at Fignl2 endogenous locus. The Fignl2 gene is on chromosome 15 and is intronless, composed of 1 exon extending over 4.2 kB. An IRES and tdtomato (tdTOM) reporter gene were inserted after the stop codon between the coding sequence and 3′ UTR sequence. LoxP sites were inserted upstream of the start codon and after the reporter gene. (B) Fignl2 and tdTOM mRNA levels 1 week after transduction with GFP AV or Cre AV. RNA combined from 4 transduced cultures for each experiment. (C) Average length of longest neurites in control and FL2-knockout neurons 2 days after replating (GFP AV mean ± SEM: 1.00 ± 0.05; Cre AV: 1.51 ± 0.07. GFP AV n = 517, Cre AV n = 479). Experiment performed in quadruplicate. (D and E) Micrographs of GFP AV (D) and Cre AV (E) DRG neurons replated at low density 1 week after viral transduction, fixed 2 days later, and immunostained for tubulin (tubulin isoform β3) (scale bar: 200 μm). (F) Neurite outgrowth (sum length of all neurites per neuron) in GFP AV– and Cre AV–treated neurons 2 days after replating, normalized to the control mean (GFP AV mean ± SEM: 1.00 ± 0.10; Cre AV: 1.74 ± 0.18). GFP n = 162, Cre AV n = 174. (G) Numbers of primary, secondary, and tertiary neurites on GFP AV– and Cre AV–treated neurons (primary: GFP AV: 3.26 ± 016, Cre AV: 3.55 ± 0.18, P = 0.24, secondary: GFP AV: 2.01 ± 0.24, Cre AV: 2.47 ± 0.24, P = 0.17; tertiary: GFP AV: 0.72 ± 0.25; Cre AV: 1.3 ± 0.27, P = 0.12. GFP n = 159, Cre AV n = 173). Experiments performed in triplicate unless otherwise noted. Data were analyzed using unpaired 2-tailed Welch’s t test (morphometric data) or 2-tailed Student’s t test (qPCR data). Bars represent mean ± SEM. **P < 0.01; ***P < 0.001; ****P < 0.0001.
Figure 2
Figure 2. FL2 depletion results in a more dynamic MT array near the growth cone in regenerating neurites.
(A and B) Immuno-micrographs of DRG neurites of GFP AV– and Cre AV–treated neurons 2 days after replating, dual-stained for tubulin isoform β3 (TUBB3) (green) and tyrosinated tubulin (Tyr tub) (red) (A) or for TUBB3 (green) and acetylated tubulin (Act tub) (red). Brightness/contrast adjusted linearly to more clearly see acetylated tubulin stain (B). Scale bars: 50 μm. (C) Tyr/TUBB3 ratios in GFP AV– and Cre AV–treated neurons from 1 representative experiment, starting at the tip of the growth cone and moving toward the soma (dark line is the mean intensity ratio; shaded area represents the SEM). (D) Tyr/TUBB3 fluorescence intensity ratios in the 50 distalmost micrometers of neurites, normalized to the GFP AV mean (GFP AV: 1.00 ± 0.03, Cre AV: 1.26 ± 0.05, n = 86 GFP, n = 101 Cre). (E) Distribution of Act/TUBB3 ratios in the 50 distalmost micrometers of neurites, normalized to the GFP AV mean (GFP AV: 1 ± 0.06, Cre AV: 0.74 ± 0.04. n = 87 GFP; n = 116 Cre). (F) Act/TUBB3 ratios in the proximal to mid region of the axonal shaft (GFP AV: 1.00 ± 0.13; Cre AV: 0.94 ± 0.07, P = 0.68, n = 43 GFP, n = 51 Cre). Experiment performed in duplicate. (G) Inverted images of MTs in the growth cones (GCs) of GFP AV– and CRE AV–treated neurons, immunostained for TUBB3. Brightness/contrast adjusted to better visualize individual MTs. Scale bar: 10 μm. (H) Mean TUBB3 fluorescence intensities in the distalmost 50 μm of neurites (GFP: 1.00 ± 0.06, Cre: 1.18 ± 0.09, Welch’s t test, P = 0.12, n = 91 GFP, n = 101 Cre). Experiments performed in triplicate unless otherwise indicated. Data were analyzed using unpaired 2-tailed Welch’s t test. Bars represent mean ± SEM. ****P < 0.0001.
Figure 3
Figure 3. FL2 depletion attenuates the effects of inhibitory substrates on adult DRG GC advancement during regeneration.
(A) Micrographs of GFP AV– and Cre AV–treated neurons immunostained for TUBB3 (green) 72 hours after plating on aggrecan stripes (red). Scale bar: 200 μm. (B) High-magnification image of a GFP AV–treated neurite turning in response to an aggrecan border and Cre AV–treated neurites crossing through the stripe border. Scale bar: 50 μm. (C) Fraction of neurites of GFP AV– and Cre AV–treated neurons that crossed aggrecan stripe borders (GFP AV mean = 0.26 ± 0.026; Cre AV mean = 0.41 ± 0.06. P = 0.0169, unpaired 2-tailed Welch’s t test, GFP n = 65 neurons, 257 neurite/border encounters; Cre AV n = 79 neurons, 200 neurite/border encounters. Experiment performed 4 times). (D) Immuno-micrographs showing an active, viable GC (left) and a collapsed GC (right), stained for MTs (TUBB3) in red and actin in green. Scale bar: 10 μm. (E) Fraction of collapsed GCs in untreated, GFP AV–treated, and Cre AV–treated neurons, in the presence and absence of Sema3A. GFP and Cre AV experiments performed in quadruplicate, untreated +/– Sema3A performed in triplicate (untreated, no Sema3A: 0.38 ± 0.04, n = 425 GCs; untreated, +Sema3A: 0.56 ± 0.03, n = 376; GFP AV, no Sema3A: 0.35 ± 0.01, n = 379; GFP AV, +Sema3A: 0.55 ± 0.04, n = 410; Cre AV, no Sema3A: 0.35 ± 0.05, n = 440; Cre AV, +Sema3A: 0.40 ± 0.02, n = 422. Mean ± SEM; *P < 0.05, **P < 0.01; unpaired 2-tailed Welch’s t test). Imaging and analyses performed in a blinded manner.
Figure 4
Figure 4. Treatment with nanoparticle-encapsulated FL2-siRNA improves recovery of erectile response following CN injury.
(A) Schematic of cavernosometry setup. Cannulas are inserted into the penile cruz and the carotid artery to measure the ICP and BP, respectively. A bipolar stainless steel electrode, inserted above the site of nerve injury, is used to directly stimulate the CN. (B) Traces of the ICP in response to increasing levels of CN stimulation in an uninjured animal and an animal following cavernous nerve injury. (C) Time course showing the ratio of ICP to mean BP (ICP/BP) of control-npsi– and FL2-npsi– treated nerves with 1 mA electrostimulation of the nerve (5–6 animals per time point and treatment group — note the experiment is terminal and a different cohort was used for each time point). (D) ICP/BP for naive and npsi-treated rats 4 weeks after crush and treatment (Control Npsi n = 6; FL2 Npsi n = 5; naive n = 5). Data are presented as mean ± SEM and were analyzed using unpaired 2-tailed Student’s t test (C) or 1-way ANOVA with Tukey’s test (D). *P < 0.05; **P < 0.01; ***P < 0.001; ****P < 0.0001.
Figure 5
Figure 5. FL2-npsi–treated nerves had increased nNOS in the penis shaft and an increased density of nitrergic neurons in the caudal MPG 4 weeks after CN crush.
(A) Representative lanes from Western blot of penile shaft samples from naive animals and from rats 4 weeks after 4-minute CN crush and treatment with control- or FL2-npsi, probed for nNOS and GAPDH (line divides noncontiguous lanes on the same blot). (B) Relative levels of nNOS in the penile shaft analyzed by Western blot and normalized to GAPDH, 4 weeks after CN crush and treatment with FL2- or control-npsi (naive: 1.0 ± 0.09, n = 5; Con Npsi: 0.35 ± 0.08, n = 5; FL2 Npsi: 0.70 ± 0.10, n = 7). One-way ANOVA with Tukey’s correction. (C) Average density of nNOS+ somas proximal to the CN in naive and control- and FL2-npsi–treated animals 4 weeks after CN crush (naive: 655.2 ± 15.8; Con Npsi: 335.4 ± 34.7; FL2 Npsi: 451.7 ± 30.9). Mean ± SEM; *P < 0.05, **P < 0.01, ***P < 0.001; Brown-Forsythe and Welch’s ANOVA with Dunnett’s T3 correction. Eight to 10 sections from 3–4 MPG analyzed per treatment group. (DF) Images of longitudinal sections of MPG proximal to the CN from a naive animal (D) and from animals 4 weeks after CN crush and treatment with control-npsi (E) or FL2-npsi (F) stained for nNOS to label nitrergic neurons and tyrosine hydroxylase as a counterstain to label sympathetic noradrenergic neurons and DAPI (scale bar: 0.5 mm).
Figure 6
Figure 6. Application of FL2-siRNA after bilateral CN transection leads to visible regeneration and partial recovery of erectile function.
(A) Image of siRNA wafer prior to application. Scale bar: 0.5 cm. (B) Relative levels of FL2 mRNA in the MPG 2 weeks after CN transection and wafer treatment, normalized to ribosomal protein L19 (RPL19) (unpaired 2-tailed Student’s t test, P = 0.08, n = 5). (C) Images of the CN prior to transection (i); immediately after transection (ii); and 2 weeks after transection and con-siRNA or FL2-siRNA wafer treatment (iii and iv, respectively). (D) Mean maximal ICP/BP measurements following different levels of stimulation of transected/siRNA wafer–treated animals and naive age-matched controls (mean ± SEM). Note control-siRNA wafer transected nerves could not be stimulated due to the degree of retraction of the severed nerve segments; therefore only baseline ICP/BP is shown.
Figure 7
Figure 7. Regenerated myelinated and unmyelinated axons are present in the CN distal to the injury site following transection and FL2-siRNA wafer treatment.
(A and D) Transmission electron microscopy (TEM) images, original magnification, ×5000, of a distal segment of a CN from an uninjured animal (A) and 1 from a transected and FL2-siRNA wafer–treated animal (D), 4 weeks after transection and treatment (harvest of control-siRNA wafer–treated distal nerve segments was not possible due to retraction of the distal nerve segment). Arrows point out myelinated large-diameter axons. Arrowheads point to some of the Remak bundles of unmyelinated small-diameter axons. Scale bar: 2 μm. SCN, Schwann cell nucleus. (B and E) TEM images, original magnification, ×20,000, of an uninjured (B) and transected and FL2-siRNA wafer–treated nerve (E) showing Remak bundles at higher magnification. Scale bar: 0.5 μm. (C and F) ×20,000 TEM images of uninjured CN (C) and a transected and FL2 siRNA wafer–treated nerve distal to injury site (F), showing myelinated axons. Scale bar: 0.5 μm. (G) Representative lanes from Western blot of corporal tissue lysates from control and FL2-siRNA wafer–treated animals, 1 month following bilateral transection of the CN, probed for nNOS and GAPDH (lanes rune on same gel but noncontiguous). (H) Relative levels of nNOS in the penile shaft analyzed by Western blot and normalized to GAPDH, 4 weeks after bilateral CN transection and treatment with FL2- or control-siRNA wafers. Only FL2-siRNA wafer–treated animals that exhibited regeneration in both CNs included in analysis. Control mean ± SEM = 1.00 ± 0.24, FL2 si = 1.5 ± 0.26, P = 0.18, unpaired 2-tailed Welch’s t test, control n = 5, FL2 si n = 4.

References

    1. Kapitein LC, Hoogenraad CC. Building the neuronal microtubule cytoskeleton. Neuron. 2015;87(3):492–506. doi: 10.1016/j.neuron.2015.05.046. - DOI - PubMed
    1. Lowery LA, Van Vactor D. The trip of the tip: understanding the growth cone machinery. Nat Rev Mol Cell Biol. 2009;10(5):332–343. doi: 10.1038/nrm2679. - DOI - PMC - PubMed
    1. Blanquie O, Bradke F. Cytoskeleton dynamics in axon regeneration. Curr Opin Neurobiol. 2018;51:60–69. doi: 10.1016/j.conb.2018.02.024. - DOI - PubMed
    1. Baas PW, Matamoros AJ. Inhibition of kinesin-5 improves regeneration of injured axons by a novel microtubule-based mechanism. Neural Regen Res. 2015;10(6):845–849. doi: 10.4103/1673-5374.158351. - DOI - PMC - PubMed
    1. Ruschel J, Bradke F. Systemic administration of epothilone D improves functional recovery of walking after rat spinal cord contusion injury. Exp Neurol. 2018;306:243–249. doi: 10.1016/j.expneurol.2017.12.001. - DOI - PubMed

Publication types

MeSH terms

Substances