. 2021 Apr 19;17(4):e1008887.
doi: 10.1371/journal.pcbi.1008887. eCollection 2021 Apr.

MAUI (MBI Analysis User Interface)-An image processing pipeline for Multiplexed Mass Based Imaging

Affiliations

MAUI (MBI Analysis User Interface)-An image processing pipeline for Multiplexed Mass Based Imaging

Alex Baranski et al. PLoS Comput Biol. .

Abstract

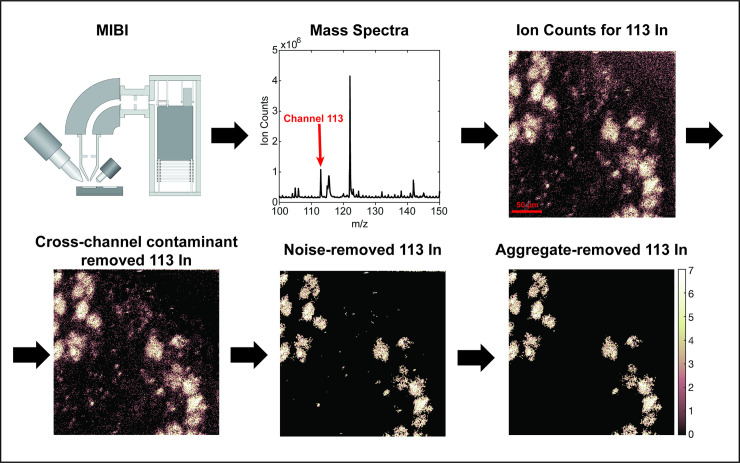
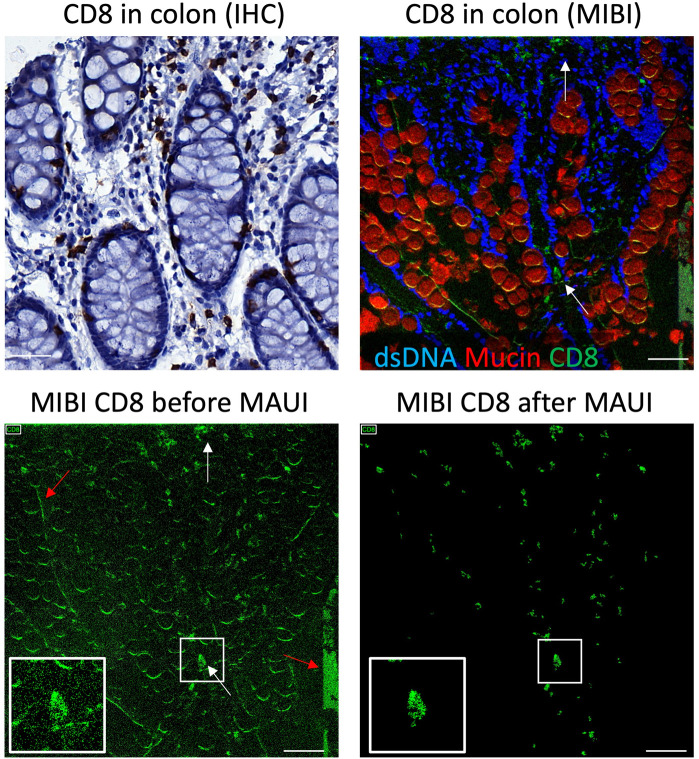
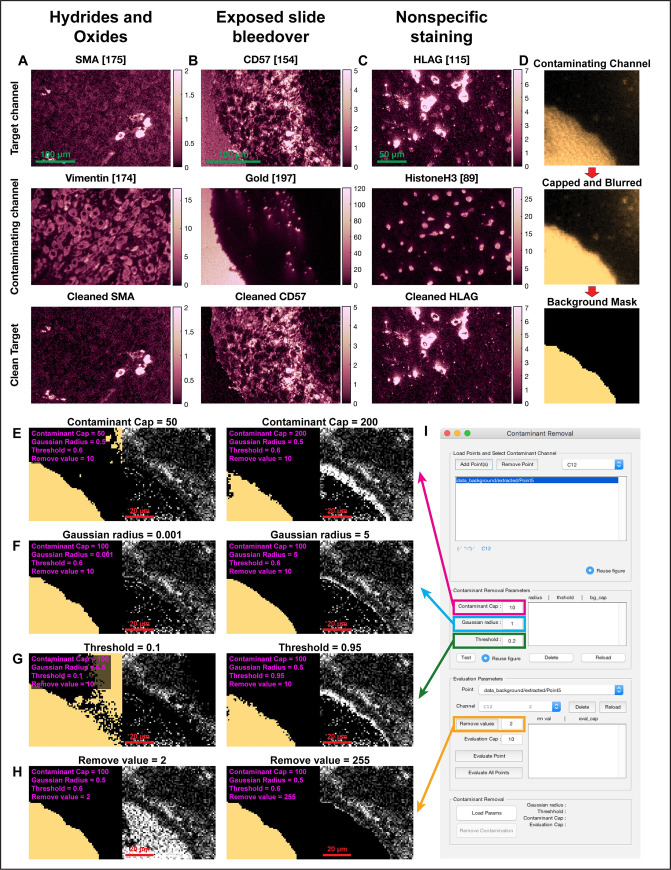
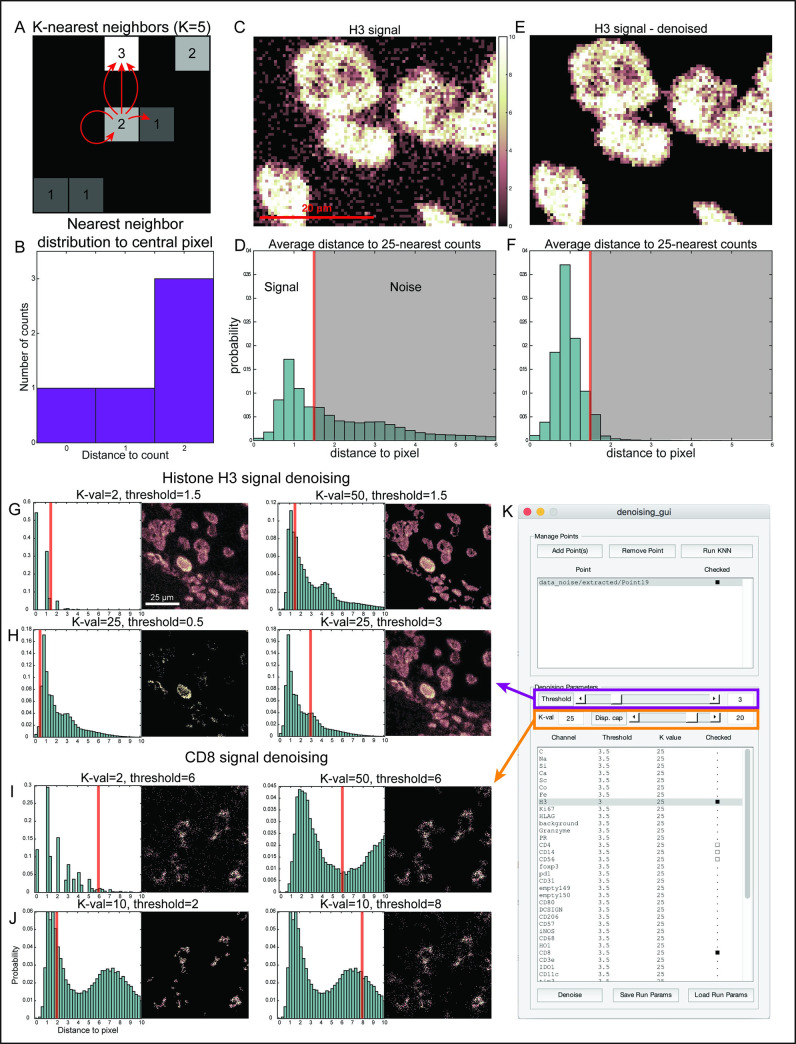
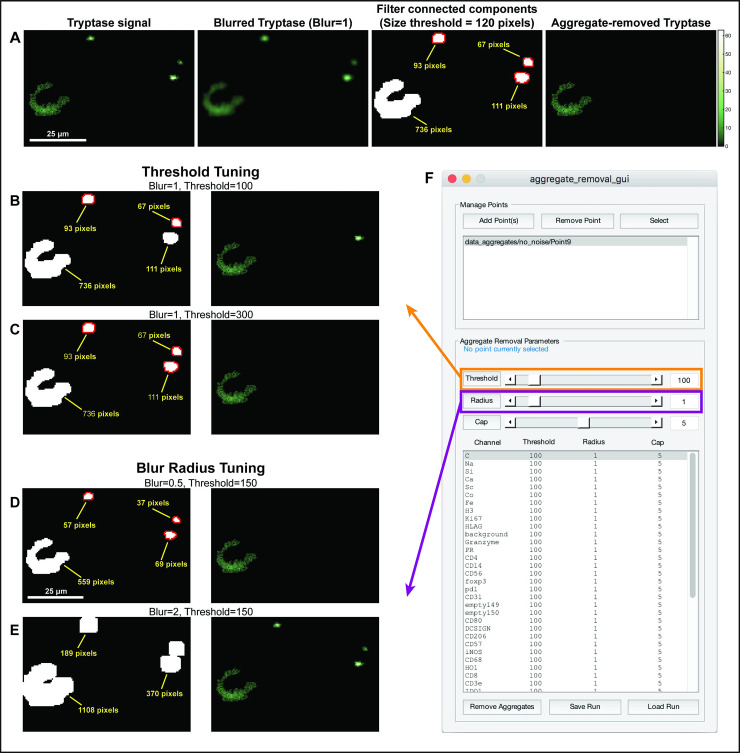
Mass Based Imaging (MBI) technologies such as Multiplexed Ion Beam Imaging by time of flight (MIBI-TOF) and Imaging Mass Cytometry (IMC) allow for the simultaneous measurement of the expression levels of 40 or more proteins in biological tissue, providing insight into cellular phenotypes and organization in situ. Imaging artifacts, resulting from the sample, assay or instrumentation complicate downstream analyses and require correction by domain experts. Here, we present MBI Analysis User Interface (MAUI), a series of graphical user interfaces that facilitate this data pre-processing, including the removal of channel crosstalk, noise and antibody aggregates. Our software streamlines these steps and accelerates processing by enabling real-time and interactive parameter tuning across multiple images.


Conflict of interest statement

I have read the journal’s policy and the authors of this manuscript have the following competing interests: MA is a consultant and shareholder in IonPath.

Figures

Fig 1
Fig 1. Workflow of Multiplexed Ion Beam Imaging User Analysis Interface (MAUI).
Tissue specimens are stained using a mixture of antibodies labeled with elemental mass tags. The samples are rasterized by a primary ion beam that releases the metals of the bound antibodies as secondary ions, which are recorded by a Time of Flight Mass Spec. This results in an n-dimensional image depicting protein expression in the field. Image processing includes removal of cross-channel contamination, noise and aggregates.
Fig 2
Fig 2. Processing MIBI data using MAUI results in signal similar to Immunohistochemistry.
Shown are serial sections from human colon stained for CD8 by IHC (top left) or MIBI (top right). White arrows indicate cytotoxic T cells in the lamina propria of the gut. Red arrows indicate imaging artifacts including background and cross-channel contamination (bottom left). After processing by MAUI (bottom right) the CD8 signal mirrors the expected histological staining pattern by IHC. Scalebar equals 40μm.
Fig 3
Fig 3. Removal of cross-channel contamination.
(A-C) Shown are examples for different sources of cross-channel contamination. In all cases a target channel (top row) is contaminated by another channel (middle row) or is correlated with such contamination. MAUI allows to remove this contamination from the target image (bottom row). (D) The first step for removal of cross-channel contamination is to cap, blur and threshold the contaminating channel to generate a binary mask of the contamination. The second is to remove signal where the mask is positive. (E-H) Examples of the resulting image when varying the algorithm parameters, including the Contaminant Cap (E), Gaussian Radius (F), Threshold (G), and the Remove Value (H). (I) The GUI enables to rapidly evaluate these parameters across many points and channels.
Fig 4
Fig 4. Removal of noise using a K-Nearest-Neighbor (KNN) algorithm.
(A-B) Signal density at each pixel is determined using its K nearest neighbor counts. Shown is an example of the 5 nearest counts (A) and their distances (B) to the central pixel. (C) An example of staining of Histone H3 with noise surrounding the nuclear signal. (D) Shown is the frequency of the average distance to the 25 nearest counts for all pixels in (C). Signal is characterized by short distances (high density), whereas noise is characterized by long distances (low density). The red line is the chosen threshold for denoising, and pixels with large distances to their neighbors will be set to zero. (E) Histone H3 signal after denoising. (F) The average KNN-distribution for Histone H3, same as in (D), after denoising. (G-H) Examples of the resulting image of Histone H3 when varying the algorithm parameters, including the K-value (G) and Threshold (H). (I-J) Examples of the resulting image of a membranous protein, CD8, when varying the algorithm parameters, including the K-value (I) and Threshold (J). (K) The GUI enables to rapidly evaluate these parameters across many points and channels.
Fig 5
Fig 5. Removal of aggregates.
(A) An overview of the aggregate-removal process. Left: An image of denoised Tryptase signal. Aggregates are evident in the top right corner. The image is blurred with a Gaussian filter and then binarized. Objects are extracted from the binary image, and any object small enough is considered an aggregate and removed. (B-C) Examples of the resulting image of Tryptase when varying the algorithm parameters, including the Threshold (B,C) and Blur radius (D-E). (F) The GUI enables to rapidly evaluate these parameters across many points and channels.

References

    1. Moffitt J.R., Bambah-Mukku D., Eichhorn S.W., Vaughn E., Shekhar K., Perez J.D., et al.. Molecular, spatial, and functional single-cell profiling of the hypothalamic preoptic region. Science 2018; 362, eaau5324. 10.1126/science.aau5324 - DOI - PMC - PubMed
    1. Zhu Q., Shah S., Dries R., Cai L., and Yuan G.-C. Identification of spatially associated subpopulations by combining scRNAseq and sequential fluorescence in situ hybridization data. Nat. Biotechnol. 2018; 36, 1183. 10.1038/nbt.4260 - DOI - PMC - PubMed
    1. Ke R., Mignardi M., Pacureanu A., Svedlund J., Botling J., Wählby C., et al.. In situ sequencing for RNA analysis in preserved tissue and cells. Nat. Methods 2013; 10, 857–860. 10.1038/nmeth.2563 - DOI - PubMed
    1. Ståhl P.L., Salmén F., Vickovic S., Lundmark A., Navarro J.F., Magnusson J., S. et al.. Visualization and analysis of gene expression in tissue sections by spatial transcriptomics. Science 2016; 353, 78–82, 10.1126/science.aaf2403 - DOI - PubMed
    1. Wang X., Allen W.E., Wright M.A., Sylwestrak E.L., Samusik N., Vesuna S., et al.. Three-dimensional intact-tissue sequencing of single-cell transcriptional states. Science 2018; 361, eaat5691. 10.1126/science.aat5691 - DOI - PMC - PubMed

Publication types