. 2021 Apr 19;19(4):e3001194.
doi: 10.1371/journal.pbio.3001194. eCollection 2021 Apr.

Bacterial persisters are a stochastically formed subpopulation of low-energy cells

Affiliations

Bacterial persisters are a stochastically formed subpopulation of low-energy cells

Sylvie Manuse et al. PLoS Biol. .

Abstract

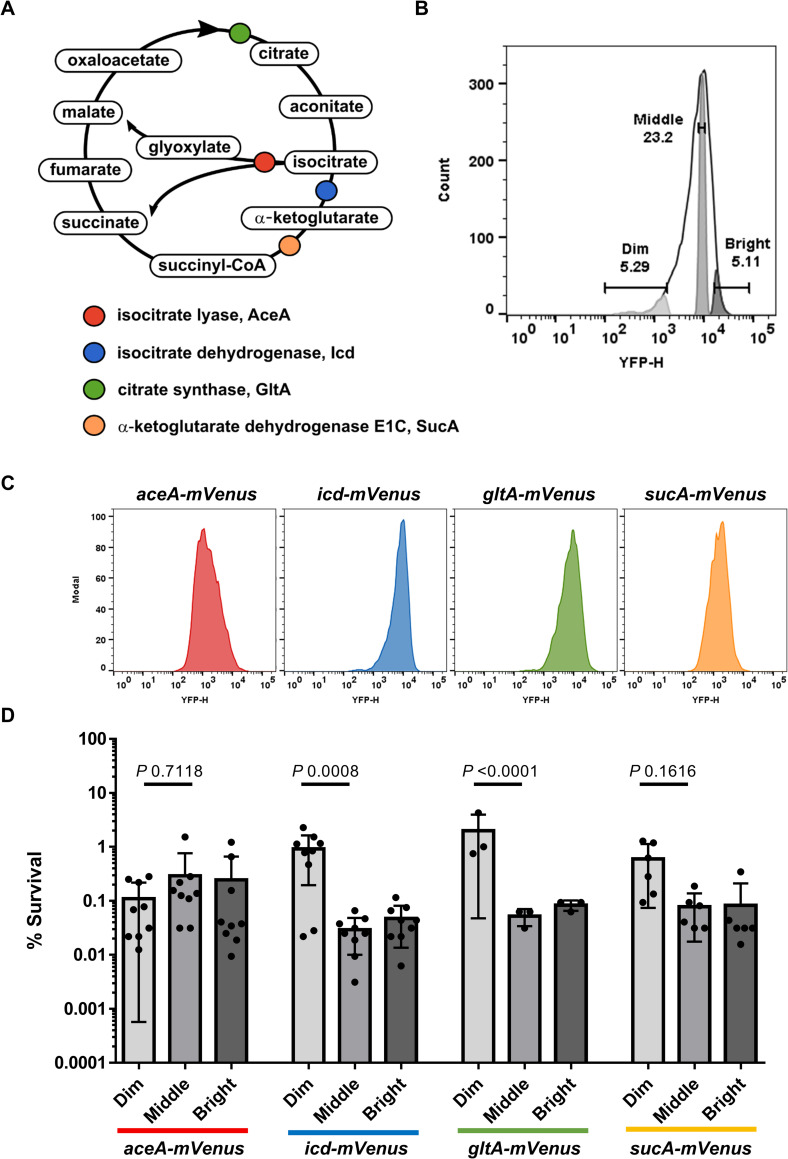
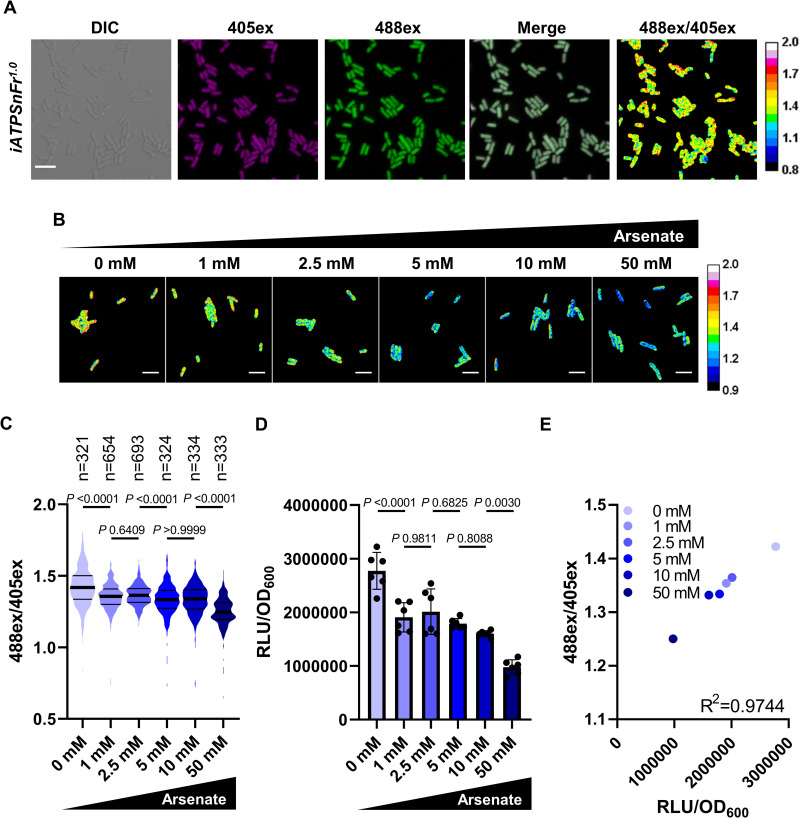
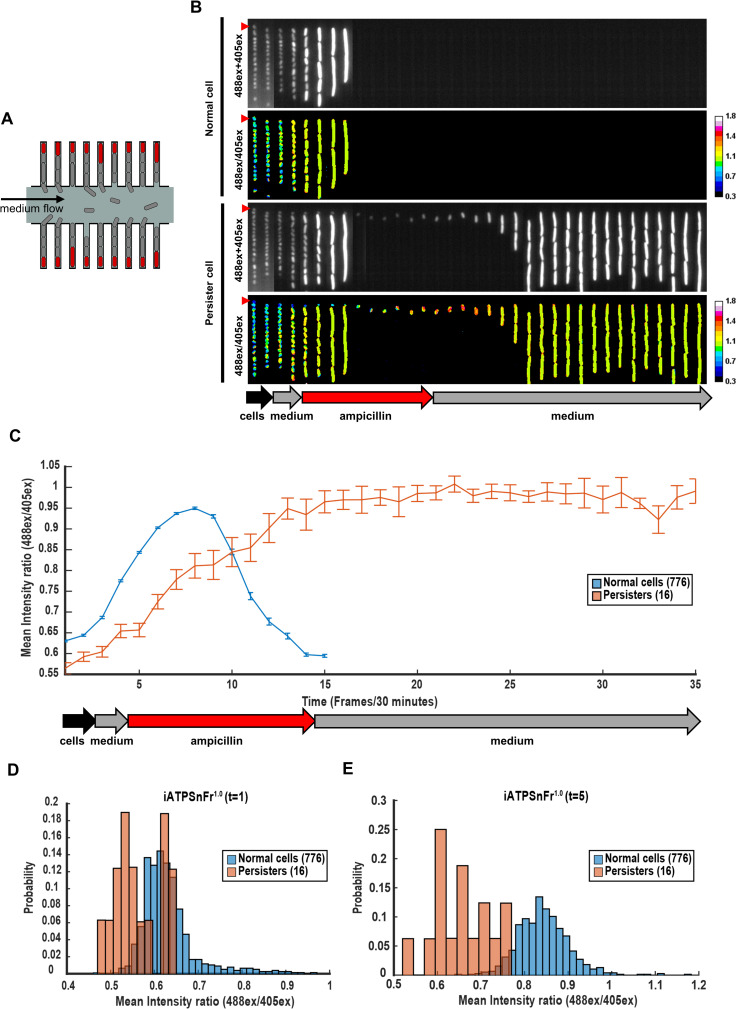
Persisters represent a small subpopulation of non- or slow-growing bacterial cells that are tolerant to killing by antibiotics. Despite their prominent role in the recalcitrance of chronic infections to antibiotic therapy, the mechanism of their formation has remained elusive. We show that sorted cells of Escherichia coli with low levels of energy-generating enzymes are better able to survive antibiotic killing. Using microfluidics time-lapse microscopy and a fluorescent reporter for in vivo ATP measurements, we find that a subpopulation of cells with a low level of ATP survives killing by ampicillin. We propose that these low ATP cells are formed stochastically as a result of fluctuations in the abundance of energy-generating components. These findings point to a general "low energy" mechanism of persister formation.


Conflict of interest statement

The authors have declared that no competing interests exist.

Figures

Fig 1
Fig 1. E. coli populations with low abundance of energy-producing enzymes are enriched in persisters.
(A) Schematic of the Krebs cycle reactions. Tested enzymes have been color coded. (B) Representative peak of fluorescence of the different energy-producing enzyme reporters tested in this study. For each reporter, Dim (approximately 5%), Middle (approximately 20%), and Bright (approximately 5%) population gates were created based on mVenus signal recorded from a YFP detector. (C) Representative fluorescent peaks of each reporter before cell sorting. The number of events represented in the y axis is normalized for each graph. (D) Exponentially growing cells of E. coli W3110D carrying a translational mVenus fusion of aceA, icd, gltA, sucA (grown in LB at 37°C) were exposed to 1 μg/mL of ciprofloxacin for 4 hours. The antibiotic treated cells were then analyzed by FACS as shown in (C). Dim, Middle, and Bright fractions were isolated by cell sorting as shown in (B) onto LB agar. The percentage survivals of the Dim, Middle, and Bright fractions correspond to the comparison between the CFU counts and the total numbers of sorted cells. Data are the average results from at least 3 biological replicates (n = 9, 9, 3, 6, for aceA-mVenus, icd-mVenus, gltA-mVenus, sucA-mVenus, respectively). Error bars represent standard deviations. Significance was determined using two-way ANOVA and Tukey’s multiple comparison tests. The underlying data for this figure can be found in S1 Data. CFU, colony forming unit; FACS, fluorescence-activated cell sorting; YFP, yellow fluorescent protein.
Fig 2
Fig 2. Expression and calibration of the ATP reporter iATPSnFr1.0 in E. coli.
(A) Representative images of an exponential culture of MG1655_iATPSnFr1.0 cultured in LB at 37°C. The fluorescent signals from 405ex and 488ex are false colored in magenta and green, respectively. In the ratiometric 488ex/405ex panel, orange/yellow cells correspond to cells with higher ATP, and blue cells with lower ATP. Scale bar, 5 μm. Observations were performed with a confocal microscope. (B) Representative ratiometric 488ex/405ex images of MG1655-SB1_iATPSnFr1.0 exponential cultures treated 30 minutes with different concentrations of arsenate. Scale bar, 5 μm. (C) Distribution of the iATPSnFr1.0 488ex/405ex ratio per single cell in exponential cultures treated with arsenate. Thick lanes represent the median, and secondary lanes the quartiles. Significance was determined using Kruskal–Wallis and Dunn’s multiple comparison tests. Data are representative of experiments made twice giving similar results. (D) Bulk ATP levels were measured in MG1655-SB1_iATPSnFr1.0 grown and treated with arsenate as in (B) and (C) with firefly luciferase assay and normalized with OD600. Data are the average results from 2 independent experiments performed with 3 biological replicates (n = 6). Error bars represent standard deviations. Significance was determined using one-way ANOVA and Tukey’s multiple comparison tests. (E) Calibration curve showing the correlation between single-cell and bulk measurements of ATP done in (C) and (D). Each data point represents the average of both single-cell and bulk measurements. Correlation was examined by Pearson’s correlation. The underlying data for this figure can be found in S1 Data.
Fig 3
Fig 3. Persisters have lower ATP level than the rest of the population.
(A) Schematic of the mother machine device. Only mother cells (in red) at the end of each cell channel were tracked. (B) Kymographs of 2 single channels with MG1655-SB1_iATPSnFr1.0 cells over time. Stationary phase cells were concentrated and loaded in the device. The culture used to load the device was first flowed in the device for 1 hour (black arrow), followed by fresh EZRDM for 1 hour (grey arrow), by EZRDM + ampicillin (50 μg/mL) for 5 hours (red arrow), and finally by fresh EZRDM again (grey arrow). Frames were taken 30 minutes apart. The two upper panels represent the outcome of a mother cell that dies following ampicillin treatment. The two lower panels represent the outcome of a persister cell that survives ampicillin treatment. The 488ex+405ex panels represent the addition of iATPSnFr1.0 405ex and 488ex intensities. The iATPSnFr1.0 ratiometric 488ex/405ex panels represent ATP level. The mother cells analyzed are indicated with a red triangle. Observations were performed with a time-lapse epifluorescence microscope. (C) Data represented are the mean of the iATPSnFr1.0 488ex/405ex ratio per single cell over time frames (frames interval is 30 minutes). Error bars represent standard errors. (D) Distribution of the iATPSnFr1.0 488ex/405ex ratio per single cell for normal and persister cells at the first time frame of the time lapse (t = 1), and (E) immediately before the antibiotic is added (t = 5). The underlying data for this figure can be found in S1 Data.

References

    1. Maisonneuve E, Gerdes K. Molecular mechanisms underlying bacterial persisters. Cell. 2014;157(3):539–48. 10.1016/j.cell.2014.02.050 - DOI - PubMed
    1. Conlon BP, Rowe SE, Gandt AB, Nuxoll AS, Donegan NP, Zalis EA, et al. Persister formation in Staphylococcus aureus is associated with ATP depletion. Nat Microbiol. 2016:1. https://www.nature.com/articles/nmicrobiol201651 - PMC - PubMed
    1. Shan Y, Brown Gandt A, Rowe SE, Deisinger JP, Conlon BP, Lewis K. ATP-dependent persister formation in Escherichia coli. MBio. 2017;8(1). 10.1128/mBio.02267-16 - DOI - PMC - PubMed
    1. Harms A, Fino C, Sorensen MA, Semsey S, Gerdes K. Prophages and growth dynamics confound experimental results with antibiotic-tolerant persister cells. MBio. 2017;8(6). 10.1128/mBio.01964-17 - DOI - PMC - PubMed
    1. Goormaghtigh F, Fraikin N, Putrins M, Hallaert T, Hauryliuk V, Garcia-Pino A, et al. Reassessing the role of type II toxin-antitoxin systems in formation of Escherichia coli type II persister ells. MBio. 2018;9(3). https://mbio.asm.org/content/9/3/e00640-18.long - PMC - PubMed

Publication types

MeSH terms

Substances

LinkOut - more resources