. 2021 May 7;49(8):4550-4563.
doi: 10.1093/nar/gkab236.

The HIV-1 nucleocapsid chaperone protein forms locally compacted globules on long double-stranded DNA

Affiliations

The HIV-1 nucleocapsid chaperone protein forms locally compacted globules on long double-stranded DNA

Kai Jiang et al. Nucleic Acids Res. .

Abstract

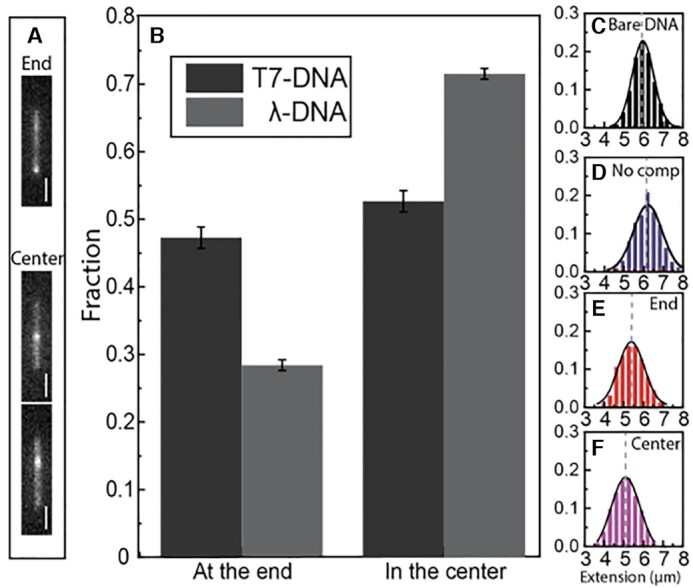
The nucleocapsid (NC) protein plays key roles in Human Immunodeficiency Virus 1 (HIV-1) replication, notably by condensing and protecting the viral RNA genome and by chaperoning its reverse transcription into double-stranded DNA (dsDNA). Recent findings suggest that integration of viral dsDNA into the host genome, and hence productive infection, is linked to a small subpopulation of viral complexes where reverse transcription was completed within the intact capsid. Therefore, the synthesized dsDNA has to be tightly compacted, most likely by NC, to prevent breaking of the capsid in these complexes. To investigate NC's ability to compact viral dsDNA, we here characterize the compaction of single dsDNA molecules under unsaturated NC binding conditions using nanofluidic channels. Compaction is shown to result from accumulation of NC at one or few compaction sites, which leads to small dsDNA condensates. NC preferentially initiates compaction at flexible regions along the dsDNA, such as AT-rich regions and DNA ends. Upon further NC binding, these condensates develop into a globular state containing the whole dsDNA molecule. These findings support NC's role in viral dsDNA compaction within the mature HIV-1 capsid and suggest a possible scenario for the gradual dsDNA decondensation upon capsid uncoating and NC loss.


Figures

Figure 1.
Figure 1.
(A) Amino acid sequence of NC, including its two CCHC-zinc fingers. (B and C) Schematic illustrations of the two nanofluidic chip designs used in this study. (B) Static channel system. This channel system consists of pairs of microchannels, spanned by an array of straight nanochannels, 500 μm long, 100 nm deep and 150 nm wide. The cartoon (left) shows DNA confined inside a nanochannel. DNA will be partially stretched along the nanochannel, with an extension R||, shorter than its contour length L. The fluorescence image (right) shows a YOYO-1 stained DNA molecule confined in a nanochannel. The scale bar is 1 μm. (C) Dynamic channel system. The channel system consists of two pairs of microchannels. The pair for DNA in and out is spanned by an array of nanochannels at the center with a depth of 100 nm, a width of 100 nm and a length of 500 μm, with reaction chambers in the central region (100 μm in length, 300 nm in width and 130 nm in depth). The pair of microchannels for protein in and out is connected by a nanoslit (width = 60 μm, depth = 30 nm) that runs across the reaction chamber orthogonally. The inset shows a zoom of the reaction chamber region.
Figure 2.
Figure 2.
(A–C) Representative intensity profiles of λ-DNA with 1 (A), 2 (B) and 3 (C) local condensates. Insets show fluorescence snapshot images of YOYO-1 stained λ-DNA with corresponding local condensates. The scale bars are 2 μm. (D, E) Number of local condensates along blunt ended T7-DNA (D), and λ-DNA with 12 bp overhangs (E), in the presence of 0.1 μM (black) or 0.3 μM (gray) NC, with 5 μM DNA (in bp). As these concentrations are above Kd, these conditions correspond to 1 NC molecule bound per 50 or 17 bp, respectively, as indicated in panels A and B. Values are expressed as mean formula imageSD.
Figure 3.
Figure 3.
(A) Fluorescence images of YOYO-1 stained λ-DNA with local condensate at the end (top) or in the center (bottom). The scale bars are 2 μm. (B) Distribution of DNAs with local condensate at the ends or in the center at an NC concentration of 0.1 μM with 5 μM DNA (1:50 NC:bp ratio). Values are expressed as meanformula imageSD. (C) Distribution in the extension of bare λ-DNA without NC protein. Distribution in the extension of λ-DNA without visible local condensate (D) and with visible local condensate at the end (E) or in the center (F), at the same NC concentration as in A and B.
Figure 4.
Figure 4.
Real-time visualization of DNA compaction by NC. (A) Kymograph of YOYO-1 stained λ-DNA when 10 μM NC is added in the dynamic nanochannel device. The DNA molecule is compacted and finally condensed by NC, starting in the center of the molecule (white arrow). (B) 3D surface plot of 6 seconds at the start of the formation of the local condensate, corresponding to the dashed square in (A). The color code corresponds to the emission intensity. (C) Normalized intensity profiles of DNA at the corresponding times in the kymograph in A. (D) As in A, but for a DNA molecule where the local condensate is formed at the end. (E) As in A, but for a DNA molecule where the local condensate resolves and subsequently reforms during the compaction process. The horizontal scale bars are 2 μm.
Figure 5.
Figure 5.
(A) Distribution of λ-DNA molecules with or without clustered NC bound at an NC:bp ratio of 1:50. (B) Distribution of λ-DNAs with clustered NC bound at the ends or in the center, but no visible local condensate. (CE) Distribution in the extension of λ-DNA without NC binding (C) and with NC clusters at the end (D) or in the center (E), but no local condensate. (F) Fluorescence images of YOYO-1 stained DNA with Cy3-labeled NC bound, but no local condensate. The same molecule is shown in each image pair. Left image: fluorescence image of YOYO-1 stained λ-DNA (grey), right image: YOYO-1 stained λ-DNA (blue) with Cy3-labeled NC (white). (G) Fluorescence images of YOYO-1 stained DNA with Cy3-labeled NC with NC bound and a local condensate at the same position. (H) Fluorescence images of YOYO-1 stained DNA with Cy3-labeled NC bound at both a local condensate and elsewhere. The scale bars are 1 μm. (I) Ratio of the total intensity of the NC emission from the sites of NC accumulation with no visible local DNA compaction and the sites of NC accumulation with local DNA compaction for the 11 molecules in total containing both types of NC binding. The box is determined by the 25th and 75th percentiles and the whiskers are determined by the 5th and 95th percentiles. The line in the box is the median value and the square symbol in the box is the mean value.
Figure 6.
Figure 6.
(A) Boxplot of the position of the bound NC along λ-DNA at an NC concentration of 0.1 μM with 5 μM DNA (in bp), (1:50 NC:bp ratio). The position is defined as the closest distance to one of the DNA ends. (B) Theoretical barcode of optical mapping of λ-DNA, in which AT-rich regions have low emission intensity and GC-rich high emission. (C) Pairs of images of the same molecule with and without the Cy3-NC signal. Left: fluorescence image of netropsin/YOYO-1 stained λ-DNA (grey), right: netropsin/YOYO-1 stained λ-DNA (blue) with Cy3-labelled NC (white). The scale bars are 1 μm.
Figure 7.
Figure 7.
(A-B) Kymographs of YOYO-1 stained λ-DNA in the dynamic nanofluidic device with 10 μM NC added in the reaction chamber, showing how the 12 nt overhangs anneal in presence of the protein. (C) Fluorescence images of YOYO-1 stained λ-DNA concatemers with and without the Cy3 signal, the same molecule is shown in each image pair at 1 NC to 50 bp. Left: fluorescence image of YOYO-1 stained λ-DNA (grey), right: YOYO-1 stained λ-DNA (blue) with Cy3-labelled NC (white). The dashed boxes mark out the junctions of the annealed λ-DNA concatemers. The scale bars are 2 μm.

Similar articles

Cited by

References

    1. Darlix J.-L., Lapadat-Tapolsky M., de Rocquigny H., Roques B.P.. First glimpses at structure-function relationships of the nucleocapsid protein of retroviruses. J. Mol. Biol. 1995; 254:523–537. - PubMed
    1. Campbell S., Rein A.. In vitro assembly properties of human immunodeficiency virus type 1 Gag protein lacking the p6 domain. J. Virol. 1999; 73:2270–2279. - PMC - PubMed
    1. Ganser B.K. Assembly and analysis of conical models for the HIV-1 core. Science. 1999; 283:80–83. - PubMed
    1. Ganser-Pornillos B.K., Yeager M., Sundquist W.I.. The structural biology of HIV assembly. Curr. Opin. Struct. Biol. 2008; 18:203–217. - PMC - PubMed
    1. Adamson C.S., Freed E.O.. Human immunodeficiency virus type 1 assembly, release, and maturation. Adv. Pharmacol. 2007; 55:347–387. - PubMed

Publication types

LinkOut - more resources