. 2021 Jul 2;49(W1):W397-W408.
doi: 10.1093/nar/gkab268.

miRMaster 2.0: multi-species non-coding RNA sequencing analyses at scale

Affiliations

miRMaster 2.0: multi-species non-coding RNA sequencing analyses at scale

Tobias Fehlmann et al. Nucleic Acids Res. .

Abstract

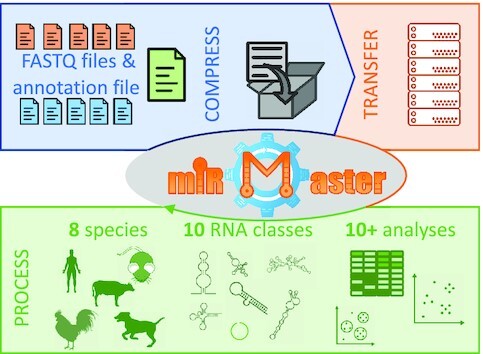
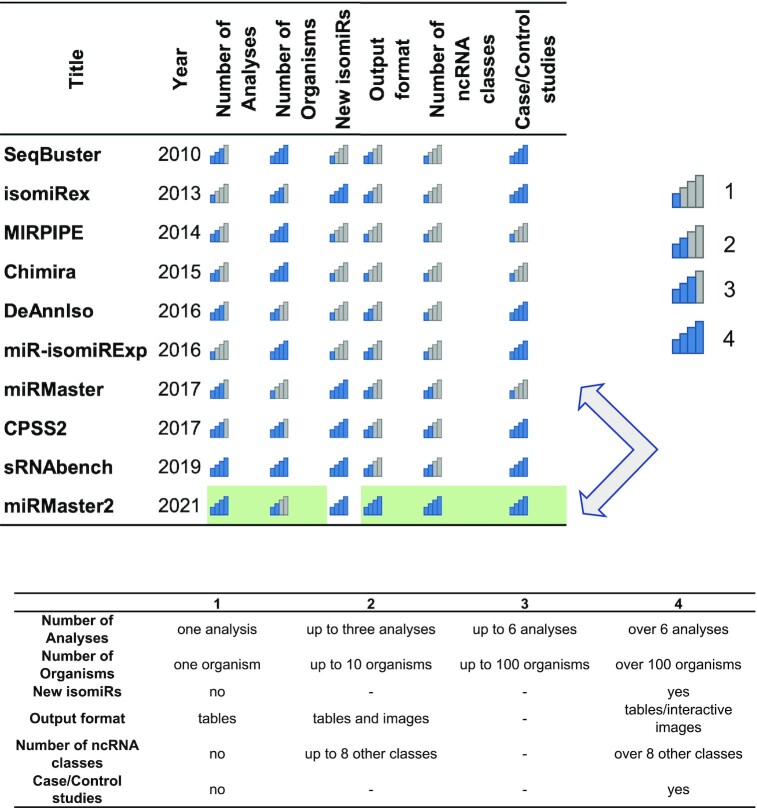
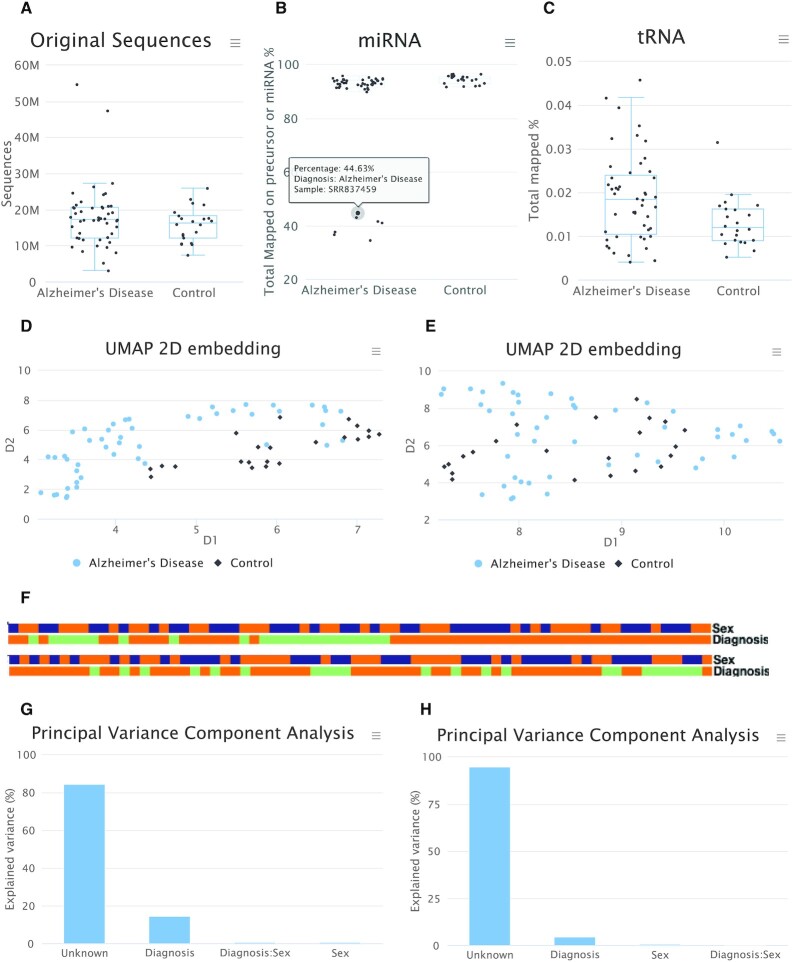
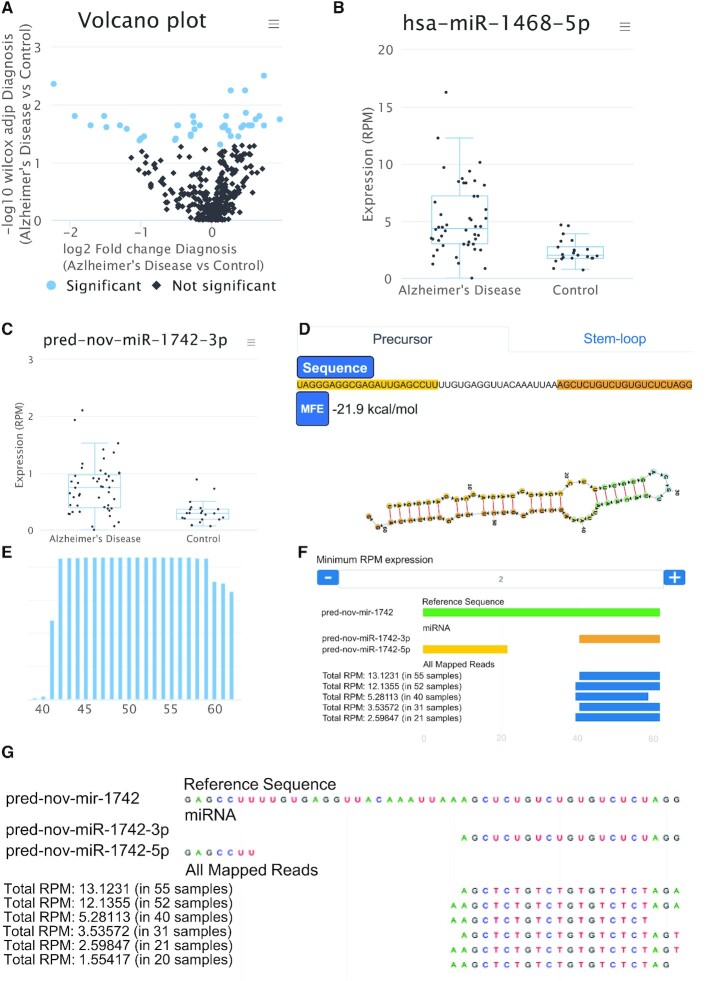
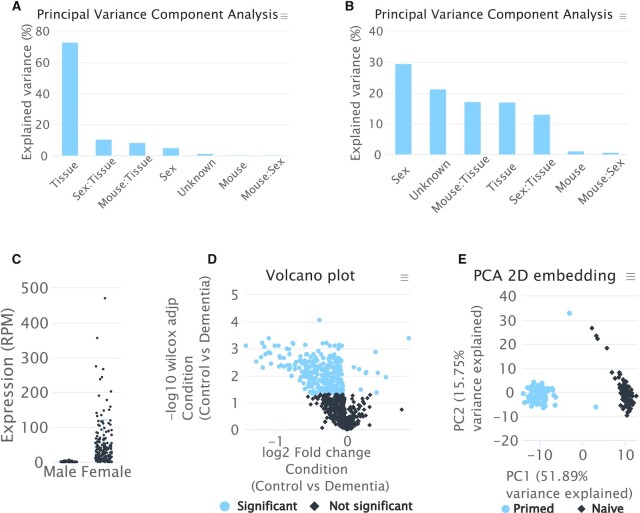
Analyzing all features of small non-coding RNA sequencing data can be demanding and challenging. To facilitate this process, we developed miRMaster. After the analysis of over 125 000 human samples and 1.5 trillion human small RNA reads over 4 years, we present miRMaster 2 with a wide range of updates and new features. We extended our reference data sets so that miRMaster 2 now supports the analysis of eight species (e.g. human, mouse, chicken, dog, cow) and 10 non-coding RNA classes (e.g. microRNAs, piRNAs, tRNAs, rRNAs, circRNAs). We also incorporated new downstream analysis modules such as batch effect analysis or sample embeddings using UMAP, and updated annotation data bases included by default (miRBase, Ensembl, GtRNAdb). To accommodate the increasing popularity of single cell small-RNA sequencing data, we incorporated a module for unique molecular identifier (UMI) processing. Further, the output tables and graphics have been improved based on user feedback and new output formats that emerged in the community are now supported (e.g. miRGFF3). Finally, we integrated differential expression analysis with the miRNA enrichment analysis tool miEAA. miRMaster is freely available at https://www.ccb.uni-saarland.de/mirmaster2.


Figures

Graphical Abstract
Graphical Abstract
miRMaster 2 workflow. The workflow is split into three steps: data selection and compression, data upload and server-side processing.
Figure 1.
Figure 1.
Tool comparison. Comparison of features provided by tools analyzing sncRNA-seq data. Improvements of miRMaster 2 in comparison to its original release are marked in green.
Figure 2.
Figure 2.
Selected result for the data pre-processing. The presented data are taken from the online demo data set on Alzheimer's Disease (AD). (A) Number of reads in the data set. Each dot represents a single sample. No difference between AD and controls exists. (B) Mapping to microRNAs. One point is highlighted. This feature can be used to identify outliers. (C) Mapping to tRNAs. In the overall distribution we observe here differences between the two classes. (D) Embedding of the samples using UMAP, colored by the disease phenotype using miRNAs. A clustering in the two groups can be recognized in this embedding. (E) The same embedding for tRNAs. In the case of this RNA class, no clear clustering is present. (F) Color-coded clustering for the sex and disease phenotype for microRNAs (top) and tRNAs (bottom). The two classes don’t show clustering with respect to sex but for microRNAs a clustering of AD samples can be observed. (G) Results of the PVCA for miRNAs. Around 15% of the total variance can be explained by the disease phenotype. (H) The same results for the tRNAs. Here, a lower percentage of variance is explained by the disease phenotype.
Figure 3.
Figure 3.
Downstream analyses for AD and control samples. (A) Volcano plot displaying each microRNA as a dot. Colored dots are statistically significant (adjusted P-value < 0.05). (B) For one significant marker (hsa-miR-1468–5p) the data are presented as boxplots. Again, single samples can be highlighted by moving the mouse over. (C) Box-plot for a novel miRNA candidate. (D) Precursor structure of this novel miRNA candidate and the minimum free energy. Users can switch between the representation of the precursor and the stem-loop. (E) Distribution of reads on the mature -3p miRNA of the same candidate precursor. Towards the end of the mature miRNA, the –3p heterogeneity that is typical for miRNAs can be recognized. (F) Representation of isoforms. The green bar denotes the precursor, the yellow bar the –5p mature form, the orange bar the –3p form. Each blue bar shows an isoform. The number of reads supporting the isoform can be dynamically adjusted by the user (here, at least 2 RPM are required). (G) If users zoom in the representation, the single base resolution per isoform is displayed (in this example, 1 RPM coverage is sufficient).
Figure 4.
Figure 4.
Downstream analysis results for the use cases. (A) Principal Variance Component Analysis based on the miRNA expression matrix, showing most of the variance explained by the mouse tissue. (B) Principal Variance Component Analysis based on the circRNA expression matrix, showing most of the variance explained by the mouse sex. (C) Reads per million (RPM) normalized expression of mmu_circ_0004351. (D) Volcano plot showing significantly deregulated miRNAs in dementia patients. (E) PCA embedding of the miRNA expression matrix showing a perfect separation between primed and naïve hESCs.

Similar articles

Cited by

References

    1. Bartel D.P. Metazoan microRNAs. Cell. 2018; 173:20–51. - PMC - PubMed
    1. Stavast C.J., Erkeland S.J.. The non-canonical aspects of microRNAs: many roads to gene regulation. Cells. 2019; 8:1465. - PMC - PubMed
    1. Fehlmann T., Backes C., Kahraman M., Haas J., Ludwig N., Posch A.E., Wurstle M.L., Hubenthal M., Franke A., Meder B.et al. .. Web-based NGS data analysis using miRMaster: a large-scale meta-analysis of human miRNAs. Nucleic Acids Res. 2017; 45:8731–8744. - PMC - PubMed
    1. Fehlmann T., Meese E., Keller A.. Exploring ncRNAs in Alzheimer's disease by miRMaster. Oncotarget. 2017; 8:3771–3772. - PMC - PubMed
    1. Chen L., Heikkinen L., Wang C., Yang Y., Sun H., Wong G.. Trends in the development of miRNA bioinformatics tools. Brief. Bioinform. 2019; 20:1836–1852. - PMC - PubMed

Publication types