. 2021 May;226(3):152089.
doi: 10.1016/j.imbio.2021.152089. Epub 2021 Apr 6.

Full length RAG2 expression enhances the DNA damage response in pre-B cells

Affiliations

Full length RAG2 expression enhances the DNA damage response in pre-B cells

Jennifer N Byrum et al. Immunobiology. 2021 May.

Abstract

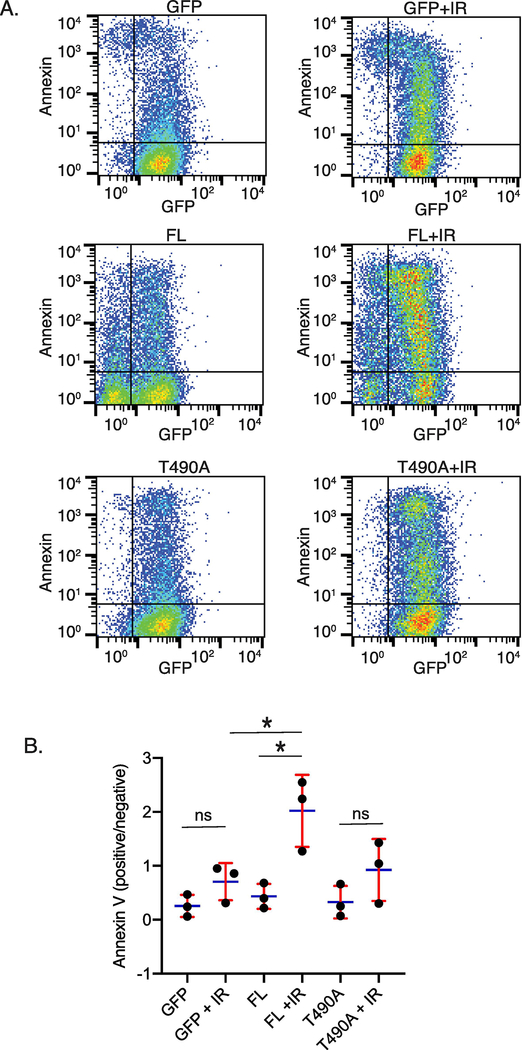
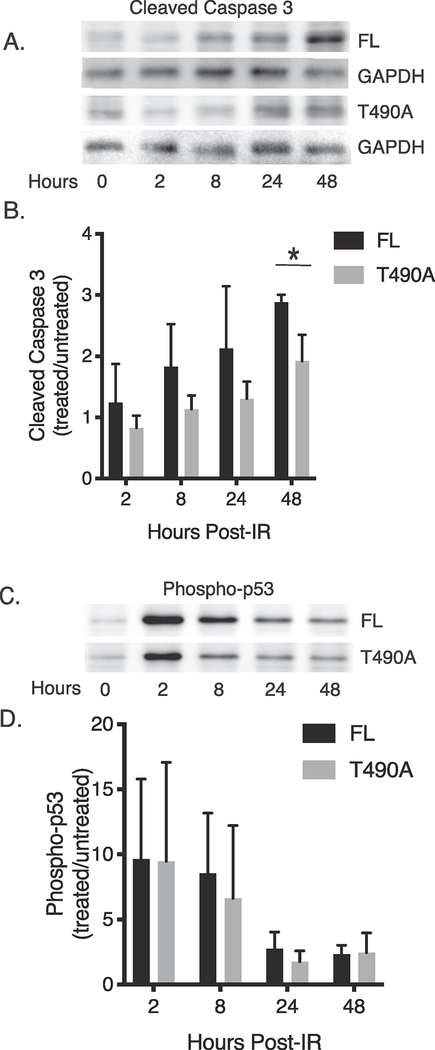
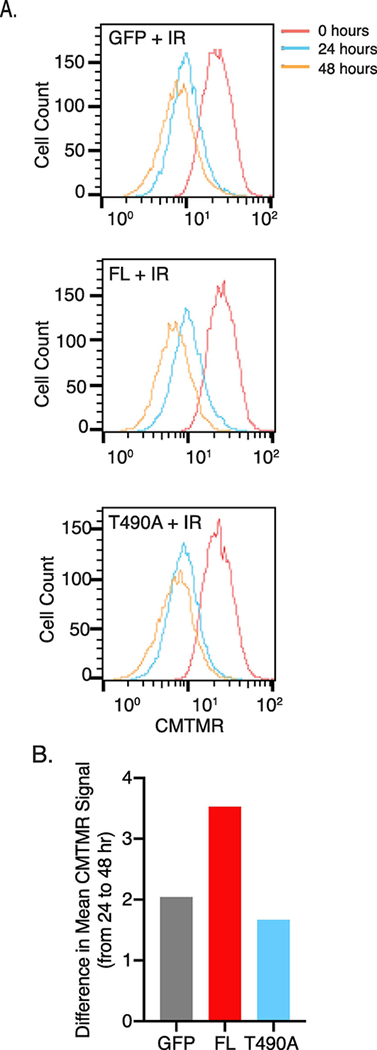
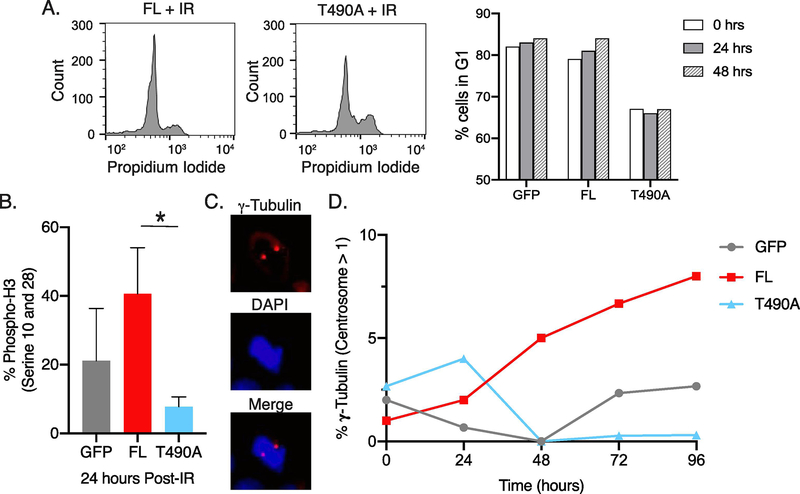
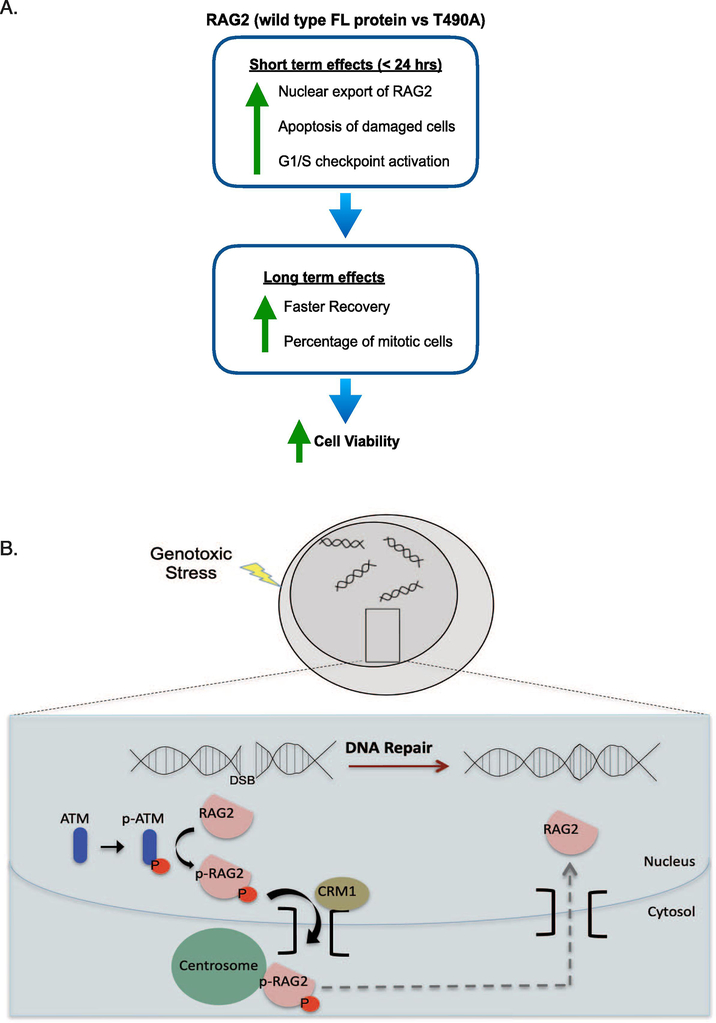
V(D)J recombination by the RAG1 and RAG2 protein complex in developing lymphocytes includes DNA double strand break (DSB) intermediates. RAG2 undergoes export from the nucleus and enrichment at the centrosome minutes following production of DSBs by genotoxic stress, suggesting that RAG2 participates in cellular responses to DSBs such as those generated during V(D)J recombination. To determine the effect of RAG2 expression on cell viability following DSB generation, we measured pre-B cells that expressed either full length (FL) wild-type RAG2, or a T490A mutant of RAG2 that has increased stability and fails to undergo nuclear export following generation of DSBs. Each RAG2 construct was labeled with GFP at the N-terminus. Compared to the T490A mutant, cells expressing FL RAG2 exhibited elevated apoptosis by 24 h following irradiation, and this coincided with a greater amount of Caspase 3 cleavage measured in cell lysates. Pre-B cells expressing either RAG2 protein exhibited similar increases in phospho-p53 levels following irradiation. Interestingly, FL RAG2-expressing cells exhibited elevated division relative to the T490A clone beginning ~24 h following irradiation, as well as an increased percentage of cells proceeding through mitosis, suggesting an improved rate of recovery following the initial burst in apoptosis. Altogether, these data show that FL RAG2, but not its stable nuclear export-defective T490A mutant, participates in pre-B cell decisions between apoptosis versus DNA repair and cell cycle progression following DNA damage.

Keywords: Apoptosis; Cell cycle; DNA damage response; DNA repair; Genotoxic stress; Pre-B cells; RAG1; RAG2; V(D)J recombination.


Figures

Figure 1.
Figure 1.. FL RAG2-expressing cells show a higher burst of apoptosis following IR as compared to T490A and GFP control-expressing cells.
(A) Flow cytometry measuring GFP fluorescence in cells that expressed GFP alone, or GFP fused to FL or T490A RAG2. Measurements were made before and 24 hrs following IR. Plots are representative of 3 separate trials (Annexin, Annexin V) (B) Averaged ratios of Annexin V positive to negative cells for each sample. Error bars represent SD, n=3. *, p<0.05 by student’s t test; ns, not significant
Figure 2.
Figure 2.. IR-induced effects on levels of cleaved caspase-3 and phosphorylated p53 in RAG2-expressing cells.
(A) Detection of caspase-3 cleavage in cells that expressed either FL or T490A. The samples were prepared at the indicated times following IR. In (B) is plotted the averaged ratio of caspase-3 cleavage measured in treated and untreated samples at each time point. The error bars represent SD (n=3). (C) Detection of p53 phosphorylation following IR in cells that expressed either FL or T490A. In (D) is the averaged ratio of p53 phosphorylation in treated and untreated cells measured at the indicated time points following IR. The error bars represent SD (n=3). *, p<0.05 by student’s t test
Figure 3.
Figure 3.. FL RAG2-expressing pre-B cells show increased pre-B cell proliferation after 24 hrs post-IR.
(A) Cell proliferation analysis using flow cytometry. Proliferation was measured by the decrease in Cell Tracker Orange (CMTMR) label due to cell division. Samples were treated with IR, labeled with CMTMR, and then returned to culture for the indicated times before flow cytometry. In (B) is the difference in peak mean fluorescence intensity between 24 and 48 hrs following IR for each sample. The data are a representative example of 3 separate trials.
Figure 4.
Figure 4.. Elevation in markers for mitosis following IR in pre-B cells expressing FL RAG2.
(A) Representative flow cytometry plots of propidium iodide stained FL and T490A clones 24 hrs post-IR, indicating cell cycle phases (left flow plots). Representative plots of % FL, T490A, and GFP control cells in the G1 cell cycle phase at the indicated timepoints post-IR. (B) Detection of histone 3 (H3) phosphorylation at Ser10, Ser28, and Thr11. At 24 hr post-IR, cells were immunostained with antibody to phospho-H3, and then measured by flow cytometry. Error bars represent SD (n=3). *, p<0.05 by student’s t test (C) Representative microscope images of pre-B cells that expressed FL cells and stained with antibody to gamma-tubulin and secondary antibody DyLight 594 (top) and DAPI (middle) 24 hrs following IR. The bottom image is a merge of the gamma-tubulin and DAPI stains. (D) Quantification of gamma-tubulin stain for each sample at indicated times following IR. Centrosome numbers per cell were determined from at least 20 different cells per sample and the values plotted versus timepoints post-IR. The data are a representative example of 3 separate trials.
Figure 5.
Figure 5.. Model for the effect of FL RAG2 on the DDR in developing B cells.
(A) In the short term (within 24 hrs post-IR), RAG2 exports from the nucleus, followed by levels of robust apoptosis and checkpoint activation. After the initial burst in apoptosis of damaged cells, RAG2-expressing cells show an increased growth rate and an increased percentage of mitotic cells. Altogether, the FL-expressing cells demonstrate increased cell viability following genotoxic stress relative to either the T490A-expressing or GFP control-expressing cells. (B) Model for nuclear export of FL RAG2 upon genotoxic stress. RAG2 includes core and non-core (nc) regions. The nc region mediates both nuclear export and centrosome targeting, as core RAG2 does not localize to the centrosome following DNA damage, and mutation of threonine 490 (T490) to alanine blocks nuclear export of full length RAG2 (18). Nuclear export of RAG2 is dependent on ATM and exportin-1/CRM1.

Similar articles

Cited by

References

    1. Gellert M (2002) V(D)J recombination: RAG proteins, repair factors, and regulation. Annu. Rev. Biochem. 71, 101–132 - PubMed
    1. Schatz DG, and Ji Y (2011) Recombination centres and the orchestration of V(D)J recombination. Nat Rev Immunol 11, 251–263 - PubMed
    1. Schatz DG, and Swanson PC (2011) V(D)J recombination: mechanisms of initiation. Annu Rev Genet 45, 167–202 - PubMed
    1. Rodgers KK (2017) Riches in RAGs: Revealing the V(D)J Recombinase through High-Resolution Structures. Trends Biochem Sci 42, 72–84 - PMC - PubMed
    1. Rooney S, Chaudhuri J, and Alt FW (2004) The role of the non-homologous end-joining pathway in lymphocyte development. Immunol Rev 200, 115–131 - PubMed

Publication types