CT Evaluation of Lymph Nodes That Merge or Split during the Course of a Clinical Trial: Limitations of RECIST 1.1
- PMID: 33874734
- PMCID: PMC8189184
- DOI: 10.1148/rycan.2021200090
CT Evaluation of Lymph Nodes That Merge or Split during the Course of a Clinical Trial: Limitations of RECIST 1.1
Abstract
Purpose To compare Response Evaluation Criteria in Solid Tumors (RECIST) version 1.1 with volumetric measurement in the setting of target lymph nodes that split into two or more nodes or merge into one conglomerate node. Materials and Methods In this retrospective study, target lymph nodes were evaluated on CT scans from 166 patients with different types of cancer; 158 of the scans came from The Cancer Imaging Archive. Each target node was measured using RECIST 1.1 criteria before and after merging or splitting, followed by volumetric segmentation. To compare RECIST 1.1 with volume, a single-dimension hypothetical diameter (HD) was determined from the nodal volume. The nodes were divided into three groups: (a) one-target merged (one target node merged with other nodes); (b) two-target merged (two neighboring target nodes merged); and (c) split node (a conglomerate node cleaved into smaller fragments). Bland-Altman analysis and t test were applied to compare RECIST 1.1 with HD. On the basis of the RECIST 1.1 concept, we compared response category changes between RECIST 1.1 and HD. Results The data set consisted of 30 merged nodes (19 one-target merged and 11 two-target merged) and 20 split nodes (mean age for all 50 included patients, 50 years ± 7 [standard deviation]; 38 men). RECIST 1.1, volumetric, and HD measurements indicated an increase in size in all one-target merged nodes. While volume and HD indicated an increase in size for nodes in the two-target merged group, RECIST 1.1 showed a decrease in size in all two-target merged nodes. Although volume and HD demonstrated a decrease in size of all split nodes, RECIST 1.1 indicated an increase in size in 60% (12 of 20) of the nodes. Discrepancy of the response categories between RECIST 1.1 and HD was observed in 5% (one of 19) in one-target merged, 82% (nine of 11) in two-target merged, and 55% (11 of 20) in split nodes. Conclusion RECIST 1.1 does not optimally reflect size changes when lymph nodes merge or split. Keywords: CT, Lymphatic, Tumor Response Supplemental material is available for this article. © RSNA, 2021.
Keywords: CT; Lymphatic; Tumor Response.
Conflict of interest statement
Figures
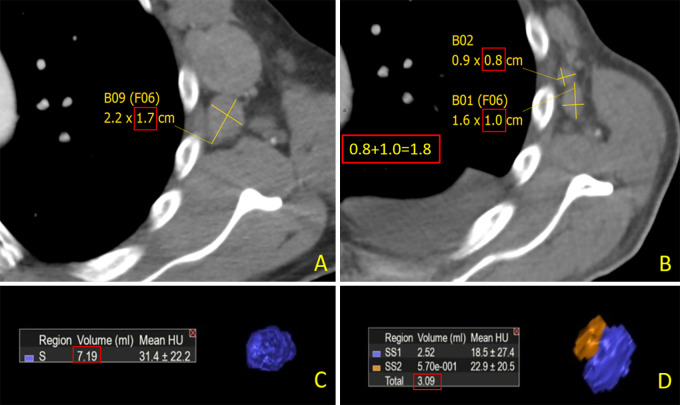
![A, Three hypothetical scenarios are shown for merging and splitting
nodal lesions. Top, one-target merged (one target node [short-axis diameter
≥ 1.5 cm] merges with nearby nontarget node or nodes); middle,
two-target merged (two neighboring target nodes merge with each other); and
bottom, split node (a conglomerate target node splits into smaller
fragments). B–D, Images show example patterns of merging in, B,
one-target merged and, C, two-target merged and, D, splitting in lymph nodes
that were assessed on serial CT images. These theoretical graphs show
possible scenarios in which RECIST 1.1 measurements (top row) could differ
from volumetric measurements (bottom row). In the one-target merging
scenario (B), both volumetric measurement and RECIST 1.1 display an increase
in size after merging (268 to 524 cm3 for volume and 8 to 10 cm for RECIST
1.1). In the two-target merging scenario (C), although volumetric
measurement, which represents the true number of cancer cells, shows an
increase in size (302 to 580 cm3), RECIST 1.1 measurement shows a decrease
(12 to 10 cm). In the splitting scenario (D), the opposite can occur. While
a conglomerate node gets smaller and splits into smaller fragments, the
total volume shows a decrease in size (580 to 302 cm3), while RECIST 1.1
indicates an increase (10 to 12 cm). RECIST = Response Evaluation Criteria
in Solid Tumors.](https://cdn.ncbi.nlm.nih.gov/pmc/blobs/6a01/8189184/8c0928ff3110/rycan.2021200090.fig1.jpg)


References
-
- Eisenhauer EA , Therasse P , Bogaerts J , et al . New response evaluation criteria in solid tumours: revised RECIST guideline (version 1.1) . Eur J Cancer 2009. ; 45 ( 2 ): 228 – 247 . - PubMed
-
- Fournier L , Ammari S , Thiam R , Cuénod CA . Imaging criteria for assessing tumour response: RECIST, mRECIST, Cheson . Diagn Interv Imaging 2014. ; 95 ( 7-8 ): 689 – 703 . - PubMed
-
- Nishino M . Tumor Response Assessment for Precision Cancer Therapy: Response Evaluation Criteria in Solid Tumors and Beyond . Am Soc Clin Oncol Educ Book 2018. ; 38 ( 38 ): 1019 – 1029 . - PubMed
-
- Chalian H , Töre HG , Horowitz JM , Salem R , Miller FH , Yaghmai V . Radiologic assessment of response to therapy: comparison of RECIST Versions 1.1 and 1.0 . RadioGraphics 2011. ; 31 ( 7 ): 2093 – 2105 . - PubMed
Publication types
MeSH terms
LinkOut - more resources
Full Text Sources
Other Literature Sources
Medical