

Zea mays RNA-seq estimated transcript abundances are strongly affected by read mapping bias
- PMID: 33874908
- PMCID: PMC8056621
- DOI: 10.1186/s12864-021-07577-3
Zea mays RNA-seq estimated transcript abundances are strongly affected by read mapping bias
Abstract
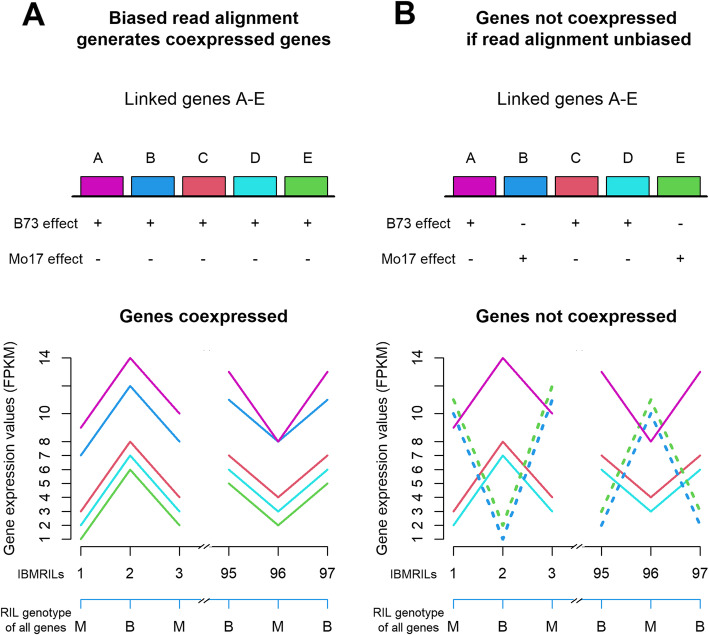
Background: Genetic variation for gene expression is a source of phenotypic variation for natural and agricultural species. The common approach to map and to quantify gene expression from genetically distinct individuals is to assign their RNA-seq reads to a single reference genome. However, RNA-seq reads from alleles dissimilar to this reference genome may fail to map correctly, causing transcript levels to be underestimated. Presently, the extent of this mapping problem is not clear, particularly in highly diverse species. We investigated if mapping bias occurred and if chromosomal features associated with mapping bias. Zea mays presents a model species to assess these questions, given it has genotypically distinct and well-studied genetic lines.
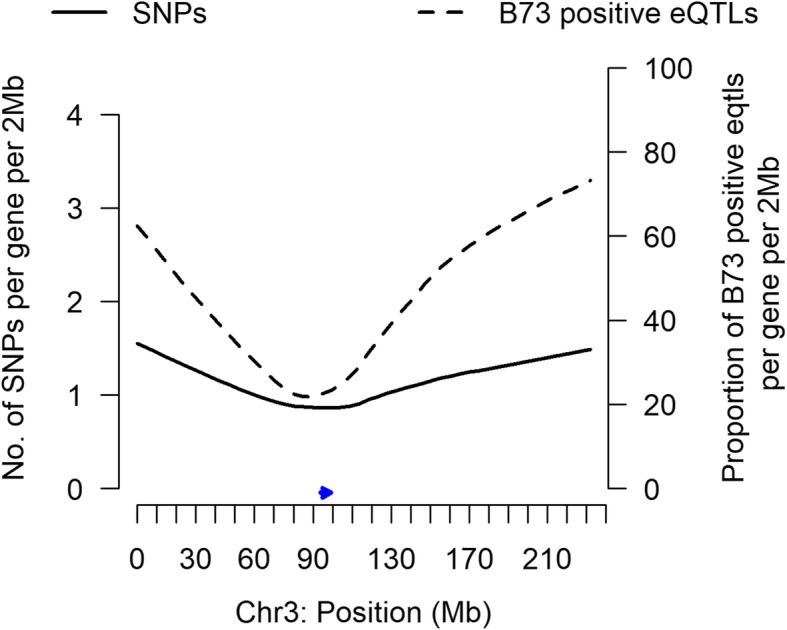
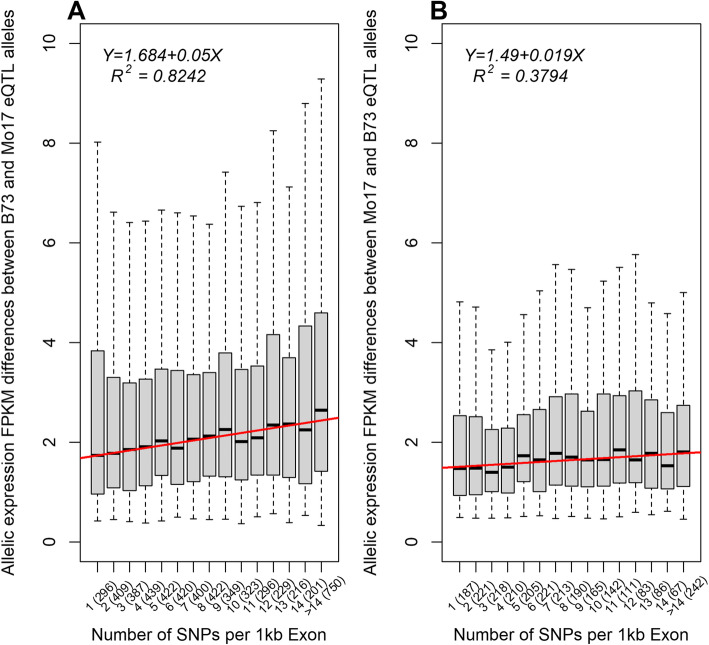
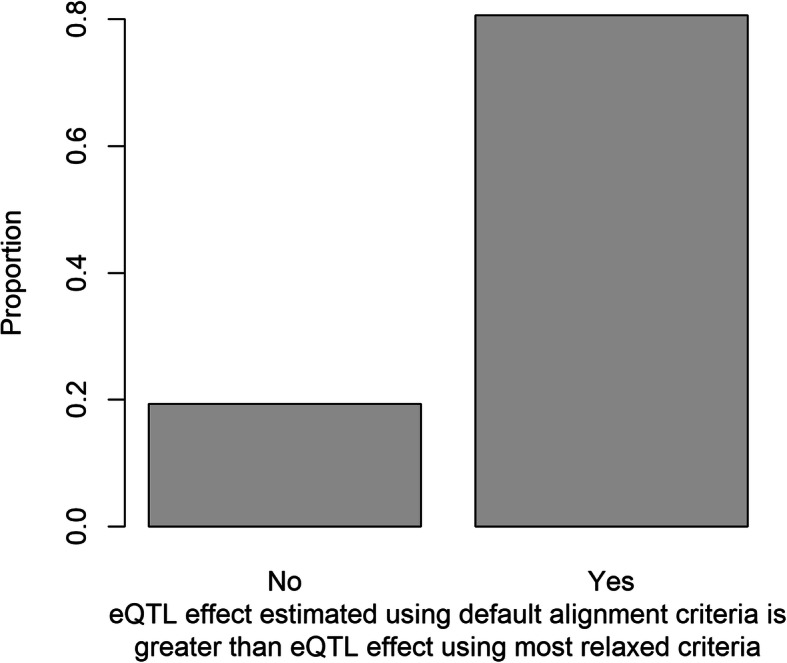
Results: In Zea mays, the inbred B73 genome is the standard reference genome and template for RNA-seq read assignments. In the absence of mapping bias, B73 and a second inbred line, Mo17, would each have an approximately equal number of regulatory alleles that increase gene expression. Remarkably, Mo17 had 2-4 times fewer such positively acting alleles than did B73 when RNA-seq reads were aligned to the B73 reference genome. Reciprocally, over one-half of the B73 alleles that increased gene expression were not detected when reads were aligned to the Mo17 genome template. Genes at dissimilar chromosomal ends were strongly affected by mapping bias, and genes at more similar pericentromeric regions were less affected. Biased transcript estimates were higher in untranslated regions and lower in splice junctions. Bias occurred across software and alignment parameters.
Conclusions: Mapping bias very strongly affects gene transcript abundance estimates in maize, and bias varies across chromosomal features. Individual genome or transcriptome templates are likely necessary for accurate transcript estimation across genetically variable individuals in maize and other species.
Keywords: Gene coexpression analysis; Genetic diversity; Maize; Mapping bias; RNA-Seq; Sequence divergence; Transcriptome variation; eQTL analysis.
Conflict of interest statement
The authors declare that they have no competing interests.
Figures
Similar articles
-
Variation in leaf transcriptome responses to elevated ozone corresponds with physiological sensitivity to ozone across maize inbred lines.Genetics. 2022 Jul 30;221(4):iyac080. doi: 10.1093/genetics/iyac080. Genetics. 2022. PMID: 35579358 Free PMC article.
-
Maize (Zea mays L.) genome diversity as revealed by RNA-sequencing.PLoS One. 2012;7(3):e33071. doi: 10.1371/journal.pone.0033071. Epub 2012 Mar 16. PLoS One. 2012. PMID: 22438891 Free PMC article.
-
RSEM: accurate transcript quantification from RNA-Seq data with or without a reference genome.BMC Bioinformatics. 2011 Aug 4;12:323. doi: 10.1186/1471-2105-12-323. BMC Bioinformatics. 2011. PMID: 21816040 Free PMC article.
-
Mapping RNA-seq reads to transcriptomes efficiently based on learning to hash method.Comput Biol Med. 2020 Jan;116:103539. doi: 10.1016/j.compbiomed.2019.103539. Epub 2019 Nov 13. Comput Biol Med. 2020. PMID: 31765913 Review.
-
Handling multi-mapped reads in RNA-seq.Comput Struct Biotechnol J. 2020 Jun 12;18:1569-1576. doi: 10.1016/j.csbj.2020.06.014. eCollection 2020. Comput Struct Biotechnol J. 2020. PMID: 32637053 Free PMC article. Review.
Cited by
-
Divergence of cochlear transcriptomics between reference‑based and reference‑free transcriptome analyses among Rhinolophus ferrumequinum populations.PLoS One. 2023 Jul 11;18(7):e0288404. doi: 10.1371/journal.pone.0288404. eCollection 2023. PLoS One. 2023. PMID: 37432940 Free PMC article.
-
Introgressions lead to reference bias in wheat RNA-seq analysis.BMC Biol. 2024 Mar 7;22(1):56. doi: 10.1186/s12915-024-01853-w. BMC Biol. 2024. PMID: 38454464 Free PMC article.
References
-
- Becker MG, Zhang X, Walker PL, Wan JC, Millar JL, Khan D, Granger MJ, Cavers JD, Chan AC, Fernando DWG, Belmonte MF. Transcriptome analysis of the Brassica napus–Leptosphaeria maculans pathosystem identifies receptor, signaling and structural genes underlying plant resistance. Plant J. 2017;90(3):573–586. doi: 10.1111/tpj.13514. - DOI - PubMed
-
- Taylor CM, Kamphuis LG, Zhang W, Garg G, Berger JD, Mousavi-Derazmahalleh M, Bayer PE, Edwards D, Singh KB, Cowling WA, Nelson MN. INDEL variation in the regulatory region of the major flowering time gene LanFTc1 is associated with vernalization response and flowering time in narrow-leafed lupin (Lupinus angustifolius L.) Plant Cell Environ. 2019;42(1):174–187. doi: 10.1111/pce.13320. - DOI - PMC - PubMed
MeSH terms
LinkOut - more resources
Full Text Sources
Other Literature Sources
