

A review of statistical methods for dietary pattern analysis
- PMID: 33874970
- PMCID: PMC8056502
- DOI: 10.1186/s12937-021-00692-7
A review of statistical methods for dietary pattern analysis
Abstract
Background: Dietary pattern analysis is a promising approach to understanding the complex relationship between diet and health. While many statistical methods exist, the literature predominantly focuses on classical methods such as dietary quality scores, principal component analysis, factor analysis, clustering analysis, and reduced rank regression. There are some emerging methods that have rarely or never been reviewed or discussed adequately.
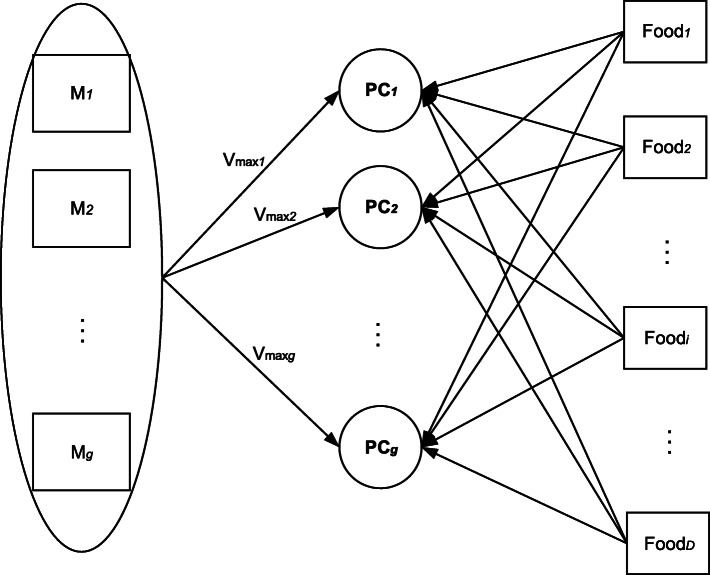
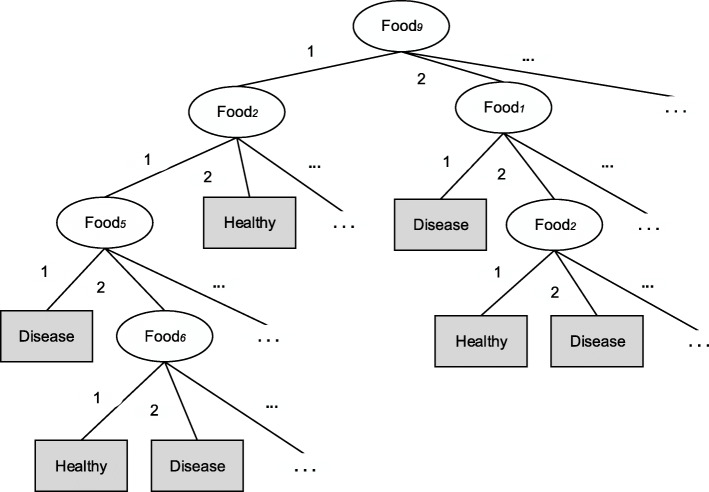
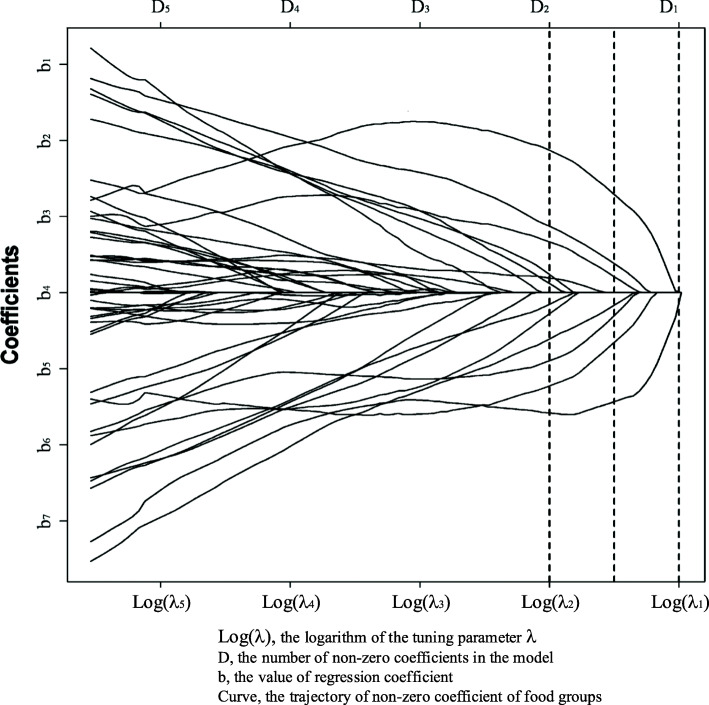
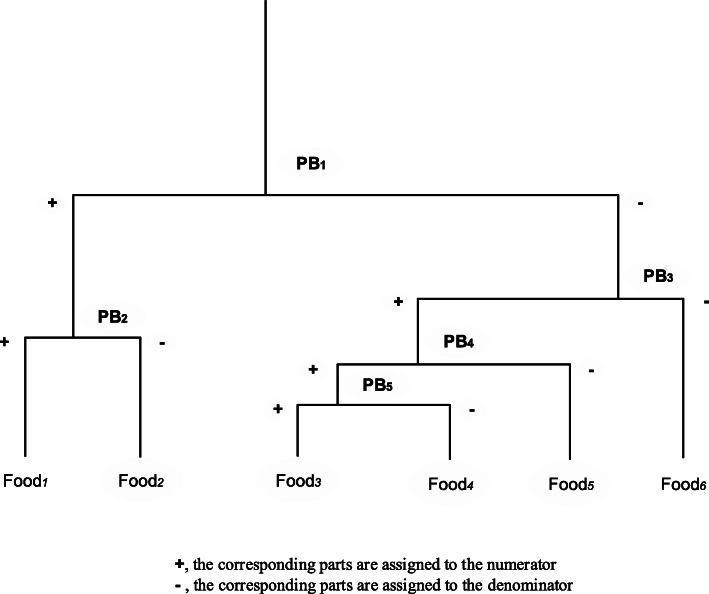
Methods: This paper presents a landscape review of the existing statistical methods used to derive dietary patterns, especially the finite mixture model, treelet transform, data mining, least absolute shrinkage and selection operator and compositional data analysis, in terms of their underlying concepts, advantages and disadvantages, and available software and packages for implementation.
Results: While all statistical methods for dietary pattern analysis have unique features and serve distinct purposes, emerging methods warrant more attention. However, future research is needed to evaluate these emerging methods' performance in terms of reproducibility, validity, and ability to predict different outcomes.
Conclusion: Selection of the most appropriate method mainly depends on the research questions. As an evolving subject, there is always scope for deriving dietary patterns through new analytic methodologies.
Keywords: Clustering analysis; Compositional data analysis; Data mining; Dietary patterns; Dietary quality scores; Factor analysis; Least absolute shrinkage and selection operator; Principal component analysis; Reduced rank regression; Treelet transform.
Conflict of interest statement
The authors declare no conflict of interest.
Figures
References
-
- Moeller SM, Reedy J, Millen AE, Dixon LB, Newby PK, Tucker KL, Krebs-Smith SM, Guenther PM. Dietary patterns: challenges and opportunities in dietary patterns research an experimental biology workshop, April 1, 2006. J Am Diet Assoc. 2007;107(7):1233–1239. doi: 10.1016/j.jada.2007.03.014. - DOI - PubMed
-
- Hu FB. Dietary pattern analysis: a new direction in nutritional epidemiology. Curropinlipidol. 2002;13(1):3–9. - PubMed
-
- Solans M, Coenders G, Marcos-Gragera R, Castelló A, Gràcia-Lavedan E, Benavente Y, Moreno V, Pérez-Gómez B, Amiano P, Fernández-Villa T, Guevara M, Gómez-Acebo I, Fernández-Tardón G, Vanaclocha-Espi M, Chirlaque MD, Capelo R, Barrios R, Aragonés N, Molinuevo A, Vitelli-Storelli F, Castilla J, Dierssen-Sotos T, Castaño-Vinyals G, Kogevinas M, Pollán M, Saez M. Compositional analysis of dietary patterns. Stat Methods Med Res. 2018;28(9):2834–2847. doi: 10.1177/0962280218790110. - DOI - PubMed
Publication types
MeSH terms
LinkOut - more resources
Full Text Sources
Other Literature Sources
Research Materials
