. 2021 Apr 19;13(1):63.
doi: 10.1186/s13073-021-00870-6.

Rare deleterious mutations of HNRNP genes result in shared neurodevelopmental disorders

Madelyn A Gillentine  1 Tianyun Wang  1 Kendra Hoekzema  1 Jill Rosenfeld  2   3 Pengfei Liu  2 Hui Guo  1   4 Chang N Kim  5   6   7   8 Bert B A De Vries  9 Lisenka E L M Vissers  9 Magnus Nordenskjold  10   11 Malin Kvarnung  10   11 Anna Lindstrand  10   11 Ann Nordgren  10   11 Jozef Gecz  12   13   14 Maria Iascone  15 Anna Cereda  16 Agnese Scatigno  16 Silvia Maitz  17 Ginevra Zanni  18 Enrico Bertini  18 Christiane Zweier  19 Sarah Schuhmann  19 Antje Wiesener  19 Micah Pepper  20   21 Heena Panjwani  20   21 Erin Torti  22 Farida Abid  23   24 Irina Anselm  25 Siddharth Srivastava  25 Paldeep Atwal  26 Carlos A Bacino  3 Gifty Bhat  27 Katherine Cobian  27 Lynne M Bird  28   29 Jennifer Friedman  28   30   31 Meredith S Wright  28   30 Bert Callewaert  32 Florence Petit  33 Sophie Mathieu  34 Alexandra Afenjar  34 Celenie K Christensen  35 Kerry M White  36 Orly Elpeleg  37 Itai Berger  38   39 Edward J Espineli  23   24 Christina Fagerberg  40 Charlotte Brasch-Andersen  40 Lars Kjærsgaard Hansen  41 Timothy Feyma  42 Susan Hughes  43   44 Isabelle Thiffault  44   45 Bonnie Sullivan  43 Shuang Yan  43 Kory Keller  46 Boris Keren  47 Cyril Mignot  47 Frank Kooy  48 Marije Meuwissen  48 Alice Basinger  49 Mary Kukolich  49 Meredith Philips  49 Lucia Ortega  49 Margaret Drummond-Borg  49 Mathilde Lauridsen  40 Kristina Sorensen  40 Anna Lehman  50   51 CAUSES StudyElena Lopez-Rangel  50   52   53 Paul Levy  54 Davor Lessel  55 Timothy Lotze  23 Suneeta Madan-Khetarpal  56   57 Jessica Sebastian  56 Jodie Vento  56 Divya Vats  58 L Manace Benman  59 Shane Mckee  60 Ghayda M Mirzaa  61   62   63 Candace Muss  64 John Pappas  65 Hilde Peeters  66 Corrado Romano  67 Maurizio Elia  67 Ornella Galesi  67 Marleen E H Simon  68 Koen L I van Gassen  68 Kara Simpson  69 Robert Stratton  70 Sabeen Syed  71 Julien Thevenon  72 Irene Valenzuela Palafoll  73 Antonio Vitobello  74   75 Marie Bournez  76   77 Laurence Faivre  75   77 Kun Xia  4 SPARK ConsortiumRachel K Earl  20   21   78 Tomasz Nowakowski  5   6   7   8 Raphael A Bernier  20   21   78 Evan E Eichler  79   80
Collaborators, Affiliations

Rare deleterious mutations of HNRNP genes result in shared neurodevelopmental disorders

Madelyn A Gillentine et al. Genome Med. .

Abstract

Background: With the increasing number of genomic sequencing studies, hundreds of genes have been implicated in neurodevelopmental disorders (NDDs). The rate of gene discovery far outpaces our understanding of genotype-phenotype correlations, with clinical characterization remaining a bottleneck for understanding NDDs. Most disease-associated Mendelian genes are members of gene families, and we hypothesize that those with related molecular function share clinical presentations.

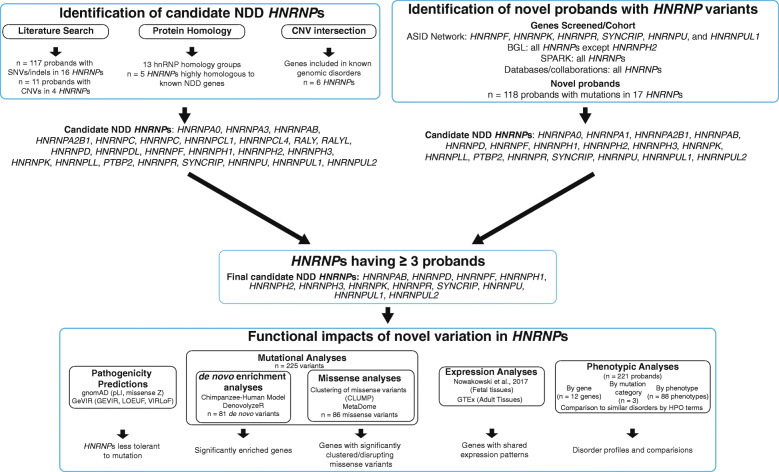
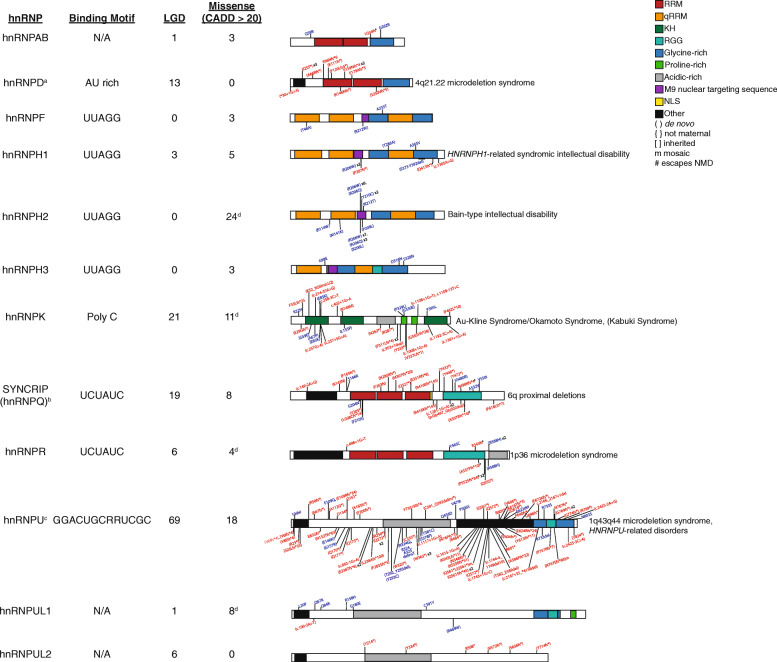
Methods: We tested our hypothesis by considering gene families that have multiple members with an enrichment of de novo variants among NDDs, as determined by previous meta-analyses. One of these gene families is the heterogeneous nuclear ribonucleoproteins (hnRNPs), which has 33 members, five of which have been recently identified as NDD genes (HNRNPK, HNRNPU, HNRNPH1, HNRNPH2, and HNRNPR) and two of which have significant enrichment in our previous meta-analysis of probands with NDDs (HNRNPU and SYNCRIP). Utilizing protein homology, mutation analyses, gene expression analyses, and phenotypic characterization, we provide evidence for variation in 12 HNRNP genes as candidates for NDDs. Seven are potentially novel while the remaining genes in the family likely do not significantly contribute to NDD risk.

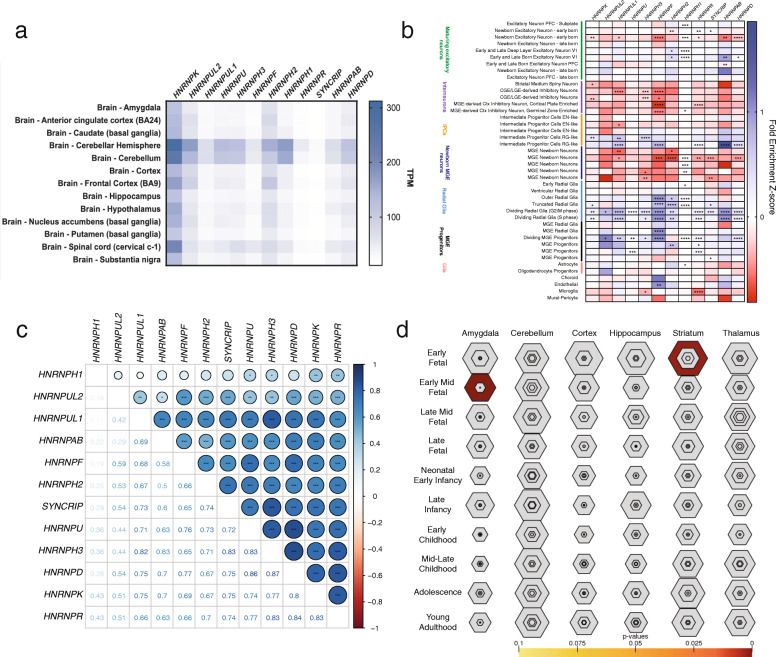
Results: We report 119 new NDD cases (64 de novo variants) through sequencing and international collaborations and combined with published clinical case reports. We consider 235 cases with gene-disruptive single-nucleotide variants or indels and 15 cases with small copy number variants. Three hnRNP-encoding genes reach nominal or exome-wide significance for de novo variant enrichment, while nine are candidates for pathogenic mutations. Comparison of HNRNP gene expression shows a pattern consistent with a role in cerebral cortical development with enriched expression among radial glial progenitors. Clinical assessment of probands (n = 188-221) expands the phenotypes associated with HNRNP rare variants, and phenotypes associated with variation in the HNRNP genes distinguishes them as a subgroup of NDDs.

Conclusions: Overall, our novel approach of exploiting gene families in NDDs identifies new HNRNP-related disorders, expands the phenotypes of known HNRNP-related disorders, strongly implicates disruption of the hnRNPs as a whole in NDDs, and supports that NDD subtypes likely have shared molecular pathogenesis. To date, this is the first study to identify novel genetic disorders based on the presence of disorders in related genes. We also perform the first phenotypic analyses focusing on related genes. Finally, we show that radial glial expression of these genes is likely critical during neurodevelopment. This is important for diagnostics, as well as developing strategies to best study these genes for the development of therapeutics.

Keywords: Cortex development; Gene families; Neurodevelopmental disorders; hnRNPs.


Conflict of interest statement

The Department of Molecular and Human Genetics at Baylor College of Medicine receives revenue from clinical genetic testing conducted at Baylor Genetics Laboratory. E.T. is an employee of GeneDx. The remaining authors declare no competing interests.

Figures

Fig. 1
Fig. 1
Study workflow. Candidate NDD HNRNPs were determined from the literature and publicly available information (such as amino acid sequences) and from identification of probands in our novel cohorts. The candidate NDD HNRNPs were finalized by considering only genes in which at least three probands were identified from published and/or novel sources. Functional impacts focused on these finalized NDD HNRNP candidates and included pathogenicity predictions (gnomAD and GEVIR), de novo enrichment analyses (using the Chimpanzee–Human [CH] model and denovolyzeR), missense analyses (using CLUMP and MetaDome), expression analyses of fetal cortex and adult tissues, and phenotypic analyses within HNRNPs, across HNRNPs, and in comparison to other similarly presenting disorders by HPO terms. CNV: copy number variant; pLI: loss-of-function intolerance; LGD: likely gene disrupting; NMD: nonsense mediated decay; HPO: human phenotype ontology
Fig. 2
Fig. 2
Protein similarity of hnRNPs. Correlation plot of hnRNPs by canonical amino acid sequence. Pearson correlation values are shown in the bottom half of the plot and are shown visually on the top half of the plot
Fig. 3
Fig. 3
Pathogenicity assessment of variation in hnRNPs. pLI and Z-scores were obtained from gnomAD. pLI scores are significantly higher among NDD hnRNPs (n = 12) compared to non-NDD hnRNPs (n = 20), suggesting LGD variants are more likely to be damaging. Z-scores trend towards being significantly higher for NDD hnRNPs, suggesting severe missense variants are likely to be damaging. T-test with Welch’s correction. *p < 0.05. pLI: loss-of-function intolerance
Fig. 4
Fig. 4
De novo enrichment and clustering of missense variation analyses of NDD hnRNPs. a De novo variation was assessed for NDD HNRNPs using two statistical models: the CH model and denovolyzeR. Right/above the dotted line indicates the gene achieves exome-wide significance (q < 4.24 × 10− 7) while right/above the dashed line indicates the gene reaches nominal significance (q < 0.05). HNRNPU reaches exome-wide significance for all protein-impacting variants (Protein) and LGD variants, with severe missense variants reaching significance by only the CH model. SYNCRIP reaches exome-wide significance for LGD variants and all protein-impacting variants by the CH model alone. HNRNPD reaches nominal significance by the CH model. P values are FDR corrected with the number of genes (n = 18,946 for CH model and n = 19,618 for denovolyzeR) with three tests per gene (LGD, missense, and all protein changes) and two tests (CH model and denovolyzeR) per mutation type. Only cohorts with known de novo status were included, as listed in Tables S1 and S7. Statistics can be seen in Table S6. b Analysis of clustered missense variants. Clustering of missense variants was analyzed using CLUMP; scores are shown in Table S6 (paired t-test). Compared to the non-neuropsychiatric subset of gnomAD (n = 114,704, 1958 missense variants), the CLUMP score for NDD hnRNPs (red) among probands is significantly lower than controls in gnomAD (black), indicating more clustering of mutations (shown by arrow). Note that only genes with variants in the current cohort could undergo this analysis. hnRNPH2, hnRNPK, hnRNPR, and hnRNPUL1 each have independent significant clumping compared to gnomAD controls. c CLUMP scores for missense variants in probands with ASD (n = 60). HnRNPH2, hnRNPK, hnRNPR, and hnRNPUL1 reach significance independently. *p < 0.05, **p < 0.01, ***p < 0.001. LGD: likely gene disrupting; Missense: severe missense (CADD ≥ 20); Protein: all protein-affecting variants
Fig. 5
Fig. 5
hnRNP proband variants. Protein structure, known binding motif, number of probands by mutation type, location of variants in each protein, and known associated disorders of NDD hnRNPs are shown. Novel cases are above the protein with published cases below. Red indicates LGD variants and blue represents severe missense variants. RRM: RNA recognition motif; qRRM: quasi-RNA recognition motif; KH: K-homology domain; RGG: Arginine-glycine rich (RGG) box; NLS: nuclear localization sequence. Further details of each variant are shown in Table S7. Adapted from Geuens et al. [83]. a Gene reaches exome-wide significance for all protein-impacting variants by CH model. b Gene reaches exome-wide significance for all protein-impacting variants and LGD variants by CH model. c Gene reaches exome-wide significance for all protein-impacting variants and LGD variants by CH model and denovolyzeR. d Gene reaches significance for missense variant clustering
Fig. 6
Fig. 6
HNRNP expression in adult and developing fetal cortex tissues. a Heatmap showing transcript-level expression values for NDD hnRNPs for adult brain tissues in GTEx. All tissues are shown in Fig. S4, and p values among individual HNRNPs are shown in Table S3. b Heatmap showing fold change of expression of each NDD HNRNP among 48 different cell types in the developing fetal cortex. Blue indicates increase in fold change of expression and red indicates decreased expression, as determined by Z-scores. NDD HNRNPs have higher fold expression change in MGE progenitors, radial glia, and excitatory neurons, while depleted in inhibitory neurons. All HNRNPs are shown in Fig. S3. Significance indicates enrichment in particular cell types by Wilcoxon ranked sum test with Bonferroni correction based on number of cell types. P values and fold change for scRNA data from developing human cortex can be seen in Tables S4 and S5. c Correlation plot of developing fetal cortex gene expression. Pearson correlation R values are shown in the bottom half of the plot, which are visually in the top half of the plot. P values were corrected by number of genes [23] and number of cell types [48]. HNRNPs in the same homology group tend to have more correlated expression. d Specific brain region enrichment as determined by SEA, showing enrichment of expression of the NDD HNRNPs in the early fetal striatum and early-mid fetal amygdala. *p < 0.05; **p < 0.01; ***p < 0.001, ****p < 0.0001
Fig. 7
Fig. 7
Phenotypic information of 189–221 hnRNP-variation probands. a Correlation matrix of phenotypes across hnRNP probands. Genes are in order of protein similarity as determined by Clustal Omega and canonical protein sequences as in Fig. 1. Phenotypes correlate across all HNRNPs, except HNRNPF due to sample size. Size and shade of circle represent correlation coefficients, which are shown on bottom half of matrix. Correlations for LGD and missense variants separately are in Fig. S4. P values, which are corrected by number of genes [23] and phenotypes (88, occurring in at least 20% of any HNRNP group) can be seen in Table S9. b Plot comparing protein and phenotype correlations that are over Pearson’s R = 0.5. Colors are the same as in Fig. 2 protein groups. Those with more similar protein sequences tend to be more phenotypically similar. c Plot of phenotypes of all probands by mutation type. Individual HNRNPs can be seen in Fig. S5. d Heatmap indicating percent of probands with phenotype. Sample sizes can be seen in Table S7 and range from n = 2 (HNRNPF) to n = 83 (HNRNPU). Lines indicate significant differences as determined by pairwise Fisher’s exact tests with Bonferroni correction based on 12 genes, 88 phenotypes, and three mutational categories. Red dashed lines indicate significance with only LGD variants. Raw p values can be seen in Tables S8. *p < 0.05, **p < 0.01, ***p < 0.001, ****p < 0.0001. LGD: likely gene disrupting; MIS: severe missense (CADD ≥ 20)
Fig. 8
Fig. 8
Relationship of HNRNP-related disorders to each other and to similarly presenting disorders. a Comparison of average number of HPO terms shared within HNRNPs versus with other similarly presenting disorders, as determined by PhenPath. The HNRNP-related disorders present more similarly to each other than other NDDs. HPO terms are in Table S12. b Heatmap showing fold change of expression of each NDD HNRNP and similarly presenting NDD based on HPO terms among 48 different cell types. Blue indicates increase in fold change of expression and red indicates decreased expression, as determined by Z-scores. c Correlation plot of developing fetal cortex gene expression for HNRNPs and genes implicated in similarly presenting disorders. Pearson correlation R values shown visually, with darker and larger circles indicating higher Pearson R values. HNRNPs are noted with a red line. P values were corrected by number of genes [28] and number of cell types [48]. *p < 0.05, **p < 0.01, ***p < 0.001, ****p < 0.0001. d Comparison of expression Pearson’s R values within HNRNPs and compared to similarly presenting disorders. The expression of the HNRNPs is more similar to each other than to other NDDs

References

    1. Coe BP, Stessman HAF, Sulovari A, Geisheker MR, Bakken TE, Lake AM, et al. Neurodevelopmental disease genes implicated by de novo mutation and copy number variation morbidity. Nat Genet. 2019;51(1):106–116. - PMC - PubMed
    1. Khalil B, Morderer D, Price PL, Liu F, Rossoll W. mRNP assembly, axonal transport, and local translation in neurodegenerative diseases. Brain Res. 2018;1693(Pt A):75–91. - PMC - PubMed
    1. Purice MD, Taylor JP. Linking hnRNP function to ALS and FTD pathology. Front Neurosci. 2018;12 - PMC - PubMed
    1. Fu X-D, Ares M. Context-dependent control of alternative splicing by RNA-binding proteins. Nat Rev Genet. 2014;15(10):689–701. - PMC - PubMed
    1. Dickerson JE, Robertson DL. On the origins of Mendelian disease genes in man: the impact of gene duplication. Mol Biol Evol. 2012;29(1):61–69. - PMC - PubMed

Publication types

MeSH terms

Substances