

Marine harmful algal blooms (HABs) in the United States: History, current status and future trends
- PMID: 33875183
- PMCID: PMC8058451
- DOI: 10.1016/j.hal.2021.101975
Marine harmful algal blooms (HABs) in the United States: History, current status and future trends
Abstract
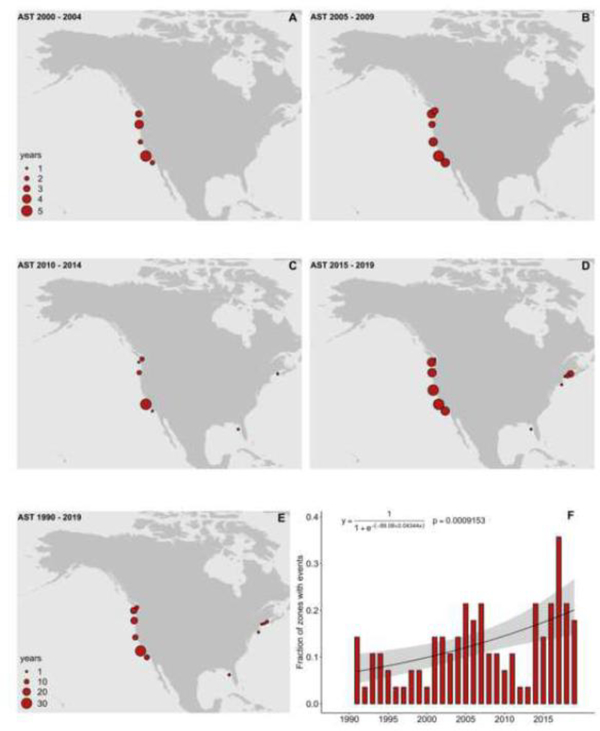
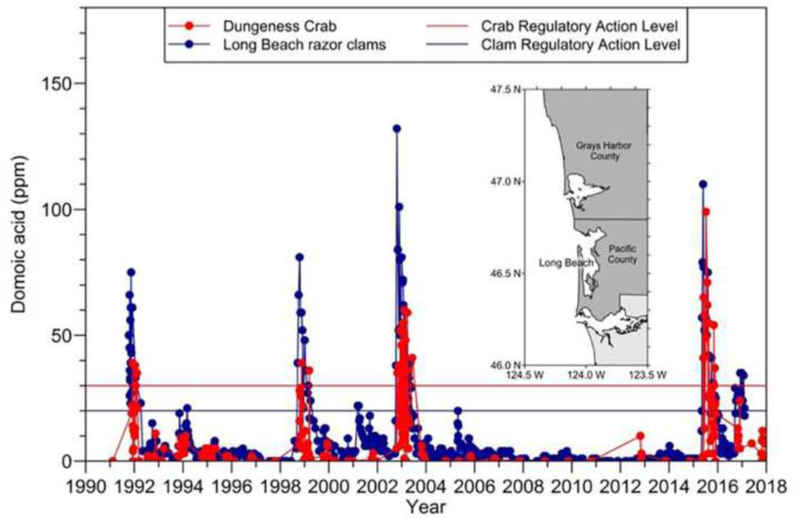
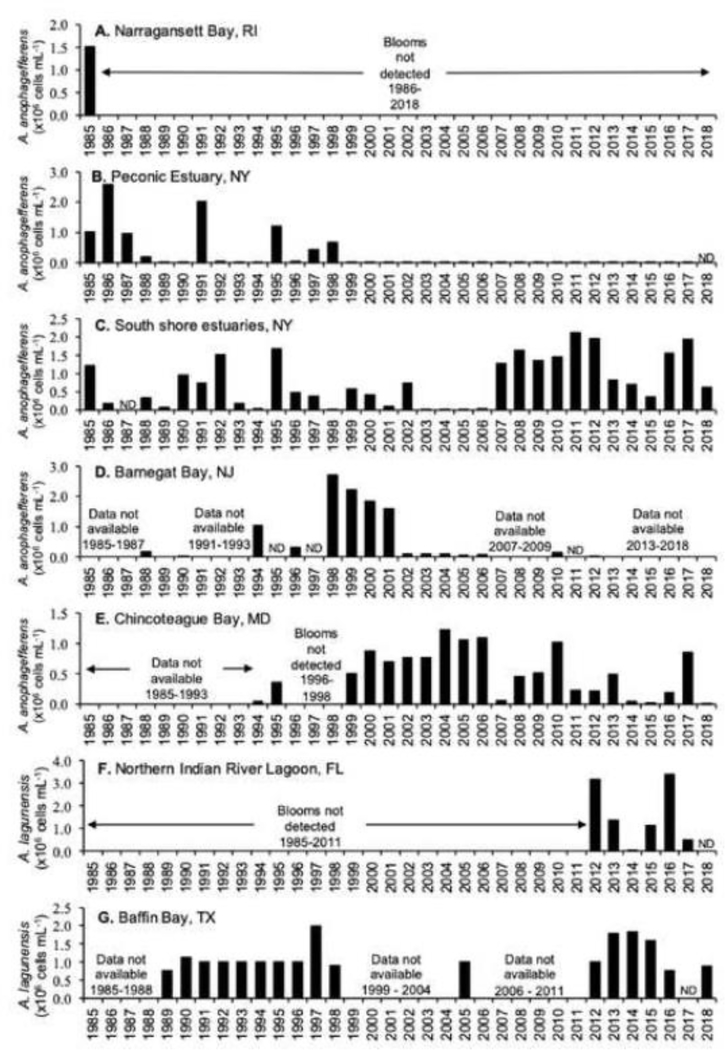
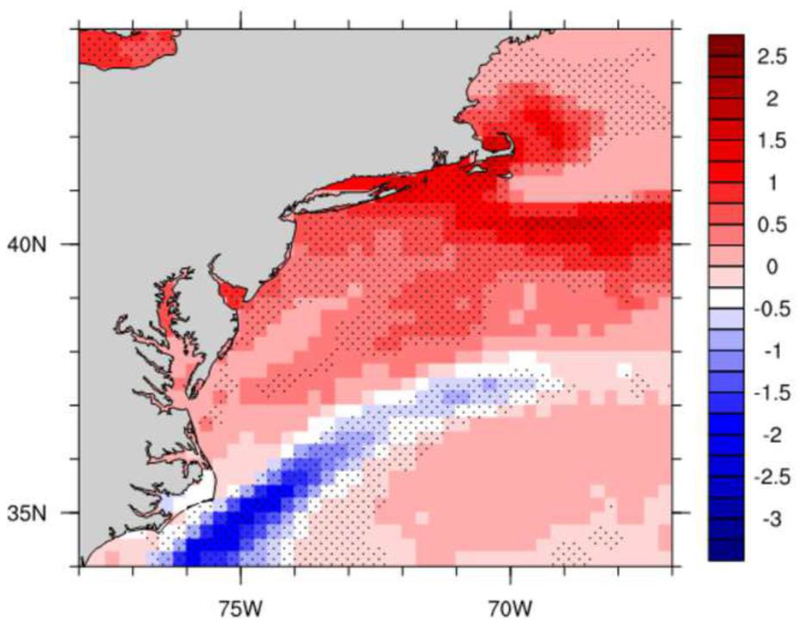
Harmful algal blooms (HABs) are diverse phenomena involving multiple. species and classes of algae that occupy a broad range of habitats from lakes to oceans and produce a multiplicity of toxins or bioactive compounds that impact many different resources. Here, a review of the status of this complex array of marine HAB problems in the U.S. is presented, providing historical information and trends as well as future perspectives. The study relies on thirty years (1990-2019) of data in HAEDAT - the IOC-ICES-PICES Harmful Algal Event database, but also includes many other reports. At a qualitative level, the U.S. national HAB problem is far more extensive than was the case decades ago, with more toxic species and toxins to monitor, as well as a larger range of impacted resources and areas affected. Quantitatively, no significant trend is seen for paralytic shellfish toxin (PST) events over the study interval, though there is clear evidence of the expansion of the problem into new regions and the emergence of a species that produces PSTs in Florida - Pyrodinium bahamense. Amnesic shellfish toxin (AST) events have significantly increased in the U.S., with an overall pattern of frequent outbreaks on the West Coast, emerging, recurring outbreaks on the East Coast, and sporadic incidents in the Gulf of Mexico. Despite the long historical record of neurotoxic shellfish toxin (NST) events, no significant trend is observed over the past 30 years. The recent emergence of diarrhetic shellfish toxins (DSTs) in the U.S. began along the Gulf Coast in 2008 and expanded to the West and East Coasts, though no significant trend through time is seen since then. Ciguatoxin (CTX) events caused by Gambierdiscus dinoflagellates have long impacted tropical and subtropical locations in the U.S., but due to a lack of monitoring programs as well as under-reporting of illnesses, data on these events are not available for time series analysis. Geographic expansion of Gambierdiscus into temperate and non-endemic areas (e.g., northern Gulf of Mexico) is apparent, and fostered by ocean warming. HAB-related marine wildlife morbidity and mortality events appear to be increasing, with statistically significant increasing trends observed in marine mammal poisonings caused by ASTs along the coast of California and NSTs in Florida. Since their first occurrence in 1985 in New York, brown tides resulting from high-density blooms of Aureococcus have spread south to Delaware, Maryland, and Virginia, while those caused by Aureoumbra have spread from the Gulf Coast to the east coast of Florida. Blooms of Margalefidinium polykrikoides occurred in four locations in the U.S. from 1921-2001 but have appeared in more than 15 U.S. estuaries since then, with ocean warming implicated as a causative factor. Numerous blooms of toxic cyanobacteria have been documented in all 50 U.S. states and the transport of cyanotoxins from freshwater systems into marine coastal waters is a recently identified and potentially significant threat to public and ecosystem health. Taken together, there is a significant increasing trend in all HAB events in HAEDAT over the 30-year study interval. Part of this observed HAB expansion simply reflects a better realization of the true or historic scale of the problem, long obscured by inadequate monitoring. Other contributing factors include the dispersion of species to new areas, the discovery of new HAB poisoning syndromes or impacts, and the stimulatory effects of human activities like nutrient pollution, aquaculture expansion, and ocean warming, among others. One result of this multifaceted expansion is that many regions of the U.S. now face a daunting diversity of species and toxins, representing a significant and growing challenge to resource managers and public health officials in terms of toxins, regions, and time intervals to monitor, and necessitating new approaches to monitoring and management. Mobilization of funding and resources for research, monitoring and management of HABs requires accurate information on the scale and nature of the national problem. HAEDAT and other databases can be of great value in this regard but efforts are needed to expand and sustain the collection of data regionally and nationally.
Keywords: Eutrophication; HAB; HAEDAT; Harmful algal bloom; Red tide; Time series.
Copyright © 2021 The Authors. Published by Elsevier B.V. All rights reserved.
Conflict of interest statement
Declaration of Interest Statement
Authors have no competing interest to declare. The data will not be published elsewhere in the same form in any language, including electronically without the written consent of the copyright holder if accepted.
Figures


Similar articles
-
Harmful algal blooms and their effects in coastal seas of Northern Europe.Harmful Algae. 2021 Feb;102:101989. doi: 10.1016/j.hal.2021.101989. Epub 2021 Mar 6. Harmful Algae. 2021. PMID: 33875185
-
Diversity and regional distribution of harmful algal events along the Atlantic margin of Europe.Harmful Algae. 2021 Feb;102:101976. doi: 10.1016/j.hal.2021.101976. Epub 2021 Feb 12. Harmful Algae. 2021. PMID: 33875184
-
Three decades of Canadian marine harmful algal events: Phytoplankton and phycotoxins of concern to human and ecosystem health.Harmful Algae. 2021 Feb;102:101852. doi: 10.1016/j.hal.2020.101852. Epub 2020 Jul 24. Harmful Algae. 2021. PMID: 33875179 Review.
-
The Latin America and Caribbean HAB status report based on OBIS and HAEDAT maps and databases.Harmful Algae. 2021 Feb;102:101920. doi: 10.1016/j.hal.2020.101920. Epub 2021 Jan 6. Harmful Algae. 2021. PMID: 33875182
-
Toxic marine microalgae and noxious blooms in the Mediterranean Sea: A contribution to the Global HAB Status Report.Harmful Algae. 2021 Feb;102:101843. doi: 10.1016/j.hal.2020.101843. Epub 2020 Jun 12. Harmful Algae. 2021. PMID: 33875177 Review.
Cited by
-
A Strategic Framework for Community Engagement in Oceans and Human Health.Community Sci. 2022 Jun;1(1):e2022CSJ000001. doi: 10.1029/2022csj000001. Epub 2022 Apr 14. Community Sci. 2022. PMID: 36186152 Free PMC article.
-
Marine Origin Ligands of Nicotinic Receptors: Low Molecular Compounds, Peptides and Proteins for Fundamental Research and Practical Applications.Biomolecules. 2022 Jan 23;12(2):189. doi: 10.3390/biom12020189. Biomolecules. 2022. PMID: 35204690 Free PMC article. Review.
-
Evaluating red tide effects on the West Florida Shelf using a spatiotemporal ecosystem modeling framework.Sci Rep. 2023 Feb 13;13(1):2541. doi: 10.1038/s41598-023-29327-z. Sci Rep. 2023. PMID: 36781942 Free PMC article.
-
Microcystin-LR in drinking water: An emerging role of mitochondrial-induced epigenetic modifications and possible mitigation strategies.Toxicol Rep. 2024 Sep 28;13:101745. doi: 10.1016/j.toxrep.2024.101745. eCollection 2024 Dec. Toxicol Rep. 2024. PMID: 39411183 Free PMC article. Review.
-
Is Living in a U.S. Coastal City Good for One's Health?Int J Environ Res Public Health. 2021 Aug 9;18(16):8399. doi: 10.3390/ijerph18168399. Int J Environ Res Public Health. 2021. PMID: 34444150 Free PMC article.
References
-
- Abbott GM, Landsberg JH, Reich AR, Steidinger KA, Ketchen S, Blackmore C, 2009. Resource guide for public health response to harmful algal blooms in Florida: Based on recommendations of the Florida Harmful Algal Bloom Task Force Public Health Technical Panel, Fish and Wildlife Research Institute Technical Report. Florida Fish and Wildlife Conservation Commission, Saint Petersburg, pp. 1–132.
-
- Abbott JP, Flewelling LJ, Landsberg JH, 2009. Saxitoxin monitoring in three species of Florida puffer fish. Harmful Algae 8, 343–348.
-
- Accoroni S, Totti C, Romagnoli T, Giulietti S, Glibert PM, 2020. Distribution and potential toxicity of benthic harmful dinoflagellates in waters of Florida Bay and the Florida Keys. Mar. Environ. Res. 155, 104891. - PubMed
-
- Amzil Z, Fresnel J, Le Gal D, Billard C, 2001. Domoic acid accumulation in French shellfish in relation to toxic species of Pseudo-nitzschia multiseries and P. pseudodelicatissima. Toxicon 39, 1245–1251. - PubMed
-
- Anderson DM, 1997. Bloom dynamics of toxic Alexandrium species in the northeastern United States. Limnol. Oceanogr. 42, 1009–1022.
Publication types
MeSH terms
Grants and funding
LinkOut - more resources
Full Text Sources
Other Literature Sources
Miscellaneous
