. 2021 Jun 17;65(7):e0001321.
doi: 10.1128/AAC.00013-21. Epub 2021 Jun 17.

Role of the SOS Response in the Generation of Antibiotic Resistance In Vivo

Affiliations

Role of the SOS Response in the Generation of Antibiotic Resistance In Vivo

John K Crane et al. Antimicrob Agents Chemother. .

Abstract

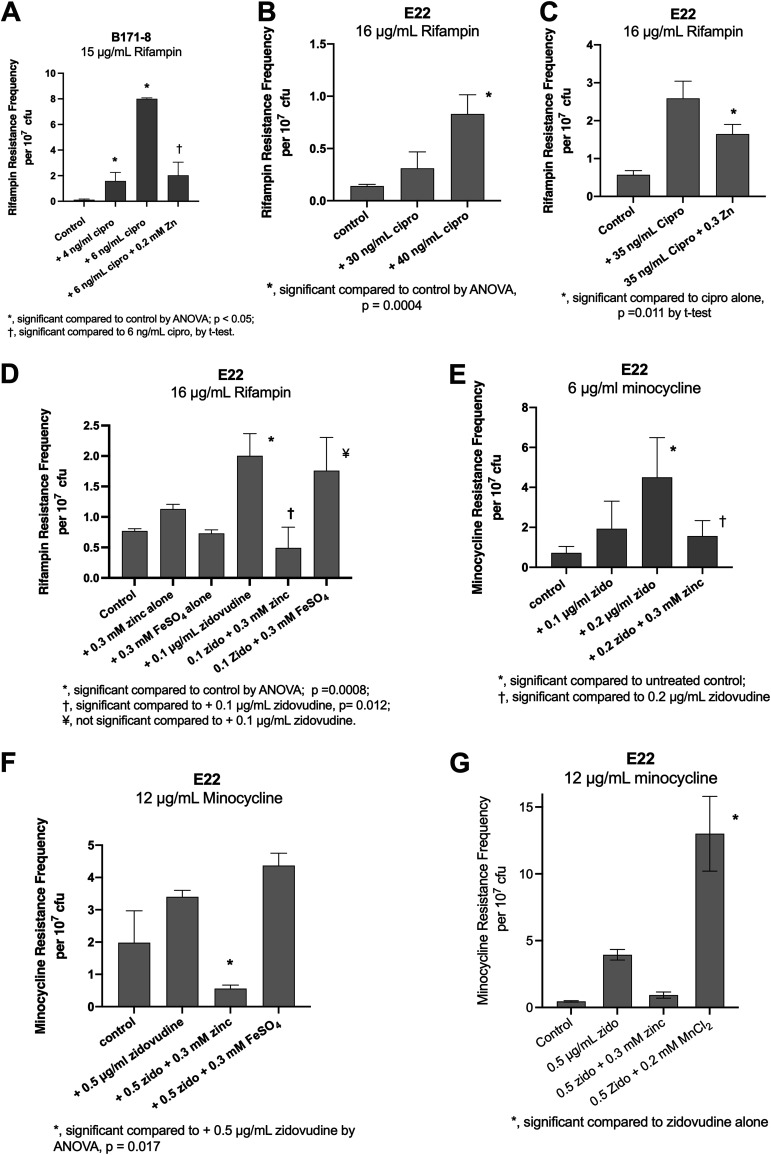
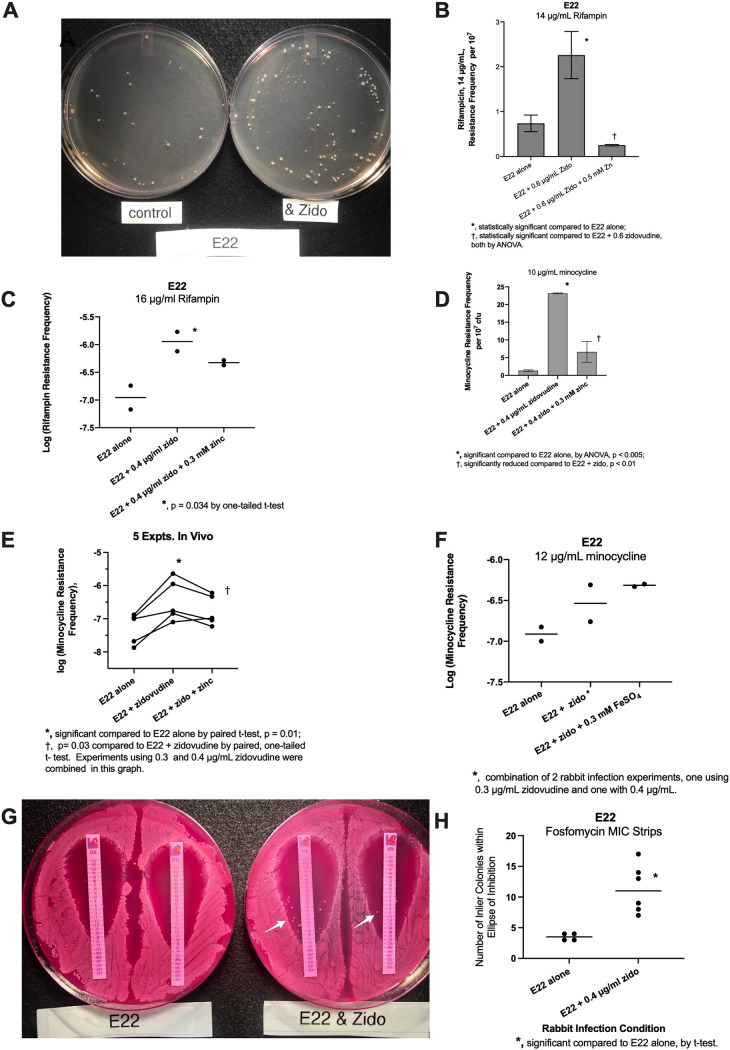
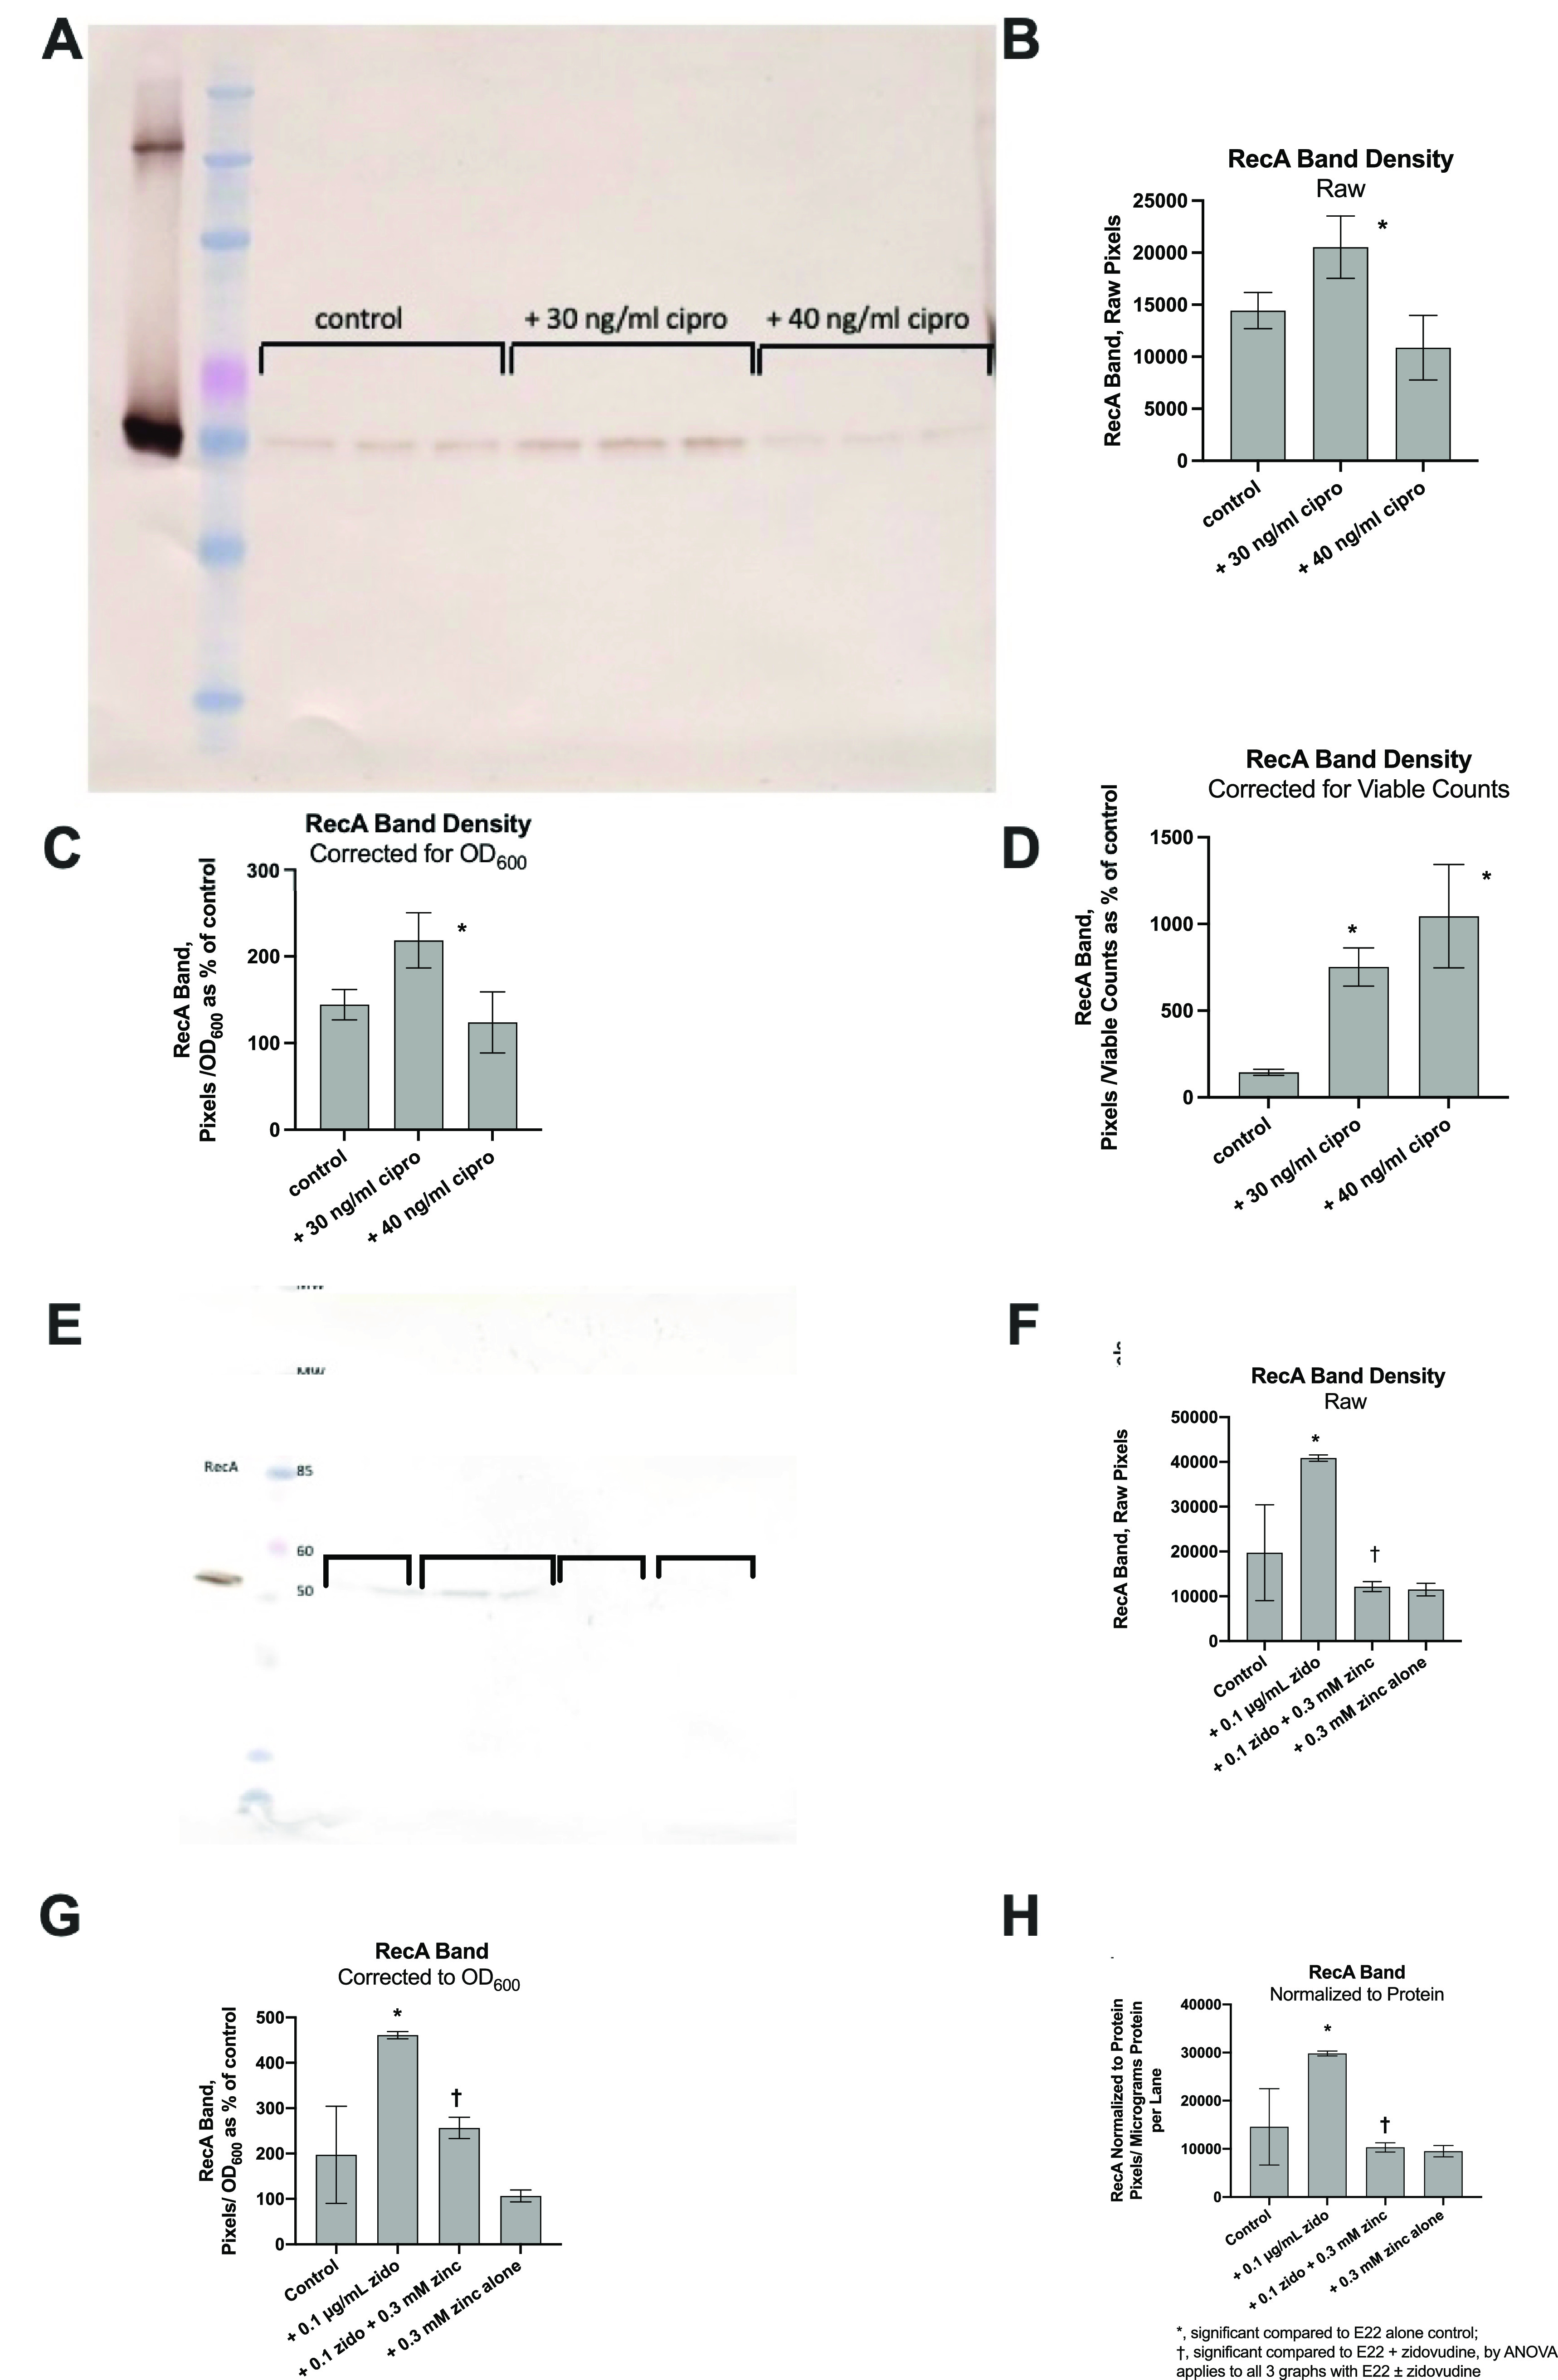
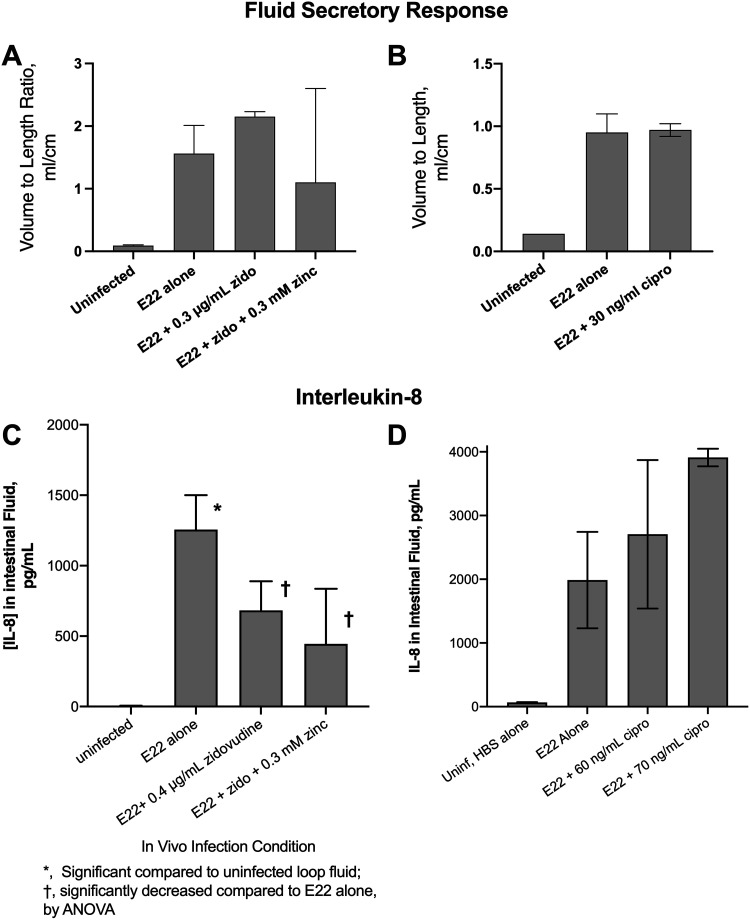
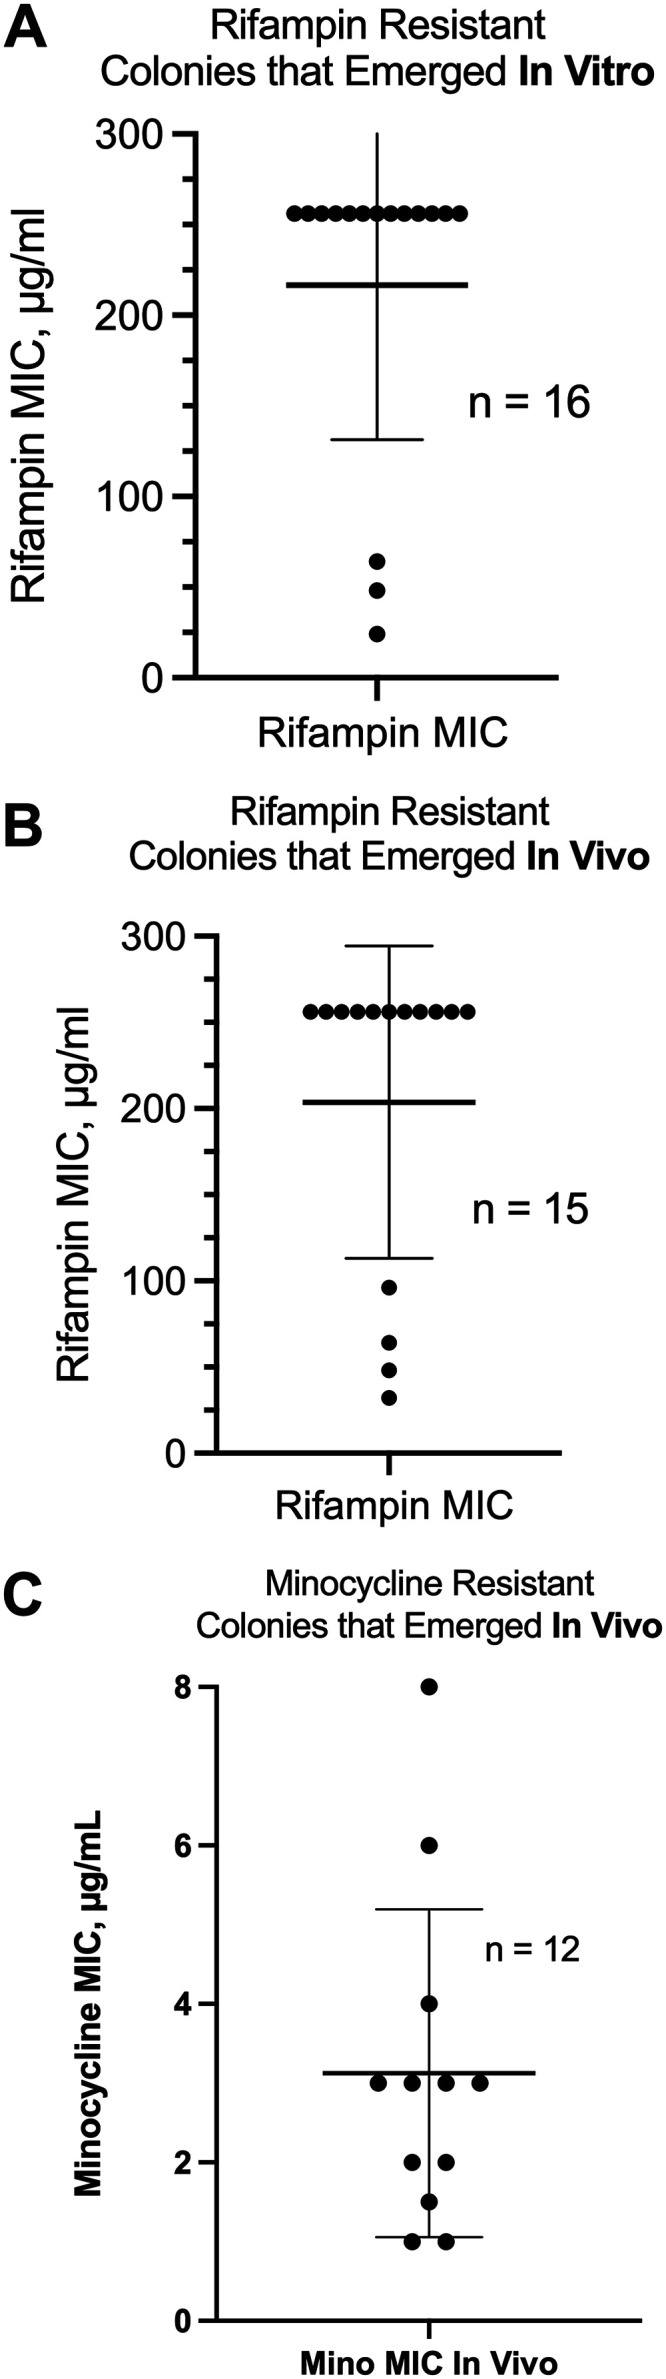
The SOS response to DNA damage is a conserved stress response in Gram-negative and Gram-positive bacteria. Although this pathway has been studied for years, its relevance is still not familiar to many working in the fields of clinical antibiotic resistance and stewardship. Under some conditions, the SOS response favors DNA repair and preserves the genetic integrity of the organism. On the other hand, the SOS response also includes induction of error-prone DNA polymerases, which can increase the rate of mutation, called the mutator phenotype or "hypermutation." As a result, mutations can occur in genes conferring antibiotic resistance, increasing the acquisition of resistance to antibiotics. Almost all of the work on the SOS response has been on bacteria exposed to stressors in vitro. In this study, we sought to quantitate the effects of SOS-inducing drugs in vivo, in comparison with the same drugs in vitro. We used a rabbit model of intestinal infection with enteropathogenic Escherichia coli strain E22. SOS-inducing drugs triggered the mutator phenotype response in vivo as well as in vitro. Exposure of E. coli strain E22 to ciprofloxacin or zidovudine, both of which induce the SOS response in vitro, resulted in increased antibiotic resistance to 3 antibiotics: rifampin, minocycline, and fosfomycin. Zinc was able to inhibit the SOS-induced emergence of antibiotic resistance in vivo, as previously observed in vitro. Our findings may have relevance in reducing the emergence of resistance to new antimicrobial drugs.

Keywords: RecA; enteropathogenic E. coli; fosfomycin; heteroresistance; hypermutation; minocycline; rabbit model; rifampin; zidovudine; zinc.


Figures

FIG 1
FIG 1
Effect of SOS inducers and inhibitors on hypermutation in vitro. Cultures of E. coli strains B171-8 and E22 grown overnight were subcultured into DMEM–F-12 broth medium and grown at 37°C with shaking at 300 rpm for 1.5 h, and the SOS-inducing drugs or metals were then added. The subcultures were collected at 4.5 h, and dilutions and plate counts were performed to measure total as well as antibiotic-resistant CFU per milliliter. Results are expressed as antibiotic resistance frequencies per 107 total CFU. Abbreviations: zido, zidovudine; cipro, ciprofloxacin; zinc, zinc acetate. The definitions of symbols used are indicated in each panel.
FIG 2
FIG 2
Effect of SOS inducers and inhibitors on hypermutation in vivo. Enteropathogenic E. coli (EPEC) strain E22, a rabbit-adapted strain, was used for the in vivo experiments. According to the procedures described in Materials and Methods, rabbits were subjected to a laparotomy, segments of the ileum were ligated, and two segments or “loops” were then injected with a narrow-gauge needle with 2 ml of an E22 bacterial suspension at 4 × 108 CFU/ml with or without inducers or inducers plus inhibitors. The surgical incisions were closed, and the rabbits were allowed to recover. After 20 h, the rabbits were euthanized, and loop fluid was collected for analysis. In panels C, E, and F, the results are shown using a logarithmic scale. In panel E, each line represents one rabbit, with duplicate loops subjected to each experimental condition. The paired t test was used to compare resistance frequencies in loops receiving E22 alone with those in loops receiving E22 plus the inducer (zidovudine) in the same rabbit. In panel G, the infected loop fluids were diluted 1:10, spread on MacConkey agar plates, and then overlaid with fosfomycin MIC strips to determine the MIC. White arrows indicate inlier colonies within the ellipses of inhibition. Panel H shows a comparison of the numbers of fosfomycin inlier colonies without and with zidovudine treatment in vivo.
FIG 3
FIG 3
Detection of E. coli RecA protein by Western immunoblot analysis in the supernatants of E22 bacteria in vitro. (A) The supernatant media from in vitro hypermutation experiments such as those shown in Fig. 1 were stored frozen and then subjected to SDS-gel electrophoresis, transferred to nitrocellulose, and blotted for RecA using a rabbit polyclonal Ab against E. coli RecA (Abcam). For detection, a 2nd antibody of goat anti-rabbit IgG conjugated to horseradish peroxidase (HRP) was used. The blot was developed with diaminobenzidine (DAB) as the substrate in the presence of hydrogen peroxide, which generates a brown color. Lanes from left to right are as follows: lane 1, purified E. coli RecA, ∼25 ng of protein; lane 2, Invitrogen BenchMark prestained molecular weight markers (the pink marker is 60 kDa, and the blue marker below it is 50 kDa, the apparent molecular weight of the RecA protein); lanes 3 to 5, supernatants from control E22 cultures; lanes 6 to 8, supernatants from E22 cells treated with 30 ng/ml ciprofloxacin; lanes 9 to 11, supernatants from E22 cells treated with 40 ng/ml ciprofloxacin. (B to D) Analysis of the RecA band density subjected to various mathematical corrections. (B) Raw RecA density, without any corrections; (C) RecA band corrected by the culture turbidity (OD600) of the original cultures; (D) RecA band corrected based on viable E22 bacterial counts. (E) Immunoblot analysis of RecA on E22 supernatants treated with zidovudine with or without zinc in vivo. Lane 1 again shows purified RecA protein, and lane 2 shows molecular weight (MW) markers. Equal volumes of experimental samples were run in duplicate and were, from left to right, E22 alone; E22 plus 0.1 μg/ml zidovudine; E22, zidovudine, and 0.3 mM zinc; and 0.3 mM zinc alone, as shown by the brackets. The concentration of bacterial protein loaded per lane was 1.4 μg for the untreated, control lanes. (F) RecA band density, in pixels, without any mathematical correction. (G and H) Amounts of RecA adjusted for the OD600 (G) and for the bacterial supernatant protein (H). The * and † symbols apply similarly in panels F to H.
FIG 4
FIG 4
Host responses to E22 infection in vivo. (A and B) Volume-to-length ratios, an indicator of the amount of fluid secreted into the intestinal lumen, using zidovudine (A) and ciprofloxacin (B) as SOS inducers. (C and D) Interleukin-8 (IL-8) levels in the loop fluids were measured using an EIA for rabbit IL-8, again using zidovudine (C) and ciprofloxacin (D) as inducers of the SOS response. HBS, HEPES-buffered saline.
FIG 5
FIG 5
MICs of the antibiotic-resistant colonies that emerged from treatment with SOS inducers in vitro and in vivo. We collected 2 antibiotic-resistant colonies from the rifampin plates or minocycline plates from E22 cells exposed to zidovudine in vitro or in vivo and archived them at −70°C. After passaging in antibiotic-free LB broth, they were retested for rifampin or minocycline resistance using Liofilchem MIC strips. (A) Rifampin MIC scattergram of 16 colonies collected from 8 separate in vitro experiments. (B) Rifampin MIC scattergram of 15 colonies obtained from 7 separate rabbit experiments. The rifampin MIC of the E22 parental strain is 2.5 μg/ml (Table 1). (C) Minocycline MIC scattergram from minocycline-resistant colonies that emerged on LB medium with 12 μg/ml minocycline in vivo. (The minocycline MIC scattergram from in vitro experiments showed results similar to those in panel C and is not shown.)
FIG 6
FIG 6
Fluorescence micrographs showing the formation of neutrophilic extracellular traps (NETs) in vivo in loop fluid from rabbits infected with E22. (A) Loop fluid from rabbit ileum infected in vivo for 20 h with EPEC strain E22 was subjected to low-speed centrifugation (21 × g for 5 min) onto glass microscope slides in a cytological “cytospin” centrifuge using Shandon centrifuge funnels. After fixation in alcohol-acetone, the glass slides were dried on a warmer plate and then stained for DNA with 10 μg/ml propidium iodide. An example of a DNA NET is indicated by the black arrow. E22 bacteria grow as short coccobacilli when in contact with host tissues and stain red or pink, often adhering to the DNA NETs. Host cells, mostly heterophils, the rabbit equivalent of neutrophils, also stain with propidium iodide (red arrow). The size bar is at the bottom right. The photograph was taken at a ×600 magnification under oil immersion. (B) Loop fluid from rabbit ileum was mixed with a fluorescently labeled, green fluorescent protein (GFP)-expressing laboratory strain of E. coli, DH5α-(pGFP), and allowed to incubate for 20 min at 37°C. The mixture was again applied to the funnels of a cytological centrifuge and spun onto glass slides as described above for panel A. After fixation and drying, the slides were again stained with propidium iodide. Panel B shows that the laboratory strain DH5α-(pGFP) becomes enmeshed in the DNA NETs along with the pathogenic strain E22. E22 bacteria, stained red by propidium iodide, are short, about 2 μm in length, and are indicated by the black arrow. The DH5α-(pGFP) bacteria fluoresce bright green and are about 4 μm in length. Diffuse pink background staining represents extracellular DNA. The main photograph in panel B is again at a ×600 magnification under oil immersion. The inset photographs, taken at a ×1,000 magnification, show red E22 bacteria (red arrows) in close contact with green-fluorescing DH5α bacteria (green arrows), and the size bar in the top left inset, 8 μm, applies to the top right inset photograph as well. The proximity of the two different bacterial strains, trapped together in DNA NETs, could facilitate the horizontal transfer of antibiotic resistance genes via conjugation or transformation.

Similar articles

Cited by

References

    1. Sutton MD, Walker GC. 2001. umuDC-mediated cold sensitivity is a manifestation of functions of the UmuD2C complex involved in a DNA damage checkpoint control. J Bacteriol 183:1215–1224. 10.1128/JB.183.4.1215-1224.2001. - DOI - PMC - PubMed
    1. Goodman MF. 2016. Better living with hyper‐mutation. Environ Mol Mutagen 57:421–434. 10.1002/em.22023. - DOI - PMC - PubMed
    1. Pérez-Capilla T, Baquero M-R, Gómez-Gómez J-M, Ionel A, Martín S, Blázquez J. 2005. SOS-independent induction of dinB transcription by β-lactam-mediated inhibition of cell wall synthesis in Escherichia coli. J Bacteriol 187:1515–1518. 10.1128/JB.187.4.1515-1518.2005. - DOI - PMC - PubMed
    1. Sanders LH, Rockel A, Lu H, Wozniak DJ, Sutton MD. 2006. Role of Pseudomonas aeruginosa dinB-encoded DNA polymerase IV in mutagenesis. J Bacteriol 188:8573–8585. 10.1128/JB.01481-06. - DOI - PMC - PubMed
    1. Maslowska KH, Makiela-Dzbenska K, Fijalkowska IJ. 2019. The SOS system: a complex and tightly regulated response to DNA damage. Environ Mol Mutagen 60:368–384. 10.1002/em.22267. - DOI - PMC - PubMed

Publication types

LinkOut - more resources