. 2021 Jun;31(6):958-967.
doi: 10.1101/gr.267781.120. Epub 2021 Apr 19.

Identification and characterization of centromeric sequences in Xenopus laevis

Affiliations

Identification and characterization of centromeric sequences in Xenopus laevis

Owen K Smith et al. Genome Res. 2021 Jun.

Abstract

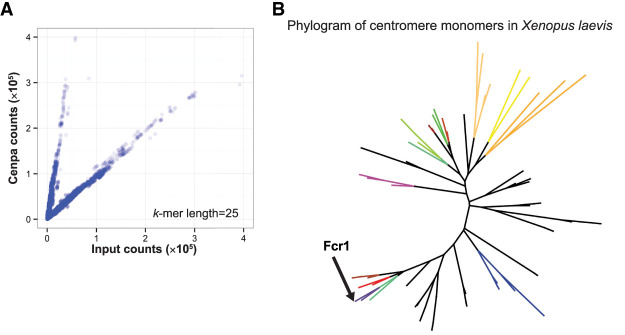
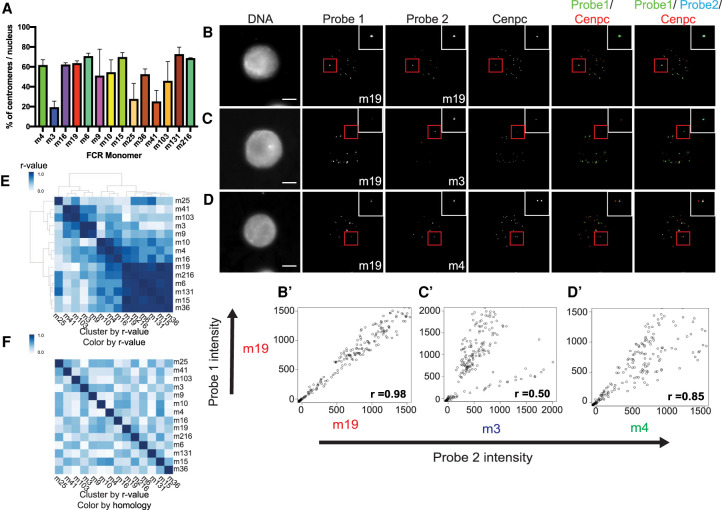
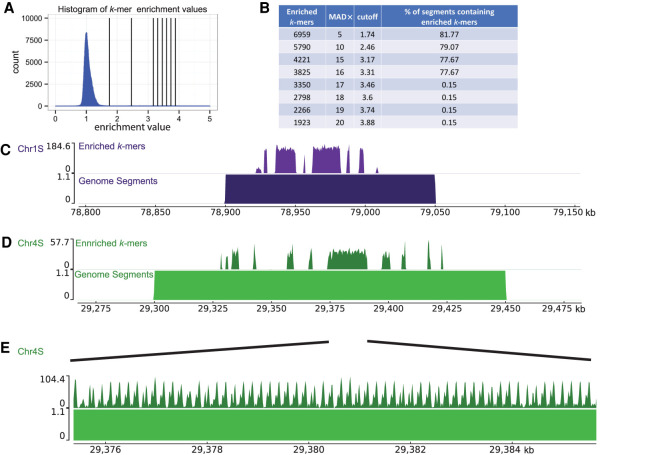
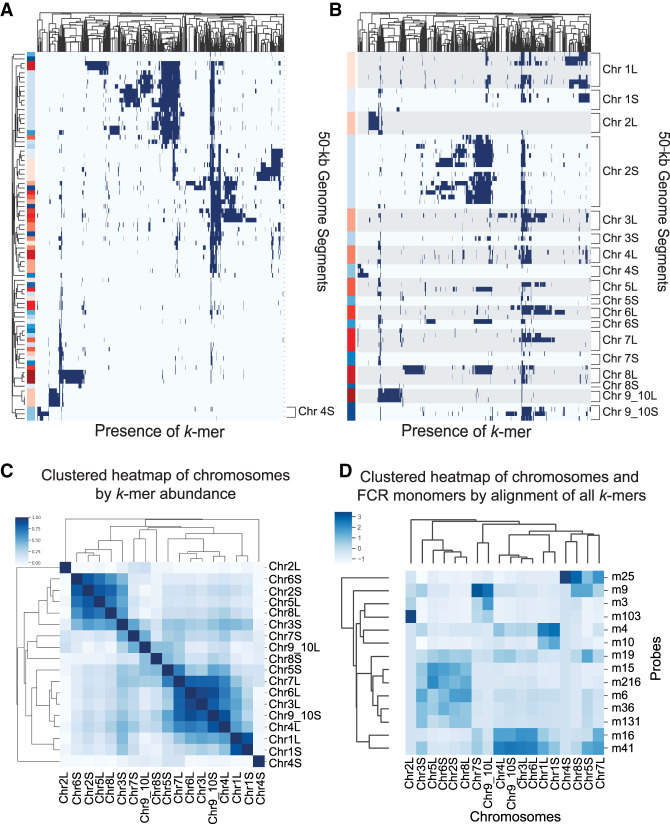
Centromeres play an essential function in cell division by specifying the site of kinetochore formation on each chromosome for mitotic spindle attachment. Centromeres are defined epigenetically by the histone H3 variant Centromere Protein A (Cenpa). Cenpa nucleosomes maintain the centromere by designating the site for new Cenpa assembly after dilution by replication. Vertebrate centromeres assemble on tandem arrays of repetitive sequences, but the function of repeat DNA in centromere formation has been challenging to dissect due to the difficulty in manipulating centromeres in cells. Xenopus laevis egg extracts assemble centromeres in vitro, providing a system for studying centromeric DNA functions. However, centromeric sequences in Xenopus laevis have not been extensively characterized. In this study, we combine Cenpa ChIP-seq with a k-mer based analysis approach to identify the Xenopus laevis centromere repeat sequences. By in situ hybridization, we show that Xenopus laevis centromeres contain diverse repeat sequences, and we map the centromere position on each Xenopus laevis chromosome using the distribution of centromere-enriched k-mers. Our identification of Xenopus laevis centromere sequences enables previously unapproachable centromere genomic studies. Our approach should be broadly applicable for the analysis of centromere and other repetitive sequences in any organism.


Figures

Figure 1.
Figure 1.
Identification of Cenpa-associated sequences by k-mer analysis. (A) Scatterplot of 25-bp k-mer counts normalized to sequencing depth found in input and Cenpa ChIP-seq libraries. (B) Phylogram of representative Cenpa-associated sequences that contained a minimum of 80 enriched 25-bp k-mers identified as most abundant after clustering by sequence similarity. FCR monomers chosen for FISH experiments are colored and Fcr1 identified by Edwards and Murray (2005) is labeled.
Figure 2.
Figure 2.
FCR monomers exhibit distinct centromeric localization independent of sequence similarity. (A) Bar plot of the percentage of centromeres per nucleus that are positive for a given FCR monomer. Bar color corresponds to color on phylogram. Averages of two independent experiments are shown with standard error displayed. (BD) Maximum projection images of two-color FISH with immunofluorescence for the centromere marker, Cenpc. (B) FCR monomer 19 versus FCR monomer 19, (C) FCR monomer 19 versus FCR monomer 3, (D) FCR monomer 19 versus FCR monomer 4. Scale bar, 10 µM. (B′,C′,D′) Scatterplots of background subtracted probe intensities for each centromere from two-color FISH experiments. Pearson coefficients are displayed in the bottom right corner. (E) Clustered heat map of FCR monomer Pearson correlation to other FCR monomers as determined by two-color FISH. (F) Heat map ordered based on FISH Pearson correlation clustering; color map displays sequence similarity between FCR monomers.
Figure 3.
Figure 3.
Identification of centromeres on Xenopus laevis chromosomes. (A) Histogram of centromere enrichment scores for 25-bp k-mers. Enrichment scores are the ratio of normalized k-mer counts for the Cenpa data set over the input data set. Vertical lines display stringency cutoffs of (1, 2, 5, 10, 15, and 20) median absolute deviations away from the median enrichment value. (B) Table displaying the number of enriched 25-bp k-mers, the median absolute deviations (MAD×) away from the median used as the cutoff value, the enrichment value cutoff, and the percentage of genome segments containing an enriched k-mer. (CE) Representative genome browser images with aligned enriched k-mers (top) and aligned genome segments (bottom). E is a zoom-in on a region in D.
Figure 4.
Figure 4.
Assignment of FCR monomers to chromosomes by k-mer content. (A) Clustered heat map showing the presence (blue) or absence (white) of individual enriched k-mers on each centromeric genome segment. Both rows and columns are clustered to show k-mers and segments that display similar distributions. Genome segments, on the y-axis, are labeled on the left side indicating the L subgenome (blue), S subgenome (red). (B) Similar to A, but the genome segments, y-axis, are not ordered based on similar k-mer content and are instead listed by chromosome. L subgenome chromosomes are shaded with gray for clarity. (C) Clustered heat map of chromosomes by abundance of Cenpa-enriched k-mers. By combining 50-kb genome segments from each chromosome, an array of counts for each k-mer was used to generate a Euclidean distance between chromosomes used for clustering. Coloring of heat map is (1 − Euclidean distance). (D) Clustered heat map of counts reported from Bowtie of the number of times any k-mer from each FCR monomer aligns to each chromosomal contig.

References

    1. Akiyoshi B, Sarangapani KK, Powers AF, Nelson CR, Reichow SL, Arellano-Santoyo H, Gonen T, Ranish JA, Asbury CL, Biggins S. 2010. Tension directly stabilizes reconstituted kinetochore-microtubule attachments. Nature 468: 576–579. 10.1038/nature09594 - DOI - PMC - PubMed
    1. Benson G. 1999. Tandem repeats finder: a program to analyze DNA sequences. Nucleic Acids Res 27: 573–580. 10.1093/nar/27.2.573 - DOI - PMC - PubMed
    1. Desai A, Deacon HW, Walczak CE, Mitchison TJ. 1997. A method that allows the assembly of kinetochore components onto chromosomes condensed in clarified Xenopus egg extracts. Proc Natl Acad Sci 94: 12378–12383. 10.1073/pnas.94.23.12378 - DOI - PMC - PubMed
    1. Edwards NS, Murray AW. 2005. Identification of Xenopus CENP-A and an associated centromeric DNA repeat. Mol Biol Cell 16: 1800–1810. 10.1091/mbc.e04-09-0788 - DOI - PMC - PubMed
    1. Foley EA, Kapoor TM. 2013. Microtubule attachment and spindle assembly checkpoint signalling at the kinetochore. Nat Rev Mol Cell Biol 14: 25–37. 10.1038/nrm3494 - DOI - PMC - PubMed

Publication types