. 2021 Jun 23;41(7):e0004721.
doi: 10.1128/MCB.00047-21. Epub 2021 Jun 23.

YAF2-Mediated YY1-Sirtuin6 Interactions Responsible for Mitochondrial Downregulation in Aging Tunicates

Affiliations

YAF2-Mediated YY1-Sirtuin6 Interactions Responsible for Mitochondrial Downregulation in Aging Tunicates

Kaz Kawamura et al. Mol Cell Biol. .

Abstract

In budding tunicates, aging accompanies a decrease in the gene expression of mitochondrial transcription factor A (Tfam), and the in vivo transfection of Tfam mRNA stimulates the mitochondrial respiratory activity of aged animals. The gene expression of both the transcriptional repressor Yin-Yang-1 (YY1) and corepressor Sirtuin6 (Sirt6) increased during aging, and the cotransfection of synthetic mRNA of YY1 and Sirt6 synergistically downregulated Tfam gene expression. Pulldown assays of proteins indicated that YY1-associated factor 2 (YAF2) was associated with both YY1 and SIRT6. Protein cross-linking confirmed that YAF2 bound YY1 and SIRT6 with a molar ratio of 1:1. YY1 was bound to CCAT- or ACAT-containing oligonucleotides in the 5' flanking region of the Tfam gene. Chromatin immunoprecipitation-quantitative PCR (ChIP-qPCR) showed that SIRT6 specifically induced the histone H3 lysine 9 (H3K9) deacetylation of the Tfam upstream region. YY1 and YAF2 accelerated SIRT6-induced H3K9 deacetylation. YY1 and Sirt6 mRNA transfection attenuated mitochondrial respiratory gene expression and blocked MitoTracker fluorescence. In contrast, the SIRT6 inhibitor and Tfam mRNA antagonized the inhibitory effects of YY1 and Sirt6, indicating that Tfam acts on mitochondria downstream of YY1 and Sirt6. We concluded that in the budding tunicate Polyandrocarpa misakiensis, YY1 recruits SIRT6 via YAF2 to the TFAM gene, resulting in aging-related mitochondrial downregulation.

Keywords: Tfam; ascidian; budding; epigenetics; gel shift assay; senescence.


Figures
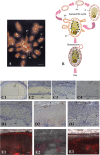
FIG 1
FIG 1
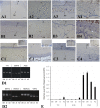
PmTfam gene expression and mitochondrial activity during budding and aging in P. misakiensis. (A) Clonal zooids and buds, dorsal view. Scale bar, 0.5 mm. (B) Schematic illustration of budding, bud development, and aging. (C) ISH of PmTfam during aging. (C1) Growing bud, transverse section. Scale bar, 100 μm. (C2) Dorsal area of growing bud. Scale bar, 20 μm. (C3) Dorsal area of juvenile zooid. Scale bar, 20 μm. (C4) Dorsal area of adult zooid. Scale bar, 20 μm. (D) ISH of PmCox1. Scale bars, 20 μm. (D1) Growing bud. (D2) Adult zooid. (D3) Adult zooid transfected with PmTfam mRNA. (E) MitoTracker staining. (E1) Growing bud. Scale bar, 40 μm. (E2) Adult zooid. Scale bar, 40 μm. (E3) Adult zooid transfected with PmTfam mRNA. Scale bar, 20 μm. ae, atrial epithelium; az, adult zooid; c, coelomic cell; db, developing bud; e, epidermis; gb, growing bud; jz, juvenile zooid.
FIG 2
FIG 2
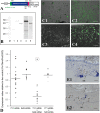
Aging-related gene expression in P. misakiensis. (A to C) ISH. (A) PmYY1. (B) PmSirt6. (C) PmYaf2. (A1, B1, and C1) Growing buds. (A2, B2, and C2) Developing buds. (A3, B3, and C3) Juvenile zooids. (A4, B4, and C4) Adult zooids. Scale bars in A1 and B1, 100 μm. Scale bar in B4, 40 μm. Other bars, 20 μm. Insets in panels C1 to C4 show lower magnification of buds and zooids. Tissues encircled by squares are enlarged. (D) RT-PCR of genes in growing buds (GB), juvenile zooids (JZ), and adult zooids (AZ). (D1) PmYY1 and PmSirt6 upregulated at the aging stage and beta-actin as an internal reference sample. (D2) PmSirt2, PmHDAC1, PmHDAC3, and PmYaf2 are not upregulated at the aging stage. (E) RT-qPCR of PmYY1, PmSirt6, and PmYaf2. DB shows 2-day-developing buds. Longitudinal bars show standard deviation. ae, atrial epithelium; e, epidermis.
FIG 3
FIG 3
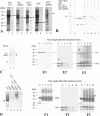
Effects of synthetic PmYY1 and PmSirt6 mRNA transfection on PmTfam gene expression. (A) Chimeric cDNA consisting of the 5′ UTR of PmRACK1 gene (19) and the ORFs of GFP, PmYY1, or PmSirt6. (B) In vitro translation of synthetic mRNAs. Lane 1, GFP. Lane 2, YY1. Lane 3, SIRT6. Proteins were stained with anti-Myc-tag antibody. Lane 4, Bacterial recombinant YY1. CBB staining. Lane 5, Bacterial recombinant SIRT6. CBB staining. (C) Transfection efficiency of GFP mRNA. RNA was introduced into zooid pieces, and the next day, coelomic cells were smeared and observed by confocal microscopy. Scale bars, 100 μm. (C1 and C2) Lipofection. (C3 and C4) Electroporation. (C1 and C3) Control without mRNA. (C2 and C4) Experiment with mRNA. (D) Effects of PmYY1 and PmSirt6 mRNA transfection and synergistic effects of YY1-Sirt6 and YY1-Yaf2 on PmTfam gene expression. Results of real-time PCR are shown. Horizontal bars show average values. Broken circle shows an exceptional result. (E) Results of ISH of PmTfam. Scale bars, 20 μm. (E1) Control without mRNA. (E2) Experiment cotransfected with PmYY1 and PmSirt6 mRNAs. ae, atrial epithelium; c, coelomic cell; e, epidermis.
FIG 4
FIG 4
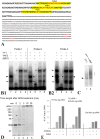
Pulldown and cross-linking assays of protein-protein interactions. (A) Crude extracts and purification of YY1, SIRT6, YAF2, and GFP (arrowheads). (B) Glutathione affinity chromatography and anti-His-tag immunostaining of proteins interacting with GST-YAF2. Asterisk shows a degradation product. (C) Pulldown assay of EDTA-sensitive protein interactions. Arrowhead shows the decreasing amount of PmSIRT6 in the eluate. (D) Native PAGE of proteins prestained with 0.006% CBB-G250. Arrowhead shows a major band of YY1. The bracket (lane 4) shows a smear band shifted upward by adding YAF2 to YY1. (E) SDS-PAGE and anti-His-tag immunostaining of YY1 and YAF2 in the presence of a cross-linker, BS3. (E1) YY1. No homophilic bindings were found. (E2) YAF2. Arrowhead shows a band(s) appearing temporally. (E3) YY1 mixed with YAF2. Arrowheads show bands shifted upward. (F) SDS-PAGE and anti-His-tag immunostaining of SIRT6 and YAF2 in the presence of BS3. (F1) PmSIRT6. (F2) PmYAF2. (F3) SIRT6 mixed with YAF2. Asterisk in panel F1 shows the degradation product of PmSIRT6. Arrowhead in panel F3 shows a de novo band that appears after the protein mixture and cross-linking.
FIG 5
FIG 5
Protein-DNA binding by gel shift assay of 32P-labeled PmTfam gene oligonucleotides and by chromatin immunoprecipitation. (A) The 5′ upstream sequence (1.5 kb) of PmTfam gene. Possible YY1-binding motifs are shown by red letters. Bold letters (200 nucleotides long) (territory 1) have 3 binding motifs. Probes 1, 2, and 3 (30 nt) containing each motif are highlighted. (B) Gel shift assay. (B1) Probes 1 and 2 mixed with YY1, YAF2, and SIRT6. (B2) Probe 3 mixed with the proteins. Black arrowheads (lanes 1 and 5) show a major band in the presence of YY1, and gray arrowheads show a band shifted upward by adding YAF2 to the YY1-oligonucleotide mixture. Arrows show a minor band probably derived from a degradation product of YY1. (C) Blue native PAGE of YY1-oligonucleotide (probe 3) mixture. Arrowhead in lane 1 shows a major band of YY1. The bracket in lane 2 shows the YY1-oligonucleotide (probe 3) mixture giving rise to smear staining at the upper position. (D) YY1 (black arrowhead) cross-linked with oligonucleotide by SPB. Gray arrowhead shows a transient band shifted upward. (E) ChIP-qPCR of Myc-tagged proteins in territory 1 at the 5′ upstream region of PmTfam gene. Juvenile zooids were transfected with mRNA having a Myc tag sequence. After 2 days, the chromatin was extracted and immunoprecipitated by anti-Myc-tag antibody. Each experiment was repeated twice, and the mean values are shown.
FIG 6
FIG 6
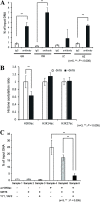
Histone H3K9 deacetylase activity of PmSIRT6 in collaboration with PmYY1 and PmYAF2. (A) ChIP-qPCR of histone H3K9ac in territory 1 of PmTfam gene in the asexual zooidal life from growing buds (GB) and developing buds (DB) to juvenile zooids (JZ) and adult zooids (AZ). (B) Specificity of PmSIRT6 on histone H3K9 deacetylation in territory 1. PmSirt6 mRNA was introduced in vivo into buds. ChIP data using anti-H3K9ac antibody was compared with those using anti-H3K14ac antibody and anti-H3K27ac antibody. (C) Synergistic effects of SIRT6 protein with YY1 and YAF2 on histone H3K9 deacetylation. Nuclear extracts were treated in vitro with proteins and immunoprecipitated using anti-H3K9ac antibody. The results are expressed as the mean ± standard deviations. n, number of biological replicates. P values were calculated by two-tailed Student's t test.
FIG 7
FIG 7
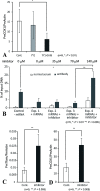
Effects of PmSirt6 and PmYY1 mRNA cotransfection and SIRT6 inhibitor on mitochondrial activity. (A) PmCox1 expression in juvenile zooids treated with mRNAs. (B) Effects of SIRT6 inhibitor on PmTfam gene acetylation in the presence of PmYY1 and PmSirt6 mRNAs. (C) Effect of SIRT6 inhibitor on PmTfam gene expression. (D) Effect of SIRT6 inhibitor on PmCox1 gene expression. The results are expressed as the mean ± standard deviations. n, number of biological replicates. P values were calculated by two-tailed Student's t test.
FIG 8
FIG 8
In vitro MitoTracker staining of coelomic cells harvested from juvenile zooids after mRNA transfection and SIRT6 inhibitor treatment. Scale bars, 20 μm. (A) Control without mRNA transfection. (B) Experiment transfected with both PmYY1 and PmSirt6 mRNAs. (C) Cotransfection of PmYY1, PmSirt6, and PmTfam mRNAs. (D) PmYY1 and PmSirt6 mRNA cotransfection in the presence of SIRT6 inhibitor. (A1, B1, C1, and D1) Bright field microscopy merged with fluorescence confocal microscopy. (A2, B2, C2, and D2) Fluorescence confocal microscopy.
FIG 9
FIG 9
Involvement of YY1, YAF2, and SIRT6 in the mitochondrial function during aging in P. misakiensis. During zooidal aging, YAF2 binds to increasing amount of YY1 and to SIRT6 in a zinc-dependent manner. As YAF2 appears to form the homophilic multimer, it would associate YY1 with SIRT6. Consequently, YY1 recruits PmSIRT6 to the 5′ upstream region of PmTfam. Histone H3K9 is deacetylated there, and PmTfam and mitochondrial gene activities are downregulated during aging. The mitochondrial downregulation does not always bring about disadvantage. In P. misakiensis, aging accompanies the downregulation of ROS scavenger. Therefore, the mitochondrial downregulation may contribute to the protection of cells from nuclear damages.

Similar articles

Cited by

References

    1. Alberts B, Johnson A, Lewis J, Raff M, Roberts K, Walter P. 2014. Molecular biology of the cell, 6th ed. Garland Science Taylor and Francis Group, New York, NY.
    1. Short KR, Bigelow ML, Kahl J, Singh R, Coenen-Schimke J, Raghavakaimal S, Nair KS. 2005. Decline in skeletal muscle mitochondrial function with aging in humans. Proc Natl Acad Sci U S A 102:5618–5623. 10.1073/pnas.0501559102. - DOI - PMC - PubMed
    1. Hebert SL, Lanza IR, Nair KS. 2010. Mitochondrial DNA alterations and reduced mitochondrial function in aging. Mech Ageing Dev 131:451–462. 10.1016/j.mad.2010.03.007. - DOI - PMC - PubMed
    1. Sun N, Youle RJ, Finkel T. 2016. The mitochondrial basis of aging. Mol Cell 61:654–666. 10.1016/j.molcel.2016.01.028. - DOI - PMC - PubMed
    1. Balaban RS, Nemoto S, Finkel T. 2005. Mitochondria, oxidants, and aging. Cell 120:483–495. 10.1016/j.cell.2005.02.001. - DOI - PubMed

Publication types

MeSH terms

Substances

LinkOut - more resources