. 2021 Apr 27;118(17):e2019798118.
doi: 10.1073/pnas.2019798118.

Homeostatic regulation of T follicular helper and antibody response to particle antigens by IL-1Ra of medullary sinus macrophage origin

Affiliations

Homeostatic regulation of T follicular helper and antibody response to particle antigens by IL-1Ra of medullary sinus macrophage origin

Xinwen Lin et al. Proc Natl Acad Sci U S A. .

Abstract

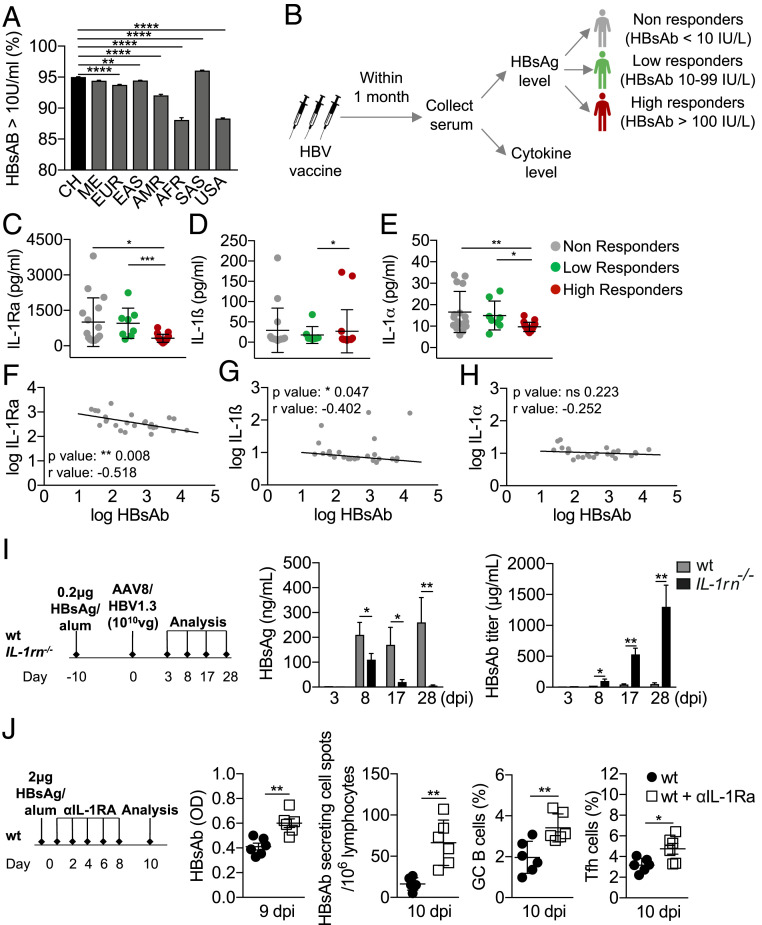
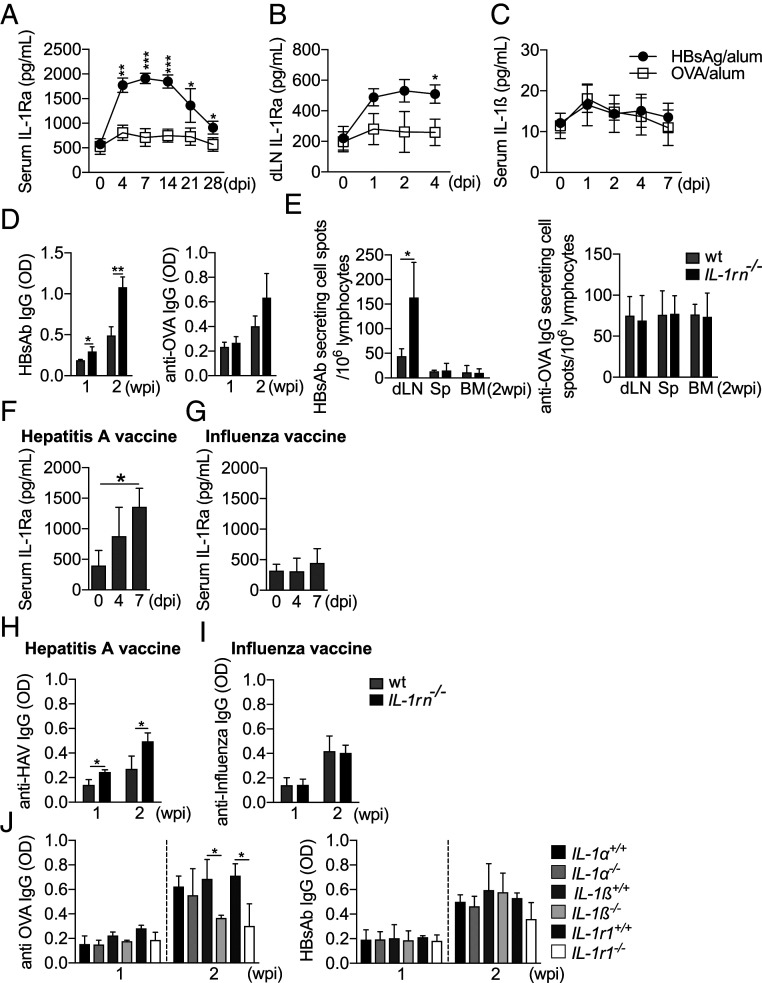
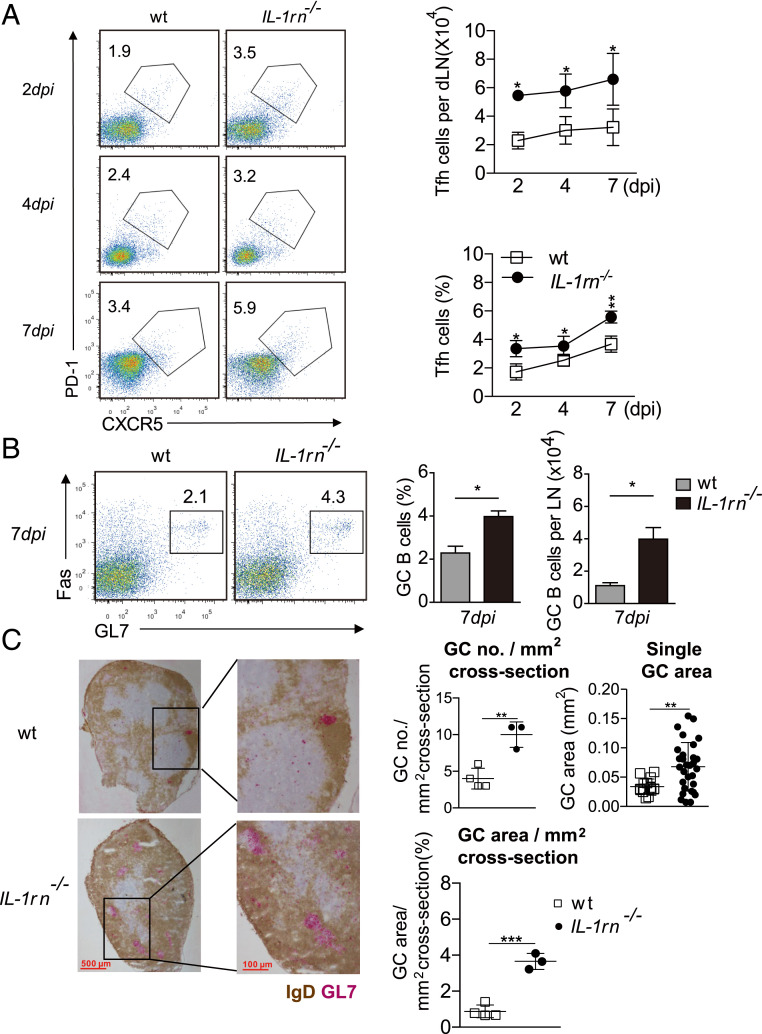
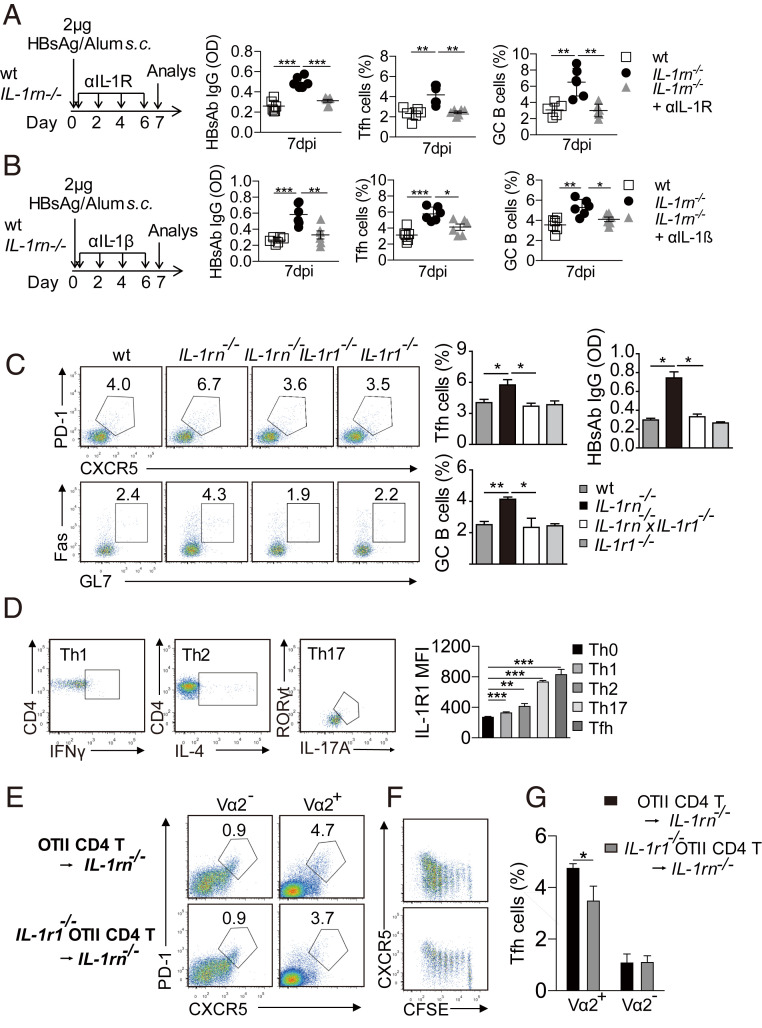
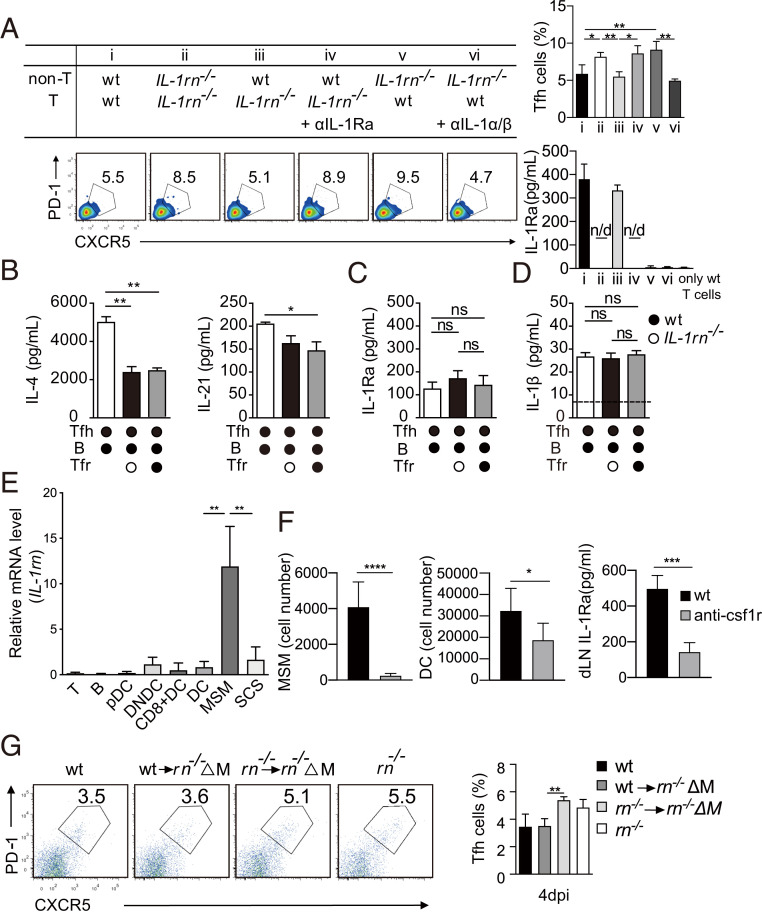
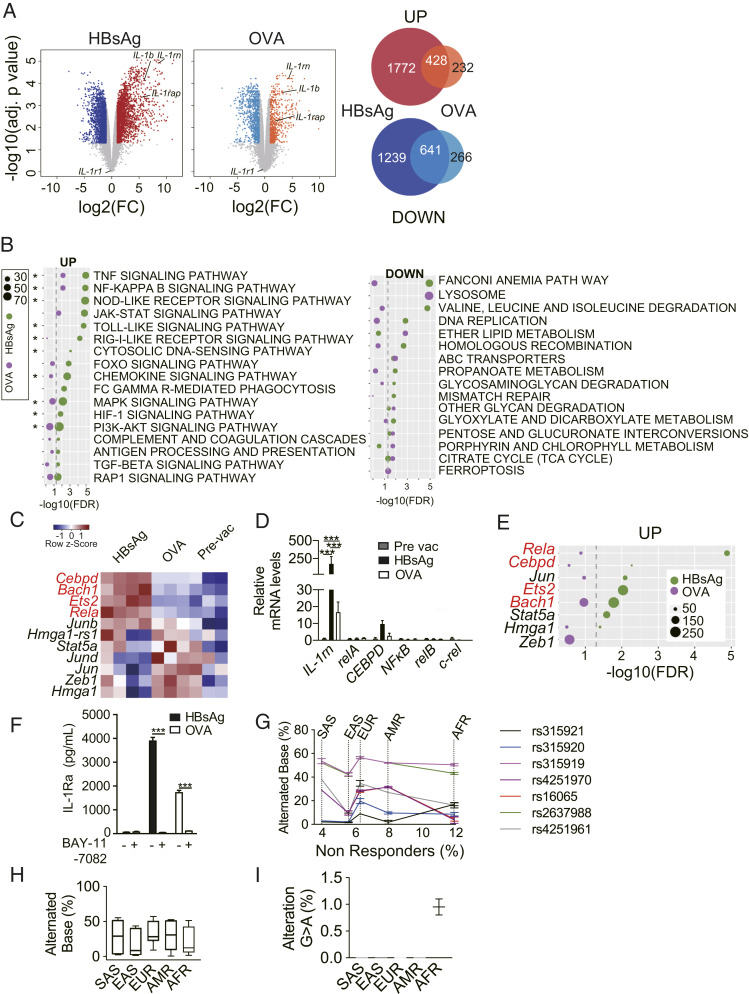
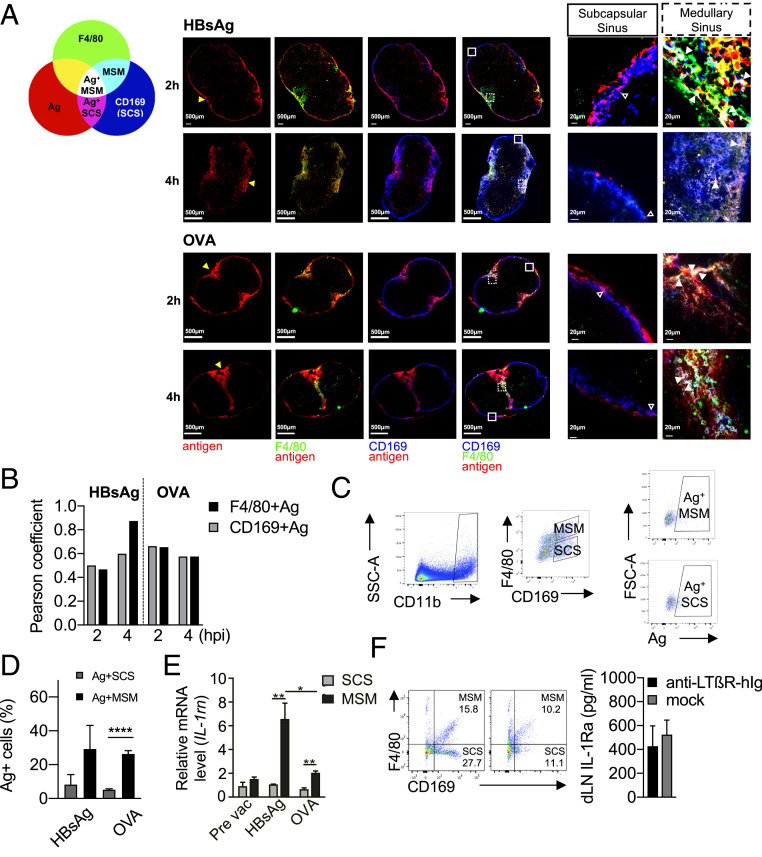
Hepatitis B virus (HBV) vaccines are composed of surface antigen HBsAg that spontaneously assembles into subviral particles. Factors that impede its humoral immunity in 5% to 10% of vaccinees remain elusive. Here, we showed that the low-level interleukin-1 receptor antagonist (IL-1Ra) can predict antibody protection both in mice and humans. Mechanistically, murine IL-1Ra-inhibited T follicular helper (Tfh) cell expansion and subsequent germinal center (GC)-dependent humoral immunity, resulting in significantly weakened protection against the HBV challenge. Compared to soluble antigens, HBsAg particle antigen displayed a unique capture/uptake and innate immune activation, including IL-1Ra expression, preferably of medullary sinus macrophages. In humans, a unique polymorphism in the RelA/p65 binding site of IL-1Ra enhancer associated IL-1Ra levels with ethnicity-dependent vaccination outcome. Therefore, the differential IL-1Ra response to particle antigens probably creates a suppressive milieu for Tfh/GC development, and neutralization of IL-1Ra would resurrect antibody response in HBV vaccine nonresponders.

Keywords: GC; IL-1Ra; Tfh; medullary sinus macrophage; particle antigens.


Conflict of interest statement

The authors declare no competing interest.

Figures

Fig. 1.
Fig. 1.
IL-1Ra inversely correlated with protective humoral response to HBV. (A) Geographical responder rates (HBsAb > 10 U/mL) in 18,175 adults (43 eligible articles, Methods) enrolled from China (CH, 10,964 individuals), the Middle East (ME, 400 individuals), Europe (EUR, 4,606 individuals), Southeast Asia (EAS, 1,081 individuals), South America (AMR, 1,492 individuals), Africa (AFR, 409 individuals), South Asia (SAS, 1,584 individuals), and the United States (USA, 2,635 individuals). Kruskal–Wallis test, **P < 0.01; ****; P < 0.0001. (B) Cohort scheme of 41 adults received three doses of HBV vaccination and measurements of serum IL-1Ra (C), IL-1β (D), and IL-1α (E) in different response groups. Data are shown as mean ± SD. Unpaired Mann–Whitney U test. *P < 0.05; **P < 0.01. Correlation diagram of log transformed HBsAb levels versus IL-1ra (F), IL-1β (G), and IL-1α (H). Spearman correlation. *P < 0.05; **P < 0.01. (I) Serum HBsAg and HBsAb at indicated times after IL-1rn−/− (n = 5) or wt littermates (n = 4) were s.c. immunized with HBsAg/Alum and i.v. challenged with AAV8/HBV1.3. (J) The wt mice (n = 6 each group) were s.c. immunized with HBsAg/Alum and intraperitoneal injection of 20 μg αIL-1Ra or phosphate-buffered saline 1 d after. Enzyme-linked immunosorbent assay measurement of serum HBsAb, enzyme-linked immune absorbent spot analysis of HBsAb-secreting cells, and frequencies of Tfh and GC B cells were measured at the indicated time after αIL-1Ra. Data are shown as mean ± SD. Unpaired Student’s t test. *P < 0.05; **P < 0.01.
Fig. 2.
Fig. 2.
IL-1Ra modulated antibody response to particle antigens. The wt mice were s.c. injected with OVA/Alum or HBsAg/Alum (n = 3 each group) and serum IL-1Ra (A), IL-Ra in dLN (B), or serum IL-1β (C) was measured at indicated time. IL-1rn−/− or wt littermates (n = 3 each group) were s.c. immunized with hepatitis B vaccine or OVA/Alum, serum antibodies (D) (enzyme-linked immunosorbent assay), and the number of antibody secreting cells (E) (enzyme-linked immune absorbent spot) in various organs (dLN; Sp, Spleen; BM, bone marrow) were measured at the indicated time. Serum IL-1Ra levels were determined after wt mice (n = 3 each group) were s.c. injected with HAV (F) or influenza vaccine (G), and antibodies against HAV (H) or influenza vaccine (I) were measured at the indicated time postvaccination. (J) Serum antibodies were measured at the indicated time after IL-−/−, IL-−/−, or IL-1R1−/− mice, and corresponding wt littermates (n = 3 each group) were vaccinated with OVA/Alum or HBV vaccine. Data were mean ± SD. Unpaired Student’s t test. *P < 0.05; **P < 0.01; ***P < 0.001.
Fig. 3.
Fig. 3.
Tfh/GC response to HBV vaccine were augmented in IL-1rn−/−. Frequencies and absolute cell numbers of Tfh cells (A) and GC B cells (B) (percentage of B cells in dLN or each dLN) were assessed at indicated times after IL-1rn−/−, or wt mice (n = 3 each group) were s.c. immunized with HBV vaccine. (C) Immunohistochemistry of GCs (brown for IgD+; pink for GL-7+) showed GC numbers, single GC areas, and area percentage of GCs per mm2 cross-section. Data are shown as mean ± SD. Unpaired Student’s t test. *P < 0.05; **P < 0.01; ***P < 0.001.
Fig. 4.
Fig. 4.
HBsAg activation of IL-1R1 in Tfh cells was antagonized by IL-1Ra. Tfh/GC B cell frequencies and HBsAb response to s.c. HBsAg/Alum 1 wk after IL-1rn−/− or wt mice (n = 6 each group) were intraperitoneal injected with αIL-1R (A) or αIL-1β (B) antibodies. (C) Tfh, GC B cell frequencies, and HBsAb response to s.c. hepatitis B vaccine after 1 wk after in IL-1rn−/−, IL-1r1−/− × IL-1rn−/−, IL-1r1−/−, or wt mice (n = 3 each group). (D) FACS analyses of IL-1R1 expression in various T helper subtypes isolated from dLN 4 d after mice (n = 3 each group) were s.c. immunized with HBsAg/Alum. (E and F) Carboxy fluorescein diacetate succinimide ester (CFSE)-labeled naïve CD4+ T cells (Vα2+ TCR) from OT-II or IL-1r1−/− OT-II mice were adoptively transferred to IL-1rn−/− (Vα2 TCR) mice (n = 3 each group). Reconstituted mice were s.c. immunized with OVA/Alum. (E and G) Tfh cells in Vα2+ or Vα2 population 1 wpi. (F) CFSE intensity of CXCR5+ cells among the Vα2+ population 4 dpi was determined. Data are shown as mean ± SD. Unpaired Student’s t test. *P < 0.05; **P < 0.01; ***P < 0.001.
Fig. 5.
Fig. 5.
Macrophage-derived IL-1Ra–attenuated Tfh cell development. (A) Naïve CD4+ T cells and non-T cells isolated from wt or IL-1rn−/− mice were cocultured in different combinations as indicated, in the presence of 200 ng/mL HBsAg/Alum for 3 d, in which αIL-1Ra or αIL-1α/β (5 μg/mL) was added. Tfh cell frequencies in draining lymph nodes and IL-1Ra in the supernatants were measured. Tfh and B cells were isolated from dLNs and spleens and cocultured with or without Tfr cells for 3.5 d. IL-4 and IL-21 (B), IL-1Ra (C), and IL-1β (D) in supernatants were measured. (E) Fold of increase of IL-1rn mRNA expressed in the indicated cell types isolated from dLN 0 or 4 dpi s.c. with HBsAg/Alum was compared to that of β-actin. (F) DCs did not account for IL-1Ra production. MSM and DCs were FACS measured 3 d after anti-CSF1R depletion (n = 5), and IL-1Ra was measured 4 d after HBsAg/Alum immunization. (G) Macrophages were ablated by clodronate liposomes in IL-1rn−/− mice (rn−/−ΔM; n = 3) 1 d before bone-marrow-derived macrophage from wt or IL-1rn−/− donor mice were transferred. HBsAg/Alum were injected 6 h after, and Tfh frequencies were measured 4 d later. The wt littermates and IL-1rn−/− were controls. Data are shown as mean ± SD. Unpaired Student’s t test, *P < 0.05; **P < 0.01.
Fig. 6.
Fig. 6.
HBsAg stimulated robust innate activation of LN macrophages. Macrophages were sorted out of spleens and dLNs 2 h after wt mice (n = 4 each group) were i.v. immunized with OVA or HBsAg, and total RNAs were subject to RNA-seq. (A) Volcano plots of changed gene expression for HBsAg versus prevaccination and OVA versus prevaccination. Red/Orange dots: significantly up-regulated genes for HBsAg and OVA, respectively; deep blue/skyblue: significantly down-regulated genes for HBsAg and OVA, respectively. The cutoffs for differentially expressed genes are fold change ≥ 2 and adjusted P value < 0.05. Venn diagrams of common and specific regulated genes for HBsAg and OVA. (B) Selection of enriched Kyoto Encyclopedia of Genes and Genomes pathways using gene set enrichment analysis for up- and down-regulated genes by HBsAg or OVA. *, pathways involved RelA. Dot lines, P = 0.05; sizes of dots, numbers of responsive genes in the indicated pathways. (C) Heatmap of the differentially expressed transcription factors after HBsAg or OVA immunization. (D) Fold of increase of the indicated mRNA in isolated LN macrophages compared to β-actin after s.c. HBsAg/Alum immunization. (E) Differentially expressed genes responsive to the indicated transcription factors. Dot line, P = 0.05; size of the dots, the number of responsive genes. (F) Inhibition of IL-1Ra expression in peritoneal macrophages by BAY 11-7082. Cells were harvested 1 h after s.c. HBV or OVA vaccination and incubated in vitro with or without BAY 11-7082 for 24 h before enzyme-linked immunosorbent assay analysis. (G) Individual frequencies of alternate bases for seven common SNPs in IL-1rn enhancer element GH02J113113 were plotted to nonresponder rates to HBV vaccines in healthy adults of chosen geographic regions. (H) Overall percentage of alternated bases for all seven SNP within IL-1rn enhancers in different populations. (I) SNP (rs4251982) in the RelA/p65 binding site exclusively in African populations. Data are shown as mean ± SD. Unpaired Student’s t test. *P < 0.05; **P < 0.01; ***P < 0.001.
Fig. 7.
Fig. 7.
Preferential IL-1rn activation in MSM by HBsAg wt mice were s.c. immunized with fluorescence-labeled ef647-HBsAg or AF555-OVA conjugated with alum. (A) Cryostat sections were stained for CD169 (blue), F4/80 (green) to distinguish MSM (CD169+F4/80+, cyan), and SCS (CD169+F4/80, blue). Antigens are in red. The four panels on the left show whole-mount stains of dLN, and the two on the right are enlargement of indicated areas in solid or dotted boxes. The yellow arrows in the first column show antigens entering the medullary region. Antigen positive SCS (open arrows) or MSM (solid arrows) are shown in the enlargements, representative images of two repeated experiments. (Scale bars, 20 or 500 µm.) (B) Pearson coefficients of colocalization of the indicated antigen and CD169+ or F4/80+ macrophages in the whole-mount view, respectively, calculated by Imaris software. (C and D) FACS analysis of MSM and SCS positive for indicated antigen 2 h after wt mice (n = 3 each group) were s.c. injected with ef647-HBsAg or AF555-OVA conjugated with alum. (E) Measurement of IL-1rn mRNA levels in SCS and MSM 4 h after mice (n = 3 each group) were s.c. immunized with indicated vaccines. (F) For LTβR blockage, wt mice were treated with LTβR-hIgG intraperitoneally once per week (100 µg). About 3 wk later, depletion efficiency of SCS and MSM in dLN and IL-1Ra were analyzed. Data are shown as mean ± SD. Unpaired Student’s t test. **P < 0.01; ***P < 0.001.

Similar articles

References

    1. Fazilleau N., Mark L., McHeyzer-Williams L. J., McHeyzer-Williams M. G., Follicular helper T cells: Lineage and location. Immunity 30, 324–335 (2009). - PMC - PubMed
    1. Seo G.-Y., Youn J., Kim P.-H., IL-21 ensures TGF-beta 1-induced IgA isotype expression in mouse Peyer’s patches. J. Leukoc. Biol. 85, 744–750 (2009). - PubMed
    1. Glatman Zaretsky A., et al. ., T follicular helper cells differentiate from Th2 cells in response to helminth antigens. J. Exp. Med. 206, 991–999 (2009). - PMC - PubMed
    1. Kim J. R., Lim H. W., Kang S. G., Hillsamer P., Kim C. H., Human CD57+ germinal center-T cells are the major helpers for GC-B cells and induce class switch recombination. BMC Immunol. 6, 3 (2005). - PMC - PubMed
    1. McHeyzer-Williams M., Okitsu S., Wang N., McHeyzer-Williams L., Molecular programming of B cell memory. Nat. Rev. Immunol. 12, 24–34 (2011). - PMC - PubMed

Publication types

MeSH terms