. 2021 Apr 27;118(17):e2020167118.
doi: 10.1073/pnas.2020167118.

Life-course trajectories of body mass index from adolescence to old age: Racial and educational disparities

Affiliations

Life-course trajectories of body mass index from adolescence to old age: Racial and educational disparities

Yang Claire Yang et al. Proc Natl Acad Sci U S A. .

Abstract

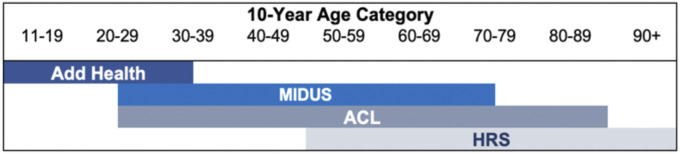
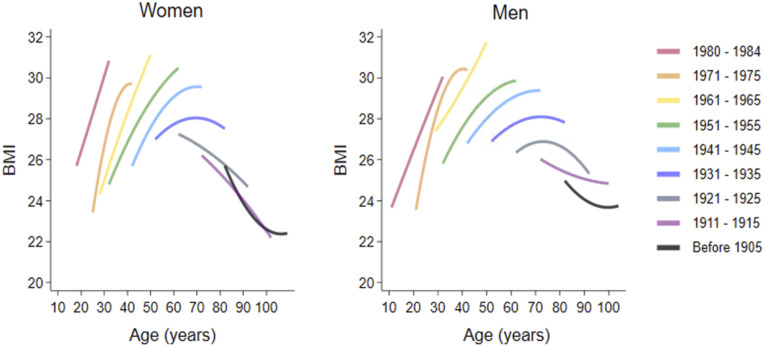
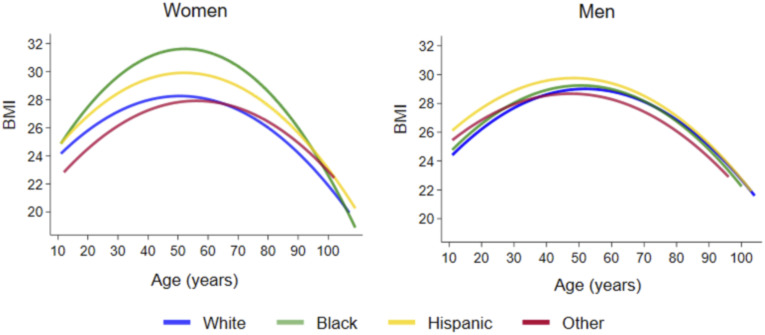
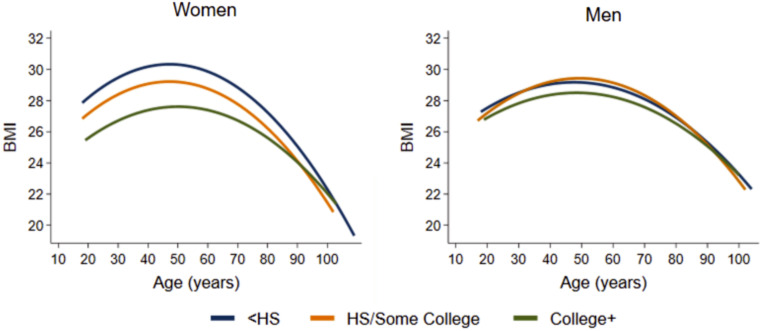
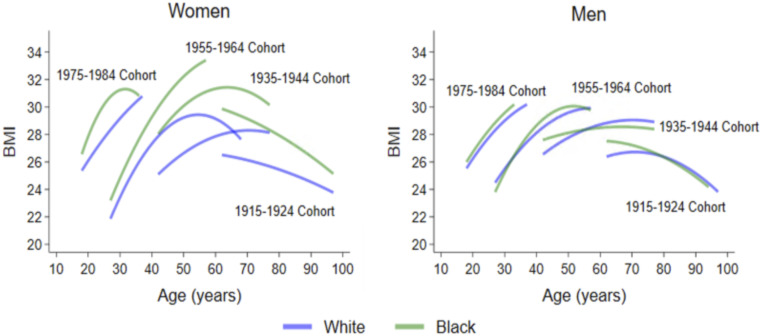
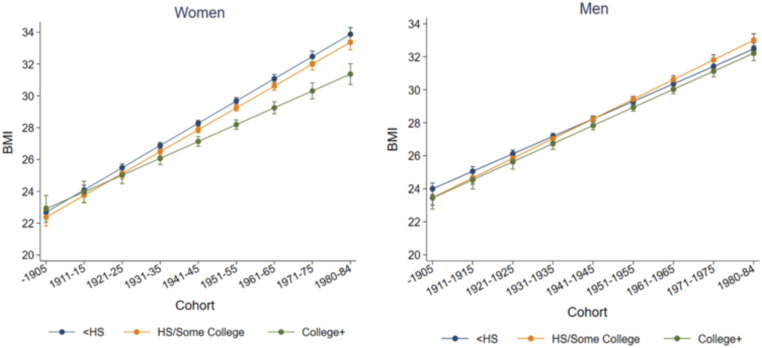
No research exists on how body mass index (BMI) changes with age over the full life span and social disparities therein. This study aims to fill the gap using an innovative life-course research design and analytic methods to model BMI trajectories from early adolescence to old age across 20th-century birth cohorts and test sociodemographic variation in such trajectories. We conducted the pooled integrative data analysis (IDA) to combine data from four national population-based NIH longitudinal cohort studies that collectively cover multiple stages of the life course (Add Health, MIDUS, ACL, and HRS) and estimate mixed-effects models of age trajectories of BMI for men and women. We examined associations of BMI trajectories with birth cohort, race/ethnicity, parental education, and adult educational attainment. We found higher mean levels of and larger increases in BMI with age across more recent birth cohorts as compared with earlier-born cohorts. Black and Hispanic excesses in BMI compared with Whites were present early in life and persisted at all ages, and, in the case of Black-White disparities, were of larger magnitude for more recent cohorts. Higher parental and adulthood educational attainment were associated with lower levels of BMI at all ages. Women with college-educated parents also experienced less cohort increase in mean BMI. Both race and education disparities in BMI trajectories were larger for women compared with men.

Keywords: age trajectory; body mass index; life course; obesity; social disparities.


Conflict of interest statement

Competing interest statement: Y.C.Y. and B.L. are coauthors on a 2017 article.

Figures

Fig. 1.
Fig. 1.
Integrative life-course research design: age coverage by study membership. This innovative research design uses pooled IDA to combine four large cohort studies: National Longitudinal Study of Adolescent to Adult Health (Add Health), Midlife in the US Study (MIDUS), Americans’ Changing Lives Study (ACL), and the Health and Retirement Study (HRS). These studies collectively cover multiple stages of the life course from adolescence to late adulthood from age 11 through 90 y and older. Data from Add Health, MIDUS, ACL, and HRS included respondents aged 11 to 34 y, 25 to 75 y, 25 to 90 y, and 50 to 107 y, respectively.
Fig. 2.
Fig. 2.
Predicted BMI trajectories by birth cohort for women and men. Results are based on model 1 in SI Appendix, Tables S3 and S4 for women and men, respectively. Only every other birth cohort is included for purpose of illustration. The overall pattern of BMI change by age was similar for both men and women, with an increase in BMI from adolescence to middle age, peaking around ages 50 to 60 y, and then a decline after the age of 70. The pattern of cohort variation for both genders show that each successive cohort displayed a higher average BMI and steeper slopes of increase in BMI at the same ages than their predecessors.
Fig. 3.
Fig. 3.
Predicted BMI trajectories by race and ethnicity for women and men. Results are based on model 2 in SI Appendix, Tables S3 and S4, respectively. Black and Hispanic women displayed higher BMI trajectories than White or other race women across the lifespan. Black women had the highest BMI trajectory across all groups, with BMI rising precipitously in early adulthood. For men, the racial/ethnic gradient in BMI trajectory is smaller, with Hispanic men having significantly higher average BMI than White men, particularly in young and midadulthood. Racial gaps generally diminish in old age.
Fig. 4.
Fig. 4.
Predicted BMI trajectories by adult educational status. Results are based on model 3 in SI Appendix, Tables S3 and S4 for women and men, respectively. For women, there is a clear educational gradient in the BMI trajectories, such that those with less than a high school degree have the highest average BMI trajectory, followed by those with a high school degree, and then those with a college degree or more that show the lowest BMI trajectory. This pattern holds across most of the lifespan but then decreases around 100 y of age. The trajectories for men are similar to those of women but smaller in magnitude.
Fig. 5.
Fig. 5.
Black–White differences in predicted BMI trajectories by birth cohort. Results are based on model 4 in SI Appendix, Tables S3 and S4 for women and men, respectively. Only every other 10-y birth cohort is included for purpose of illustration. Black women exhibited steeper increases in BMI than White women over all ages and cohorts. Though cohort variations in the Black and White gaps in BMI trajectories are evident for both genders, they are more substantial for women compared with men. More recent cohorts show more consistently greater increases in BMI in Blacks than in Whites.
Fig. 6.
Fig. 6.
Predicted average BMI (with 95% CIs) by birth cohort and parent educational status. Results are based on model 4 in SI Appendix, Tables S3 and S4 for women and men, respectively. Only every other 5-y birth cohort is included for purpose of illustration. While average BMI is similar for all educational groups for the earliest cohorts, gaps between those with more highly educated parents and those with the least-educated parents emerged for cohorts born after 1940 and widened for each consecutive cohort. For both genders there were larger cohort increases in mean BMI in the lower parental educational status groups compared with those with college-educated parents.

Similar articles

Cited by

References

    1. Halfon N., Larson K., Slusser W., Associations between obesity and comorbid mental health, developmental, and physical health conditions in a nationally representative sample of US children aged 10 to 17. Acad. Pediatr. 13, 6–13 (2013). - PubMed
    1. Kearns K., Dee A., Fitzgerald A. P., Doherty E., Perry I. J., Chronic disease burden associated with overweight and obesity in Ireland: The effects of a small BMI reduction at population level. BMC Public Health 14, 143 (2014). - PMC - PubMed
    1. Garvey W. T.et al. .; Reviewers of the AACE/ACE Obesity Clinical Practice Guidelines , American Association of Clinical Endocrinologists and American College of Endocrinology comprehensive clinical practice guidelines for medical care of patients with obesity. Endocr. Pract. 22, 1–203 (2016). - PubMed
    1. Belanger M. J., et al. ., Covid-19 and disparities in nutrition and obesity. N. Engl. J. Med. 383, e69 (2020). - PubMed
    1. Sun Q., et al. ., Comparison of dual-energy x-ray absorptiometric and anthropometric measures of adiposity in relation to adiposity-related biologic factors. Am. J. Epidemiol. 172, 1442–1454 (2010). - PMC - PubMed

Publication types

LinkOut - more resources