. 2021 Apr 27;118(17):e2021682118.
doi: 10.1073/pnas.2021682118.

Transcriptional profiling reveals signatures of latent developmental potential in Arabidopsis stomatal lineage ground cells

Affiliations

Transcriptional profiling reveals signatures of latent developmental potential in Arabidopsis stomatal lineage ground cells

Chin-Min Kimmy Ho et al. Proc Natl Acad Sci U S A. .

Abstract

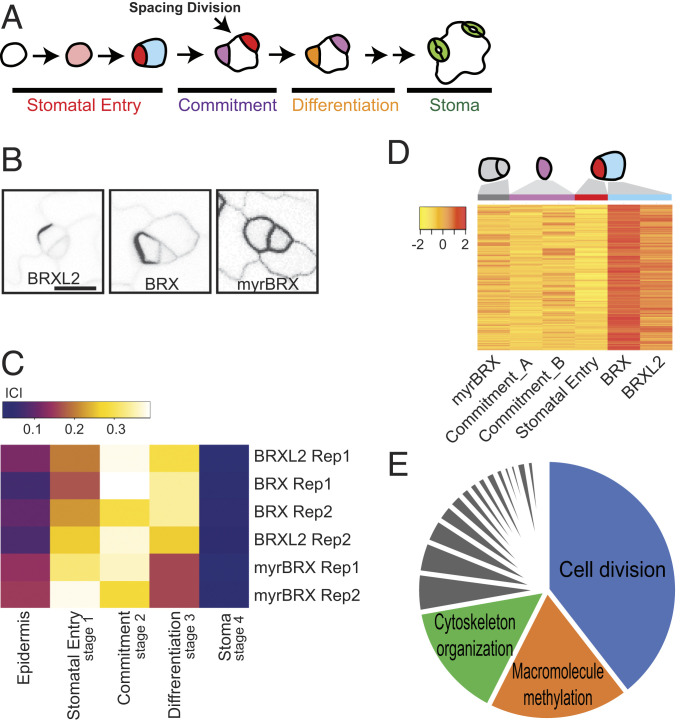
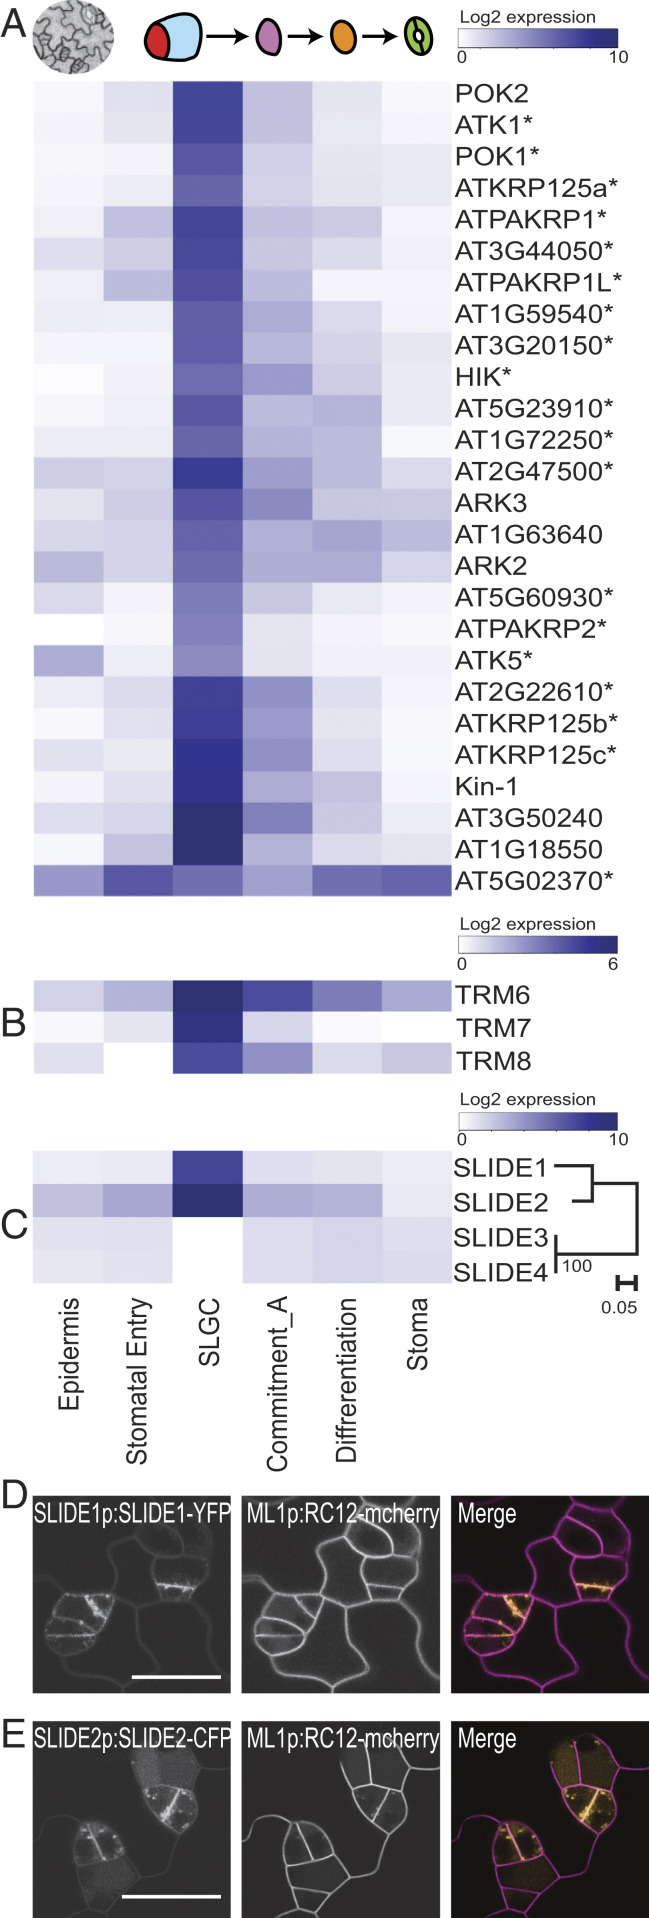
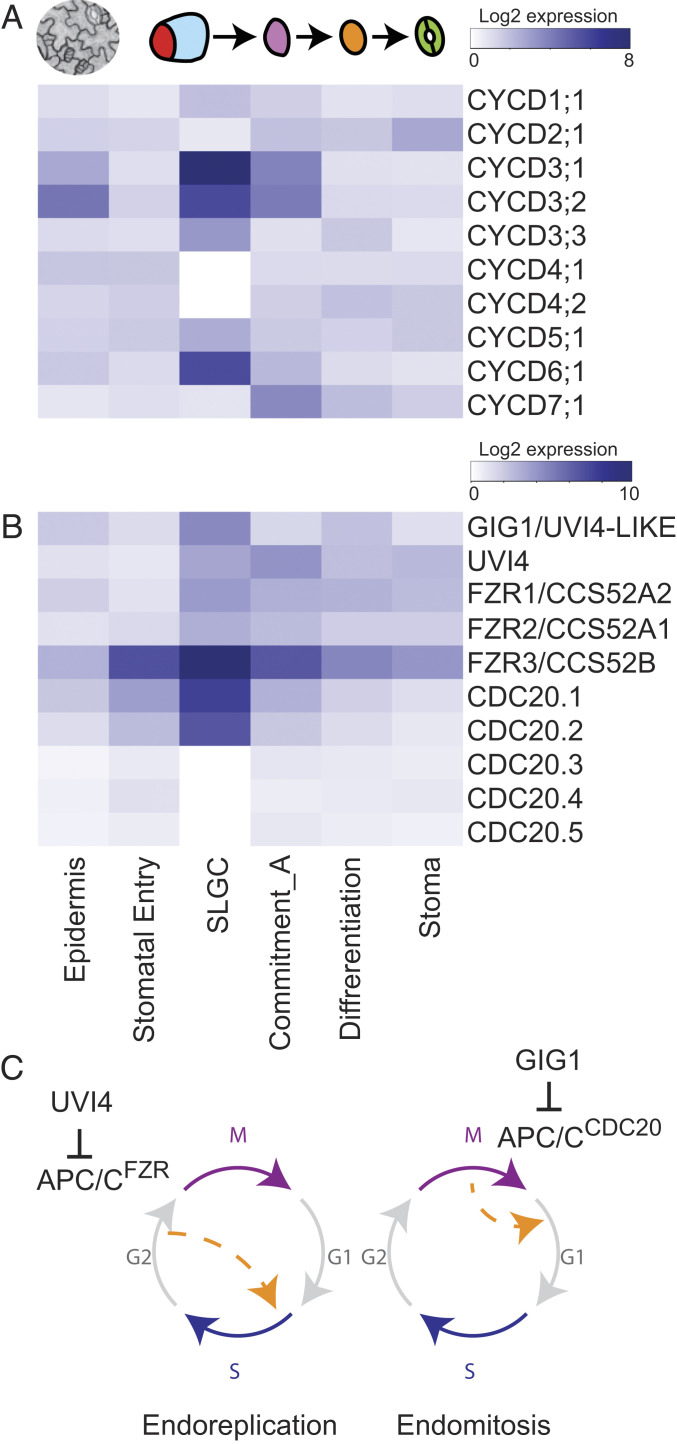
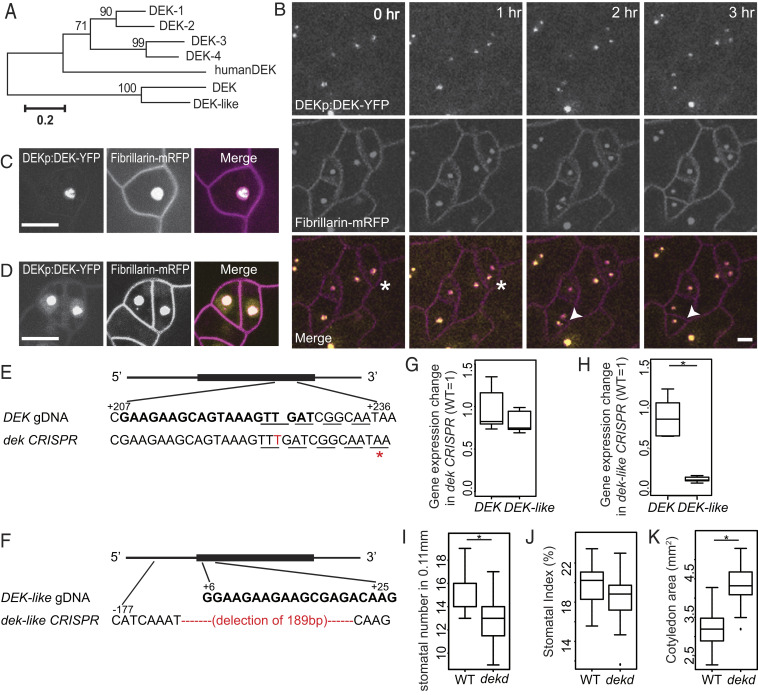
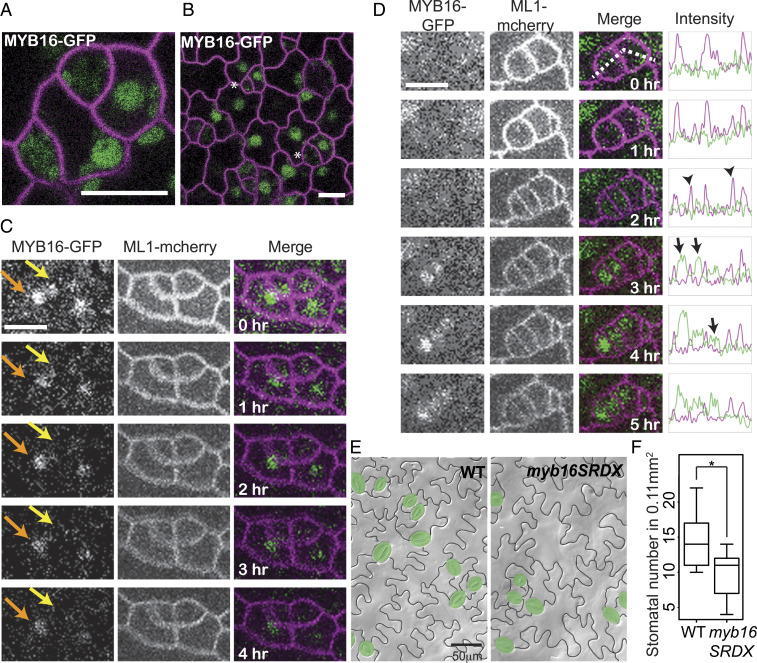
In many developmental contexts, cell lineages have variable or flexible potency to self-renew. What drives a cell to exit from a proliferative state and begin differentiation, or to retain the capacity to divide days or years later is not clear. Here we exploit the mixed potential of the stomatal lineage ground cell (SLGC) in the Arabidopsis leaf epidermis as a model to explore how cells might balance potential to differentiate with a reentry into proliferation. By generating transcriptomes of fluorescence-activated cell sorting-isolated populations that combinatorically define SLGCs and integrating these data with other stomatal lineage datasets, we find that SLGCs appear poised between proliferation and endoreduplication. Furthermore, we found the RNA polymerase II-related mediator complex interactor DEK and the transcription factor MYB16 accumulate differentially in the stomatal lineage and influence the extent of cell proliferation during leaf development. These findings suggest that SLGC latent potential is maintained by poising of the cell cycle machinery, as well as general and site-specific gene-expression regulators.

Keywords: Arabidopsis; MYB16 endoreduplication; stomatal lineage ground cell; transcriptional profile.


Conflict of interest statement

The authors declare no competing interest.

Figures

Fig. 1.
Fig. 1.
Profiling of the SLGC transcriptome. (A) Scheme of Arabidopsis stomatal development. Stomatal entry requires an asymmetric cell division that produces a meristemoid (red) and a SLGC (blue); both have division potential. Meristemoids can divide (not shown) or commit to precursor identity (violet) and subsequent stomatal differentiation (orange), becoming stomata (green). SLGCs are multipotent and can divide to create more meristemoids (spacing division) before differentiating into lobed pavement cells. (B) Confocal images from true leaves of 9-d-old seedlings expressing SLGC-enriched (BRXL2p:BRXL2-YFP and BASLp:BRX-YFP) or SLGC and meristemoid-enriched (BASLp:myrBRX-YFP) markers used for FACS. (Scale bar, 10 μm; all images are at the same scale.) (C) Output of transcriptome-based ICI analysis comparing SLGC-enriched populations to other stomatal lineage cell-type transcriptomes from Adrian et al. (15). BRX and BRXL2 samples are most similar to commitment (stage 2) cells and myrBRX cells resemble stomatal entry (stage 1). (D) Heat map representation of genes highly and differentially expressed in presumptive SLGCs (BRX and BRXL2) (clustering coefficient cutoff 0.6). Mean and median expression values are scaled per gene across samples. Stomatal commitment A and B samples are described in Methods. (E) Enriched GO process terms for SLGC cluster created using REVIGO (48), and represented as a pie chart, with three most significant categories labeled; terms for gray slices are in Dataset S4.
Fig. 2.
Fig. 2.
SLGCs profiles are enriched for mitotic kinesins and division plane-associated factors. (AC) Heatmaps showing genes whose expression is preferentially associated with the SLGC cluster. (A) Twenty-six kinesins (an asterisk indicates mitotic), including POK1, POK2, and ARK3 that associate with the preprophase band (PPB). (B) PPB stabilizing factors, TRM6/7/8. (C) Previously uncharacterized SLIDE family of membrane proteins. Phylogeny indicating closely related SLIDE1 and SLIDE2 are highly expressed in SLGCs. (D and E) Confocal images of leaf epidermal cells showing SLIDE1-YFP and SLIDE2-CFP puncta (yellow in merge) enriched at the cell plate of dividing stomatal lineage cells. Cell outlines marked by ML1p:RC12-mCherry (magenta). (Scale bars, 20 μm.)
Fig. 3.
Fig. 3.
SLGCs preferentially express specific CYCDs and endocycle related components, suggesting a poised division state. (A and B) Heatmaps showing genes whose expression is preferentially associated with the SLGC cluster. (A) Expression of all 10 G1/S regulating CYCD genes. (B) Expression of gene families associated with switch from mitotic to endoreduplication states. SLGCs are enriched for promoters of endoreduplication in the FZR family and CDC20.1/CDC20.2, but also their upstream inhibitors GIG1 and UVI4. (C) Illustration of endoreplication and endomitosis mechanisms for increasing ploidy. Orange dashed arrow indicates where cell cycle stages are bypassed. UVI4 and GIG1 negatively regulate APC/CFZR during endoreplication and APC/CCDC20 during endomitosis, respectively. See also SI Appendix, Fig. S5.
Fig. 4.
Fig. 4.
Identification and characterization of nucleolar-associated DEK proteins reveals their role in promoting continued SLGC division. (A) Phylogeny of Arabidopsis DEK-domain containing proteins with DEK and DEK-like as a distinct subgroup. (B) Confocal time-lapse images of dividing stomatal lineage cells from 4-d-old cotyledons coexpressing DEK-YFP (yellow) with a nucleolar marker, fibrillarin (magenta). Asterisks and arrowheads indicate two examples of dividing cells. Time stamps indicate time since start of cell division. Cell outlines marked by ML1p:RC12-mCherry (magenta). (C and D) Still images of DEK (yellow) and fibrillarin (magenta) showing that DEK is restricted to a subdomain of the nucleolus (C), but that also is weakly expressed in the nucleoplasm (D). (Scale bars, 10 μm.) (E and F) Gene-editing design for DEK and DEK-like, guide RNA is shown in bold and codons are denoted by underline. (E) A thymine (T) insertion results in a premature stop codon (red asterisk) in dek CRISPR plants. (F) There is a 189-base pair deletion in dek-like CRISPR plants. (G and H) Quantitative RT-PCR of dek and dek-like CRISPR plants showing unchanged and strongly reduced expression, respectively, of DEK and DEK-like genes. (IK) Quantification of stomatal numbers and stomatal index in dek and dek-like double CRISPR plants at 7 dpg. The double mutants have lower stomatal density (I) and no difference in stomatal index (J). (K) Quantification of cotyledon size showed the double mutants are larger than WT. Stomatal number in 0.11-mm2 regions (n = 20 seedlings). *P < 0.05 by Wilcoxon rank-sum test. See also SI Appendix, Fig. S6.
Fig. 5.
Fig. 5.
MYB16 preferentially labels SLGCs after asymmetric cell division and modulates stomatal lineage divisions. (A and B) Confocal image of 4 dpg cotyledons. (A) In meristemoid-SLGC sister pairs, MYB16-GFP (green) expression is higher in SLGCs. (B) In broader view, MYB16-GFP appears absent from meristemoids (asterisks). Cell outlines marked by ML1p:RC12A-mCherry (magenta). (C) Time-lapse confocal images showing that in sister meristemoid/SLGC pairs, MYB16-GFP persists longer in SLGCs (orange arrows) than in meristemoids (yellow arrows). (D) Time-lapse confocal images indicating that MYB16-GFP expression commences several hours after division. Intensity measurements (far right) were made in regions highlighted by a dashed line. In the intensity plot, MYB16-GFP and the cell outline are marked by green and magenta, respectively, two divisions appear at 2 h (arrows). MYB16-GFP (arrows) appears after cytokinesis (arrowheads at 2-h timepoint). (Scale bars, 10 μm.) (E) False-colored DIC images of WT and myb16SRDX epidermis showing morphologically normal stomata and pavement cells. (F) Quantification of changes to stomatal density (*P < 0.05) in 7 dpg WT and myb16SRDX cotyledons. 0.11-mm2 fields were scored (n = 20 seedlings).

Similar articles

Cited by

References

    1. O’Brien L. E., Soliman S. S., Li X., Bilder D., Altered modes of stem cell division drive adaptive intestinal growth. Cell 147, 603–614 (2011). - PMC - PubMed
    1. Lau O. S., et al. ., Direct roles of SPEECHLESS in the specification of stomatal self-renewing cells. Science 345, 1605–1609 (2014). - PMC - PubMed
    1. Horst R. J., et al. ., Molecular framework of a regulatory circuit initiating two-dimensional spatial patterning of stomatal lineage. PLoS Genet. 11, e1005374 (2015). - PMC - PubMed
    1. Dong J., MacAlister C. A., Bergmann D. C., BASL controls asymmetric cell division in Arabidopsis. Cell 137, 1320–1330 (2009). - PMC - PubMed
    1. Zhang Y., Wang P., Shao W., Zhu J. K., Dong J., The BASL polarity protein controls a MAPK signaling feedback loop in asymmetric cell division. Dev. Cell 33, 136–149 (2015). - PMC - PubMed

Publication types

MeSH terms