

People have shaped most of terrestrial nature for at least 12,000 years
- PMID: 33875599
- PMCID: PMC8092386
- DOI: 10.1073/pnas.2023483118
People have shaped most of terrestrial nature for at least 12,000 years
Abstract
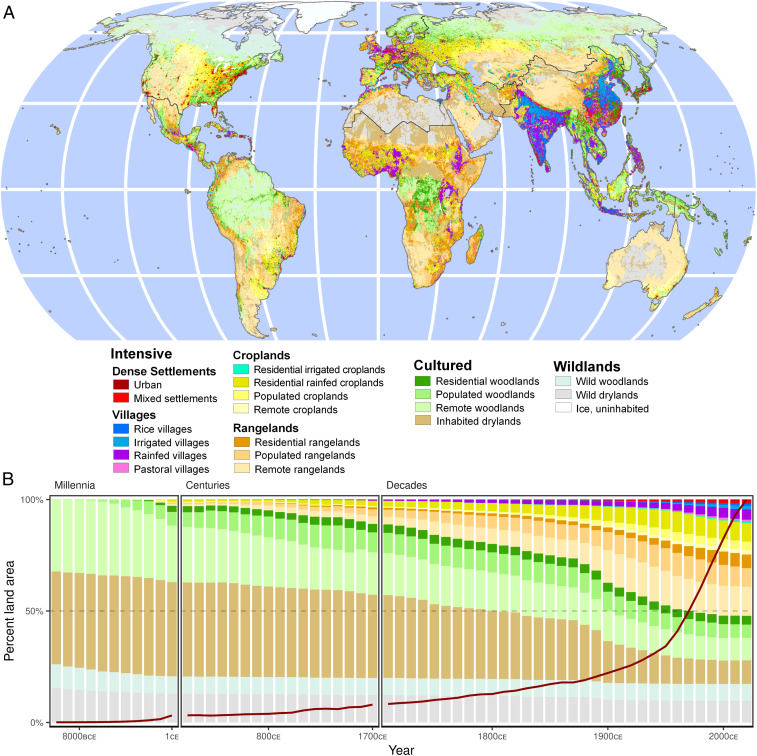
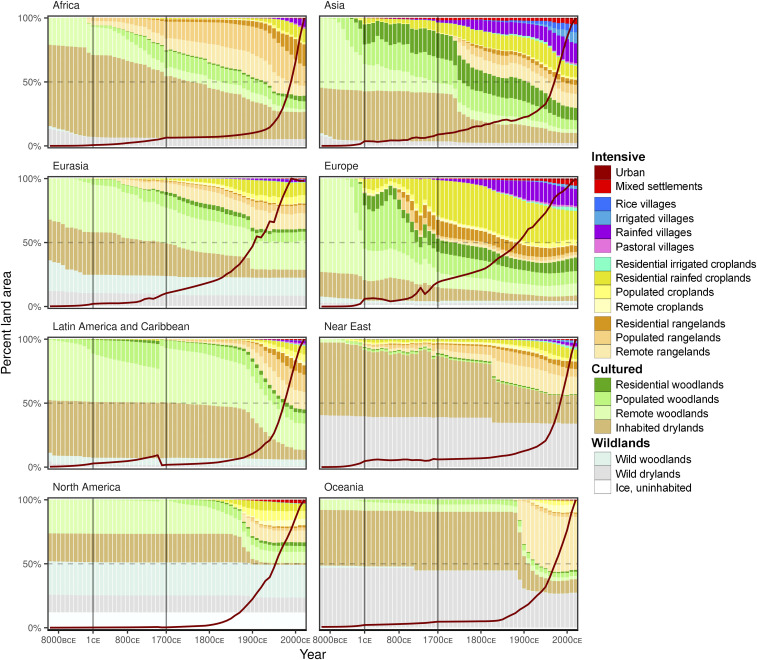
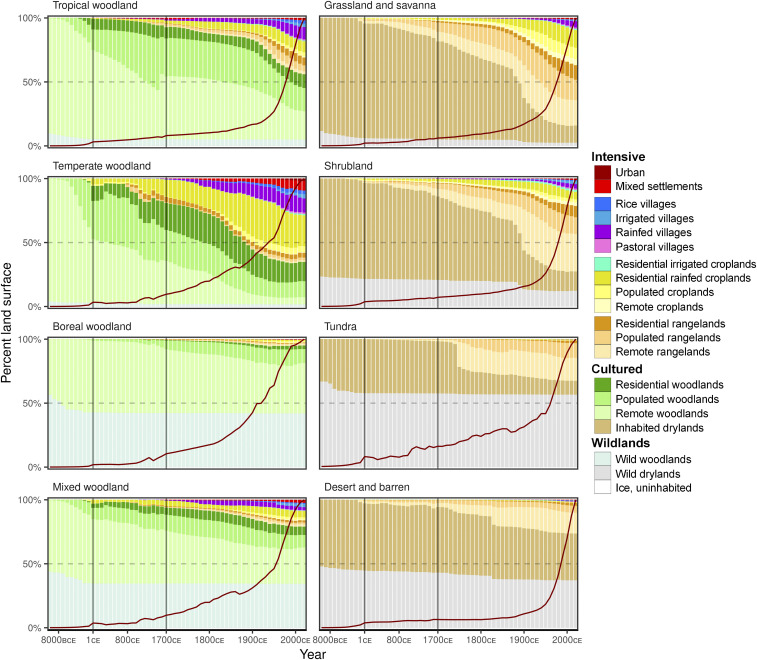
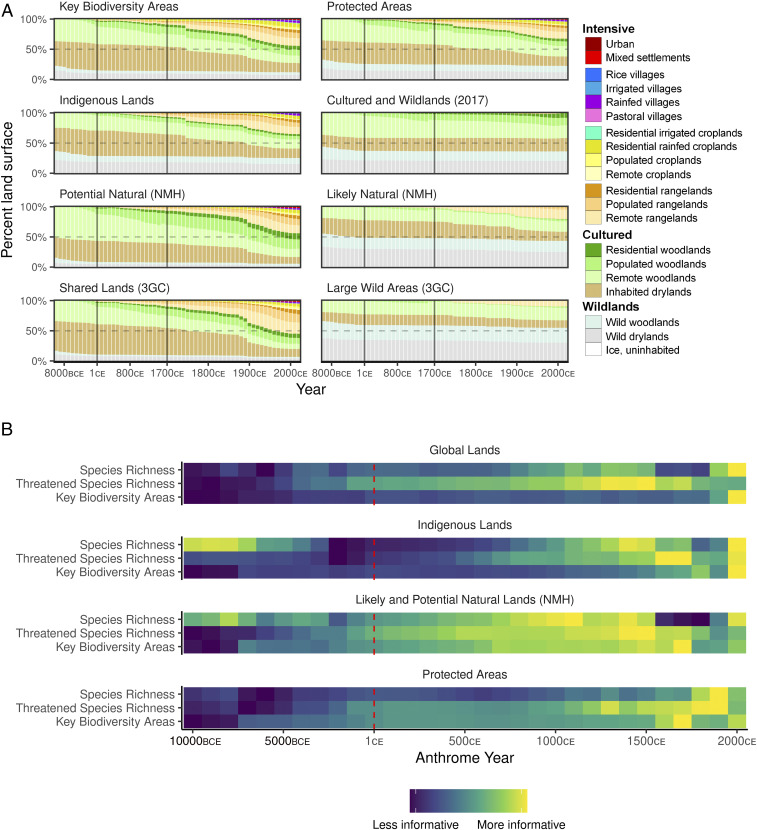
Archaeological and paleoecological evidence shows that by 10,000 BCE, all human societies employed varying degrees of ecologically transformative land use practices, including burning, hunting, species propagation, domestication, cultivation, and others that have left long-term legacies across the terrestrial biosphere. Yet, a lingering paradigm among natural scientists, conservationists, and policymakers is that human transformation of terrestrial nature is mostly recent and inherently destructive. Here, we use the most up-to-date, spatially explicit global reconstruction of historical human populations and land use to show that this paradigm is likely wrong. Even 12,000 y ago, nearly three quarters of Earth's land was inhabited and therefore shaped by human societies, including more than 95% of temperate and 90% of tropical woodlands. Lands now characterized as "natural," "intact," and "wild" generally exhibit long histories of use, as do protected areas and Indigenous lands, and current global patterns of vertebrate species richness and key biodiversity areas are more strongly associated with past patterns of land use than with present ones in regional landscapes now characterized as natural. The current biodiversity crisis can seldom be explained by the loss of uninhabited wildlands, resulting instead from the appropriation, colonization, and intensifying use of the biodiverse cultural landscapes long shaped and sustained by prior societies. Recognizing this deep cultural connection with biodiversity will therefore be essential to resolve the crisis.
Keywords: Anthropocene; agriculture; conservation; extinction; hunter-gatherer.
Copyright © 2021 the Author(s). Published by PNAS.
Conflict of interest statement
The authors declare no competing interest.
Figures
References
-
- Ellis E. C., Klein Goldewijk K., Siebert S., Lightman D., Ramankutty N., Anthropogenic transformation of the biomes, 1700 to 2000. Glob. Ecol. Biogeogr. 19, 589–606 (2010).
-
- Kennedy C. M., Oakleaf J. R., Theobald D. M., Baruch-Mordo S., Kiesecker J., Managing the middle: A shift in conservation priorities based on the global human modification gradient. Glob. Change Biol. 25, 811–826 (2019). - PubMed
-
- Williams B. A., et al., Change in terrestrial human footprint drives continued loss of intact ecosystems. One Earth 3, 371–382 (2020).
-
- Kaplan J. O., et al., Holocene carbon emissions as a result of anthropogenic land cover change. Holocene 21, 775–791 (2011).
Publication types
MeSH terms
LinkOut - more resources
Full Text Sources
Other Literature Sources
Miscellaneous
