. 2021 Apr 19;12(1):2311.
doi: 10.1038/s41467-021-22399-3.

Transcriptomic analysis to identify genes associated with selective hippocampal vulnerability in Alzheimer's disease

Affiliations

Transcriptomic analysis to identify genes associated with selective hippocampal vulnerability in Alzheimer's disease

Angela M Crist et al. Nat Commun. .

Abstract

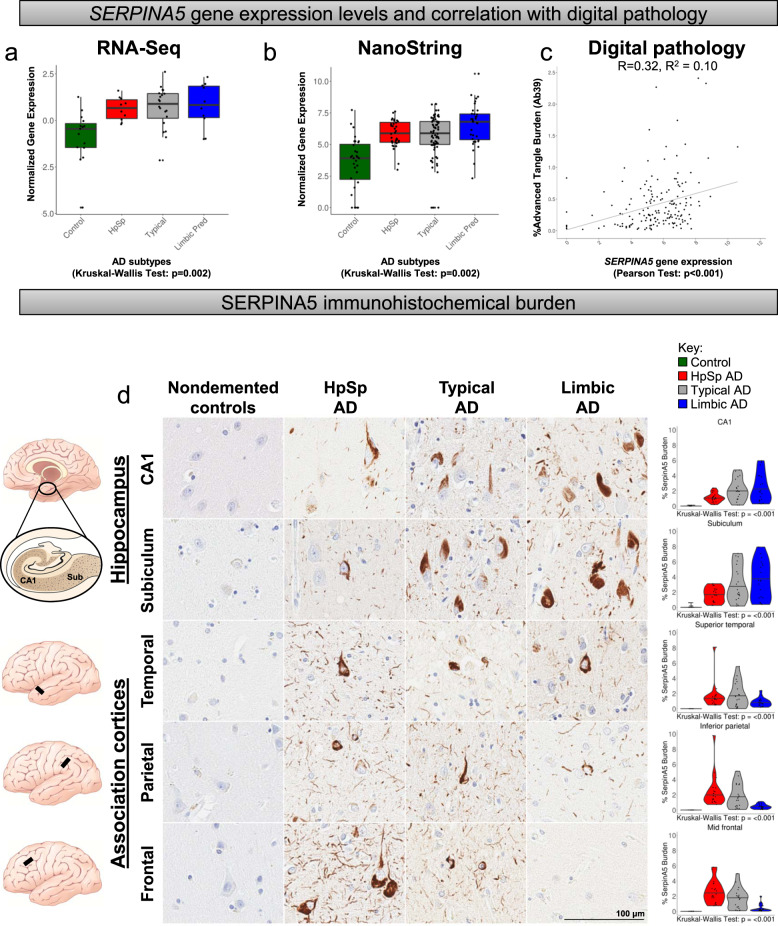
Selective vulnerability of different brain regions is seen in many neurodegenerative disorders. The hippocampus and cortex are selectively vulnerable in Alzheimer's disease (AD), however the degree of involvement of the different brain regions differs among patients. We classified corticolimbic patterns of neurofibrillary tangles in postmortem tissue to capture extreme and representative phenotypes. We combined bulk RNA sequencing with digital pathology to examine hippocampal vulnerability in AD. We identified hippocampal gene expression changes associated with hippocampal vulnerability and used machine learning to identify genes that were associated with AD neuropathology, including SERPINA5, RYBP, SLC38A2, FEM1B, and PYDC1. Further histologic and biochemical analyses suggested SERPINA5 expression is associated with tau expression in the brain. Our study highlights the importance of embracing heterogeneity of the human brain in disease to identify disease-relevant gene expression.


Conflict of interest statement

R.C.P. is a consultant for Hoffman-La Roche, Merck, Biogen, Eisai. R.C.P. is on the Data safety and monitoring board for Genentech. N.G.R. takes part in multi-center studies funded by Lilly, Biogen, and Abbvie. M.E.M. served as a consultant for AVID Radiopharmaceuticals. All other authors declare no competing interests.

Figures

Fig. 1
Fig. 1. Case selection criteria and neuropathologic subtyping of AD.
a Flowchart describing selection criteria of AD cases to obtain frozen hippocampal tissue used to perform RNA-Seq and NanoString studies. AD cases were subtyped using a validated algorithm based on topographic distribution of hippocampal and cortical neurofibrillary tangles. Brain cartoons illustrate corticolimbic patterns of neurofibrillary tangle burden throughout the brain in each AD subtype, where red indicates a high tangle burden and yellow/tan indicates a low tangle burden. b Overview of sample size for RNA-Seq and NanoString cohorts organized by AD subtype and control classification. Note: Cohort expansion for NanoString included all RNA-Seq cohort samples. AD, Alzheimer’s disease; DV300, distribution value over 300 base pairs; HpSp, hippocampal sparing; Limbic, limbic predominant; NFT, neurofibrillary tangle; RIN, RNA integrity number; RNA-Seq, RNA sequencing.
Fig. 2
Fig. 2. Workflow depicting multi-disciplinary method to identify genes involved in hippocampal vulnerability in AD.
Controls and typical AD cases were grouped into the representative phenotype (green-black), while hippocampal sparing AD and limbic predominant AD were grouped into the extreme phenotype (red-blue). Frozen human hippocampal tissue was first dissected, followed by RNA extraction, purification, and lastly prepped for RNA-Seq. A multi-step approach was implemented for gene prioritization, which began with genes nominated from the AD literature (Step 1). Next, we examined differentially expressed genes derived from the representative phenotype and extreme phenotype (Step 2a) before further bioinformatic prioritization (Step 2b). The differentially expressed genes identified in Step 2a were further prioritized based upon process network interactions (Step 3). We then combined the 339 unique genes from Steps 1–3 to apply a translational neuropathology approach (Step 4) whereby protein-coding genes needed to exhibit monotonic directionality and associate with local neuropathologic markers (tau and amyloid-β) or global measures of AD pathology (Braak stage and Thal phase). Once genes were prioritized, biological significance was investigated first by expanding the RNA-Seq cohort to a total of n = 182 in NanoString analyses. Machine learning was applied to NanoString data using the random forest algorithm (Step 5). Random forest was applied to the phenotypic groups, in addition to controls versus all AD subtypes (depicted by green versus white bar) to identify the top five genes predictive of hippocampal vulnerability in AD as a whole. This enabled us to utilize objective classification of disease spectrum to uncover transcriptomic changes that underlie selective vulnerability of the hippocampus in AD. AD, Alzheimer’s disease; DE, differential expression; HpSp, Hippocampal sparing; Limbic, limbic predominant; RNA-Seq, RNA sequencing. Note: Numbers in boxes represent total gene number from each part of workflow. Steps 1–3 culminated in 339 unique genes, of which 19 overlapped in one or more of the steps. *In Step 4, one gene appeared in both groups.
Fig. 3
Fig. 3. Transcriptomic analysis reveals an abundance of downregulated genes across the disease spectrum of hippocampal vulnerability in AD.
a, b Venn diagram depicting the number of genes that were downregulated (a) or upregulated (b) in the representative phenotype (black) or extreme phenotype (purple). There was no overlap in upregulated genes. c Waterfall plot of the top ten upregulated or downregulated genes from each phenotype. d, e Process networks in the representative phenotype (black [d]) and extreme phenotype (purple [e]) reveal non-overlapping functions. f, g Examples of genes selected from the literature that exhibit monotonic directionality. SIRT1 is monotonically upregulated (f) while PSEN2 is monotonically downregulated (statistical values can be found in Supplementary Fig. 2) (g). hj Digital pathology examples of immunohistochemistry and burden analysis markup using h CP13, i Ab39, and j 33.1.1 antibodies in CA1 subsector of the hippocampus of typical AD brains. Digital pathology measures were performed in those with sufficient tissue for serial immunohistochemical staining (n = 54/55 for RNA-Seq cohort and n = 170/182 for NanoString cohort). k, l Volcano plots showing fold change versus significance in the representative phenotype (k) and the extreme phenotype (l). Volcano plots reveal number of differentially expressed genes out of the total number of genes and subsequently show each step of our prioritization process: Step 1, literature-based genes (dark orange); Step 2a, differentially expressed genes (tan); Step 2b, bioinformatic prioritization of differentially expressed genes (orange); Step 3, process networks (magenta); and Step 4, translational neuropathology approach to identify NanoString validation genes (blue outline). AD, Alzheimer’s disease; IHC, immunohistochemistry; RNA-Seq, RNA sequencing; Sig Transd, signal transduction. Note: Box plots in f, g are derived from n = 55 independent samples. Box plots are displayed at the 25th and 75th percentiles with the median line. Whiskers are drawn to the largest and smallest values that are within 1.5 times the interquartile range from the upper or lower quartile. For observations larger or smaller than this distance, they are shown as observations outside the whiskers.
Fig. 4
Fig. 4. Implementation of machine learning to prioritize disease-relevant genes that associate with AD pathology and cognitive decline.
a Minimum depth plot generated using random forest algorithm identified the top five genes predictive of neuropathologically diagnosed AD based on summary of gene position within AD versus control generated trees: SERPINA5, RYBP, SLC38A2, FEM1B, PYDC1. b Multiway importance plot depicting all genes used in random forest analysis. The top five are highlighted in coral, demonstrating the importance of low minimum depth (x-axis) and high root frequency (y-axis). c Gene expression values were built into a logistic regression model along with age and sex to estimate the ability of the top five genes to discriminate between neuropathologically diagnosed AD and controls. Receiver operating characteristic reveals high discrimination with an area under the curve of 92.6%. d Nomogram showing the predictive value of neuropathologically diagnosed AD for each of the top five genes along with age and sex. The final predictive value is determined by adding up points from each variable. See Supplementary Fig. 10 for example of utilization. e Predictive value of each case and control compared to Braak tangle stage demonstrates higher predictive values corresponding to higher stages. f Predictive value of each case and control compared to Thal amyloid phase demonstrates higher predictive values corresponding to higher phases. g Predictive value of each case and control with corresponding last MMSE score shows higher cognitive function corresponds with lower predictive value from nomogram. h Radar plot depicting the overlay of each of the five genes regressed on demographics and digital pathology measures of tau, Aβ, and cell-specific markers. Radar plot axes correspond to coefficient of partial determination for each of these regressors in the individual models. Additional statistics for radar plot can be found in Supplementary Fig. 11. AD, Alzheimer’s disease; AUC, area under the curve; MMSE, Mini Mental Status Examination. Note: Box plots in e and f are derived from n = 181 and n = 180 independent samples, respectively. Box plots are displayed at the 25th and 75th percentiles with the median line. Whiskers are drawn to the largest and smallest values that are within 1.5 times the interquartile range from the upper or lower quartile. For observations larger or smaller than this distance, they are shown as observations outside the whiskers.
Fig. 5
Fig. 5. SERPINA5 gene expression changes differ among AD subtypes and track with advanced neurofibrillary tangle pathology.
a, b SERPINA5 expression increases in a monotonic fashion among AD subtypes in the RNA-Seq cohort (a), which was replicated in the larger NanoString cohort (b). c SERPINA5 gene expression from NanoString cohort associates with % burden of advanced tangle maturity marker Ab39 using two-sided Pearson correlation analysis. d Immunohistochemical investigation of SERPINA5 in controls (n = 10) and among AD subtypes (n = 20 per subtype) reveals a monotonic increase in hippocampal subsectors and a monotonic decrease in the association cortices. Pair-wise comparisons for graphs can be found in Supplementary Fig. 2. Scale bar represents 100 µm. AD, Alzheimer’s disease; Aβ, amyloid-β; HpSp, hippocampal sparing; Limbic, limbic predominant; RNA-Seq, RNA sequencing. Note: control cases = green, hippocampal sparing AD = red, typical AD = gray, limbic predominant AD = blue. Box plots in a and b are derived from n = 55 and n = 182 independent samples, respectively. Box plots are displayed at the 25th and 75th percentiles with the median line. Whiskers are drawn to the largest and smallest values that are within 1.5 times the interquartile range from the upper or lower quartile. For observations larger or smaller than this distance, they are shown as observations outside the whiskers.
Fig. 6
Fig. 6. SERPINA5 is a tau interactor expressed in neurofibrillary tangles and neuritic plaques.
a Cartoon depiction of the lifespan of neurofibrillary tangle maturity ranging from early to advanced forms: pretangle with punctate tau staining, mature tangle with fibrillar tau, and ghost tangle in which only the remnants of the mature tangle remain once the neuron has died. b SERPINA5 accumulates alongside, as well as colocalizes with punctate tau (Tau E178, red) in pretangles. c SERPINA5 accumulates in areas fairly devoid of tau and colocalizes along the fibrillar aspect of tau (Tau E178, red) in mature tangles. d SERPINA5 accumulates in the extracellular space and to a lesser extent colocalizes with tau (Tau pS396, red) in ghost tangles. SERPINA5 is also observed in a subset of dystrophic neurites (arrows, b–d). e Manual quantification of SERPINA5-positive neurofibrillary tangle counts in CA1 region of the posterior hippocampus shows a greater frequency of mature tangles and ghost tangles. Pretangles, mature tangles, and ghost tangles were manually quantified. f, g SEPRINA5 accumulates independently and colocalizes with tau in neuritic plaques as shown by tau (E1) staining and thioflavin-S. Immunofluorescent staining experiments were performed successfully in triplicate for AD and controls. h Immunoblot of tau (E1) using immunoprecipitated SERPINA5 demonstrates a tau-SERPINA5 protein complex in the AD brain, but not in control brain. (Left) Tissue was sampled from frozen hippocampi of a 73-year-old male control (Braak = I, Thal = 0) and an 86-year-old male AD case (Braak = V and Thal = 5). (Right) Tissue was sampled from frozen frontal cortices of a 75-year-old female control (Braak = I, Thal = 0) and a 68-year-old male AD case (Braak = VI and Thal = 5). AD, Alzheimer’s disease; Ctl, control; co-IP, co-immunoprecipitation; Thio-S, thioflavin-S. Note: uncropped western blots can be found in Supplementary Figs. 19 and 20.

Similar articles

Cited by

References

    1. Montine TJ, et al. National Institute on Aging-Alzheimer’s Association guidelines for the neuropathologic assessment of Alzheimer’s disease: a practical approach. Acta Neuropathol. 2012;123:1–11. doi: 10.1007/s00401-011-0910-3. - DOI - PMC - PubMed
    1. Thinakaran G, Koo EH. Amyloid precursor protein trafficking, processing, and function. J. Biol. Chem. 2008;283:29615–29619. doi: 10.1074/jbc.R800019200. - DOI - PMC - PubMed
    1. O’Brien RJ, Wong PC. Amyloid precursor protein processing and Alzheimer’s disease. Annu. Rev. Neurosci. 2011;34:185–204. doi: 10.1146/annurev-neuro-061010-113613. - DOI - PMC - PubMed
    1. Alonso A, Zaidi T, Novak M, Grundke-Iqbal I, Iqbal K. Hyperphosphorylation induces self-assembly of tau into tangles of paired helical filaments/straight filaments. Proc. Natl Acad. Sci. USA. 2001;98:6923–6928. doi: 10.1073/pnas.121119298. - DOI - PMC - PubMed
    1. Ballatore C, Lee VM, Trojanowski JQ. Tau-mediated neurodegeneration in Alzheimer’s disease and related disorders. Nat. Rev. Neurosci. 2007;8:663–672. doi: 10.1038/nrn2194. - DOI - PubMed

Publication types

MeSH terms