. 2021 Apr 19;12(1):2319.
doi: 10.1038/s41467-021-22581-7.

Energy implications of the 21st century agrarian transition

Affiliations

Energy implications of the 21st century agrarian transition

Lorenzo Rosa et al. Nat Commun. .

Erratum in

Abstract

The ongoing agrarian transition from small-holder farming to large-scale commercial agriculture is reshaping systems of production and human well-being in many regions. A fundamental part of this global transition is manifested in large-scale land acquisitions (LSLAs) by agribusinesses. Its energy implications, however, remain poorly understood. Here, we assess the multi-dimensional changes in fossil-fuel-based energy demand resulting from this agrarian transition. We focus on LSLAs by comparing two scenarios of low-input and high-input agricultural practices, exemplifying systems of production in place before and after the agrarian transition. A shift to high-input crop production requires industrial fertilizer application, mechanization of farming practices and irrigation, which increases by ~5 times fossil-fuel-based energy consumption compared to low-input agriculture. Given the high energy and carbon footprints of LSLAs and concerns over local energy access, our analysis highlights the need for an approach that prioritizes local resource access and incorporates energy-intensity analyses in land use governance.


Conflict of interest statement

The authors declare no competing interests.

Figures

Fig. 1
Fig. 1. Geographical distribution of large-scale land acquisitions (LSLAs) considered in this study.
We consider 197 land deals for agricultural use for which the geographic coordinates were available in the Land Matrix database. These land deals are located in 39 countries and account for 4.07 million hectares of acquired land across Africa (73 deals, 2.4 Mha), Asia (43 deals and 0.58 Mha), Europe (33 deals and 0.54 Mha), and Latin America (11 deals and 0.55 Mha).
Fig. 2
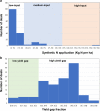
Fig. 2. Nitrogen application rates and yield gap closure levels before large-scale land acquisition (LSLA).
a Shows average synthetic nitrogen application per harvested hectare in each deal (kg N per ha). An application smaller than 30 kg ha−1 is considered low-input agriculture; between 30 and 100 kg ha−1 medium-input agriculture; and greater than 100 kg ha−1 fairly high-input agriculture. b Agricultural productivity levels measured in terms of yield-gap fraction of major crops before LSLAs. Yield-gap fractions lower than 0.3 show land deals involving lands with high agricultural productivity. Data source: Mueller et al..
Fig. 3
Fig. 3. Fossil-fuel-based energy intensity at the farm level of low- and high-input agriculture.
Fossil-fuel-based energy inputs are from labor, machinery, fertilizers, chemicals, fuels, and seeds. See Supplementary Table 1 for data sources.
Fig. 4
Fig. 4. Intended crops for agricultural use over large-scale land acquisitions (LSLAs) and their aggregate fossil energy footprint under low- and high-input agriculture scenarios.
a Area (Mha) of intended crops for the sample of 197 land deals intended for agricultural use with size greater than 200 hectares, obtained from the Land Matrix dataset. b Aggregated fossil-fuel-based energy input (million GJ yr−1) for the intended crop area under low- and high-input agricultural scenarios. c Aggregated fossil energy intensity of low- and high-input agriculture over LSLAs. Energy inputs from oil palm and jatropha milling were not accounted for in this assessment. Source: Estimates based on data from Supplementary Table 1 and Land Matrix). Note: one barrel of oil equivalent is equal to 6.1 GJ.
Fig. 5
Fig. 5. Energy demand from irrigation over large-scale land acquisitions (LSLAs).
a, b Average irrigation energy-intensity per region and per crop, respectively. c Aggregated irrigation energy requirements (million GJ yr−1) for the intended crop area to biofuels and food crop plantations. Irrigation scenarios consider one with sprinkler irrigation systems and one with surface irrigation systems.

References

    1. Pingali PL. Green revolution: impacts, limits, and the path ahead. Proc. Natl Acad. Sci. USA. 2012;109:12302–12308. - PMC - PubMed
    1. Burney JA, Davis SJ, Lobell DB. Greenhouse gas mitigation by agricultural intensification. Proc. Natl Acad. Sci. USA. 2010;107:12052–12057. - PMC - PubMed
    1. Pellegrini P, Fernández RJ. Crop intensification, land use, and on-farm energy-use efficiency during the worldwide spread of the green revolution. Proc. Natl Acad. Sci. USA. 2018;115:2335–2340. - PMC - PubMed
    1. Hamant O. Plant scientists can’t ignore Jevons paradox anymore. Nat. Plants. 2020;6:720–722. - PubMed
    1. Grafton RQ, et al. The paradox of irrigation efficiency. Science. 2018;361:748–750. - PubMed

Publication types

LinkOut - more resources