. 2021 Apr 19;12(1):2327.
doi: 10.1038/s41467-021-22572-8.

STING enhances cell death through regulation of reactive oxygen species and DNA damage

Affiliations

STING enhances cell death through regulation of reactive oxygen species and DNA damage

Thomas J Hayman et al. Nat Commun. .

Abstract

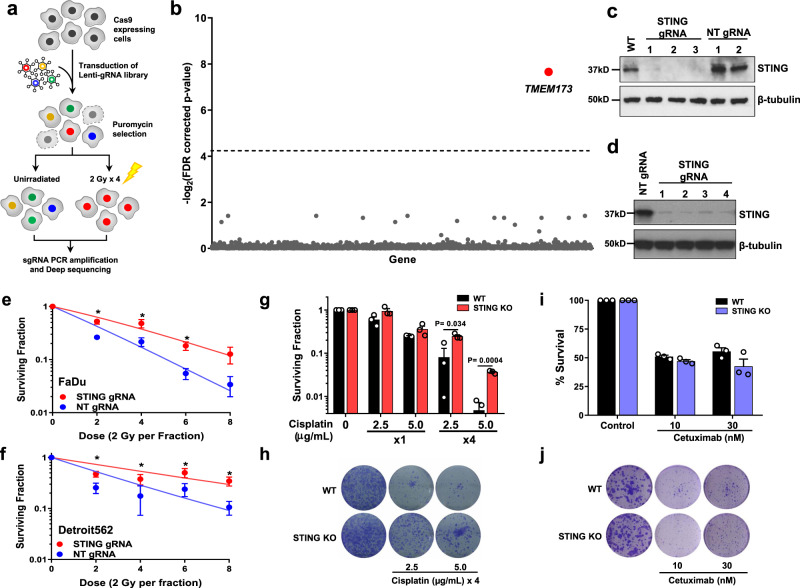
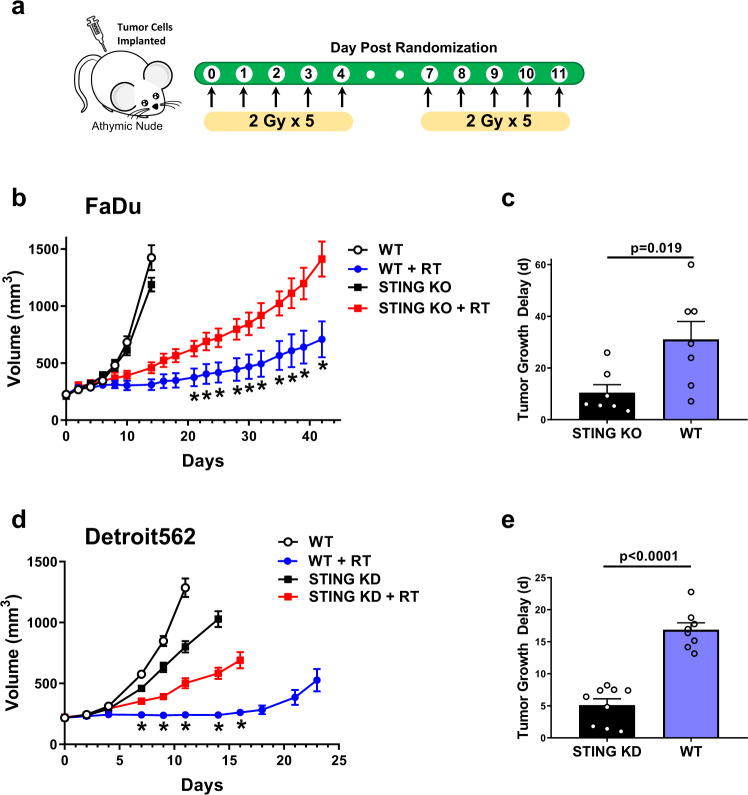
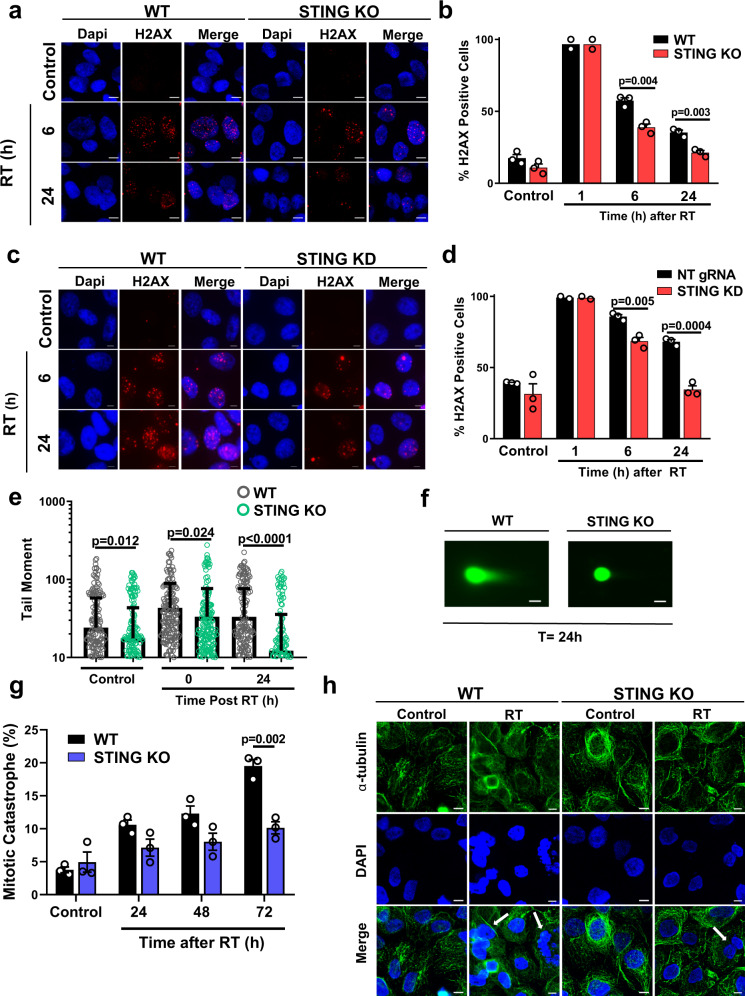
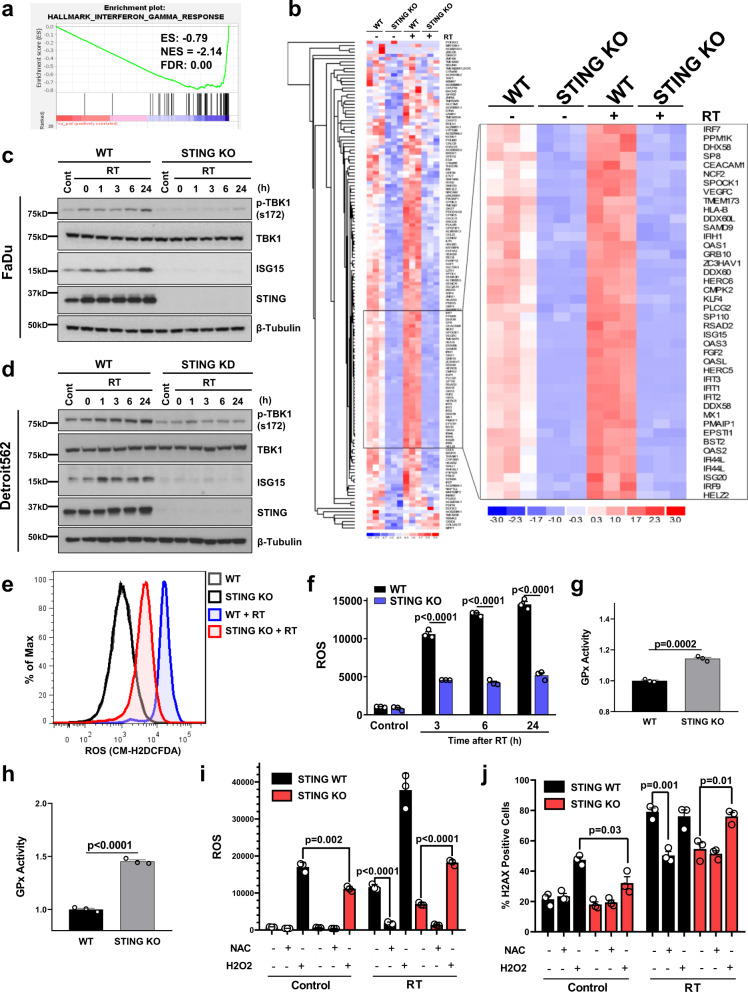
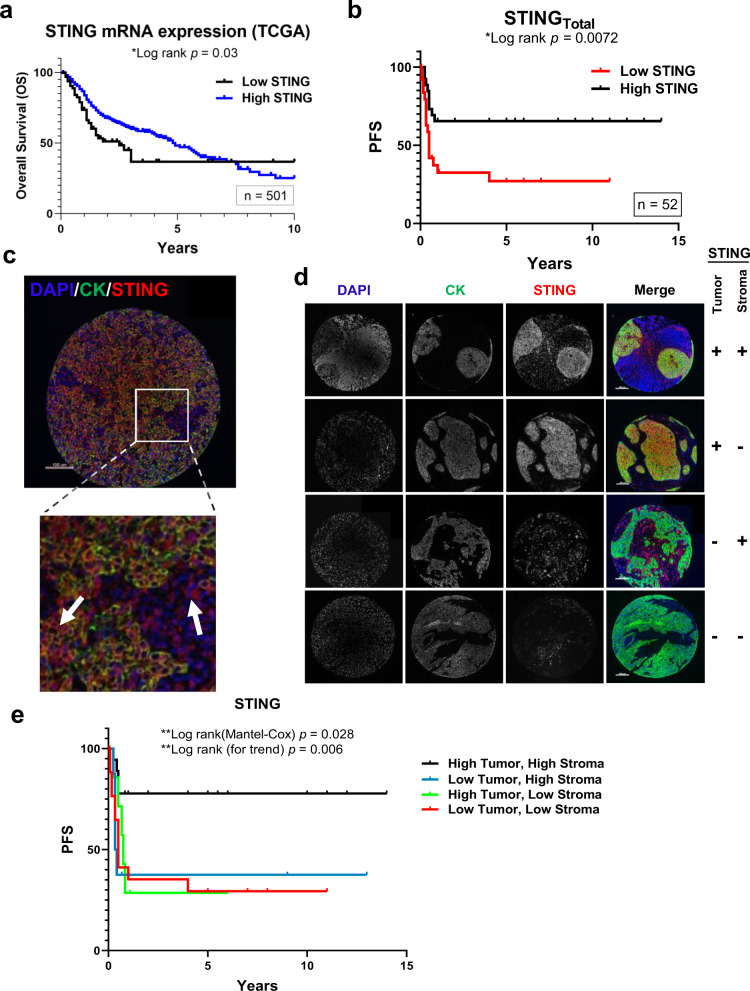
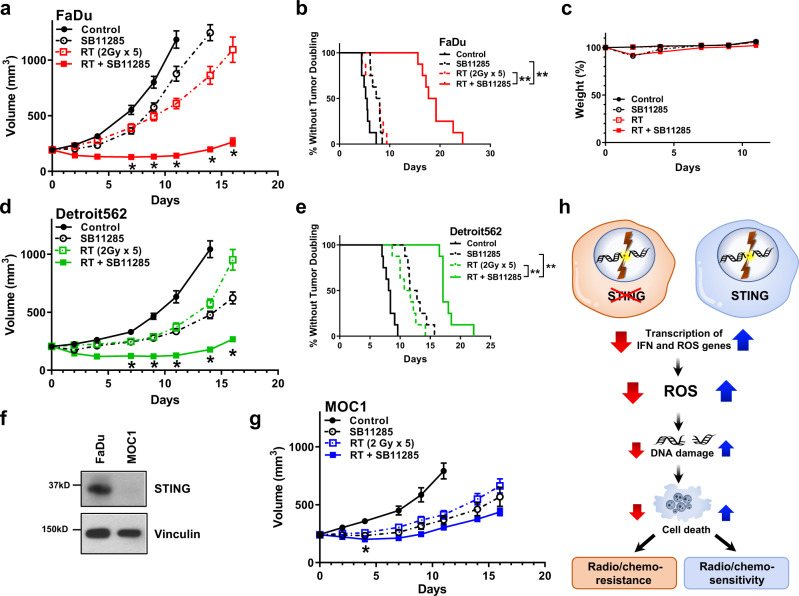
Resistance to DNA-damaging agents is a significant cause of treatment failure and poor outcomes in oncology. To identify unrecognized regulators of cell survival we performed a whole-genome CRISPR-Cas9 screen using treatment with ionizing radiation as a selective pressure, and identified STING (stimulator of interferon genes) as an intrinsic regulator of tumor cell survival. We show that STING regulates a transcriptional program that controls the generation of reactive oxygen species (ROS), and that STING loss alters ROS homeostasis to reduce DNA damage and to cause therapeutic resistance. In agreement with these data, analysis of tumors from head and neck squamous cell carcinoma patient specimens show that low STING expression is associated with worse outcomes. We also demonstrate that pharmacologic activation of STING enhances the effects of ionizing radiation in vivo, providing a rationale for therapeutic combinations of STING agonists and DNA-damaging agents. These results highlight a role for STING that is beyond its canonical function in cyclic dinucleotide and DNA damage sensing, and identify STING as a regulator of cellular ROS homeostasis and tumor cell susceptibility to reactive oxygen dependent, DNA damaging agents.


Conflict of interest statement

J.N.C. has a research agreement with Spring Bank Pharmaceuticals. D.L.R. has served as a consultant, advisor, or served on a Scientific Advisory Board for Amgen, Astra Zeneca, Agendia, Biocept, BMS, Cell Signaling Technology, Cepheid, Daiichi Sankyo, GSK, Merck, NanoString, Perkin Elmer, PAIGE, Sanofi, and Ultivue. He has received research funding from Astra Zeneca, Cepheid, Nanostring, Navigate/Novartis, NextCure, Lilly, Ultivue, and Perkin Elmer. B.A.B. received an honorarium from Aduro. K.L., R.I., and S.C. were employed by Spring Bank Pharmaceuticals/F-STAR. All remaining authors declare no competing interests.

Figures

Fig. 1
Fig. 1. STING loss confers resistance to DNA-damaging agents.
a Schematic of CRISPR-Cas9 screen in FaDu cells aimed at identifying regulators of DNA damage. b Scatter plot showing genes corresponding to gRNAs that were significantly enriched in irradiated populations (n = 3 independent experiments) using MAGeCK analysis. c Immunoblot of FaDu isogenic STING knockout cells constructed with three independent STING gRNAs and two non-targeting (NT) gRNAs. Immunoblots are representative of two independent experiments. d Immunoblot of Detroit562 isogenic STING knockdown (dCas9) cells. Clonogenic survival analysis of FaDu STING KO (e) or Detroit562 STING silenced (f) cells treated with the indicated dose of ionizing radiation (2 Gy per fraction/day). Immunoblots are representative of two independent experiments (NT gRNA 1 and STING gRNA 4) or one independent experiment for STING gRNAs 1–3. In e, f error bars represent SEM from three independent experiments. In e P-values for 2, 4, and 6 Gy are 0.0002, 0.0002, and 0.04 as determined by unpaired, two-tailed t-tests without multiple comparison correction. In f P-values for 2, 4, 6, and 8 Gy are 0.03, 0.049, 0.01, and 0.02 as determined by unpaired, two-tailed t-tests without multiple comparison correction. Quantification (g) and representative images (h) of clonogenic survival analysis of FaDu WT and STING KO cells treated with Cisplatin as indicated. Error bars represent SEM from three independent experiments. analyzed by unpaired, two-tailed t-tests without multiple comparison correction. Quantification (i) and representative images (j) of clonogenic survival analysis of FaDu WT and STING KO cells treated with cetuximab. Error bars represent SEM from three independent experiments.
Fig. 2
Fig. 2. STING controls the in vivo response to radiation.
a Schematic of in vivo tumor growth delay experiments and fractionated treatment protocol with ionizing radiation. b Tumor growth curves for tumors generated from WT or STING KO FaDu cells implanted subcutaneously in athymic nude mice (error bars represent SEM for n = 6 for unirradiated groups and n = 7 for irradiated groups). *P-values for 21, 23, 25, 28, 39, 32, 35, 37, 39, and 42 days are 0.04, 0.02, 0.01, 0.005, 0.003, 0.0007, 0.0003, <0.0001, <0.0001, and <0.0001 based on two-way ANOVA with Fisher’s LSD post-hoc analysis without multiple comparison correction. c Quantification of tumor growth delay from radiation treatment (time to reach 600 mm3) from b (error bars represent SEM of n = 7 WT tumors and n = 7 STING KO tumors; P-value from unpaired, two-tailed Student’s t test). d Tumor growth delay curves from WT or STING silenced Detroit562 tumors (error bars represent SEM of n = 9 tumors for STING KD + RT group and n = 8 for all others). *P-values for 7, 9, 11, 14, and 16 days are 0.049, 0.002, <0.0001, <0.0001, and <0.0001 based on two-way ANOVA with Sidak post-hoc multiple comparison correction. e Quantification of tumor growth delay from radiation treatment (time to reach 600 mm3) from d (error bars represent SEM of n = 8 WT tumors and n = 9 STING KD tumors; P-value from unpaired, two-tailed Student’s t test).
Fig. 3
Fig. 3. STING loss reduces radiation-induced DNA damage.
Representative images (a) and quantification (b) of radiation-induced γH2AX foci in WT and STING KO FaDu cells at the indicated times after RT (1 Gy × 4). Representative images (c) and quantification (d) of radiation-induced γH2AX foci in WT and STING KD Detroit562 cells at the indicated times after RT (1 Gy × 4). In a and c scale bares are 10 μm. In b and d error bars represent SEM from 2 (1 h post RT) or 3 (0 Gy, 6 and 24 h post RT) independent experiments, analyzed by unpaired, two-tailed t-tests without multiple comparison correction. Quantification (e) and representative images (f) of neutral comet assay foci performed in WT and STING KO FaDu cells at the indicated times after RT. Error bars in e represent SD for at least 195 cells from three independent experiments, scale bar is 30 μm, analyzed by unpaired, two-tailed t-tests without multiple comparison correction. Quantification (g) and representative images (h) of radiation-induced mitotic catastrophe in WT and STING KO FaDu cells at the indicated times after RT (1 Gy × 4). Arrows highlight examples of cells with multiple distinct nuclear lobes, a marker of mitotic catastrophe. Error bars represent SEM from three independent experiments, scale bar is 10 μm, analyzed by unpaired two-tailed t-test with Bonferroni–Sidak multiple comparison correction.
Fig. 4
Fig. 4. STING loss alters the cellular transcriptome and ROS homeostasis.
a Gene set enrichment analysis (GSEA) plot of Hallmark IFNγ response in FaDu WT and STING KO cells. b Heatmap of the top 150 significantly downregulated genes in STING KO cells compared with WT. The inset identifies several critical genes in the ROS and ISG15 pathway with inhibited expression at baseline and prevention of radiation-induced expression. Immunoblots in FaDu (c) and Detroit562 cells (d) examining baseline and radiation-induced STING pathway activation for STING-regulated genes identified by RNA-Seq analysis. Immunoblots are representative of two independent experiments. Representative curves (e) and quantification (f) of flow cytometry-based analysis of ROS (measured by CM-H2DCFDA) in FaDu WT and STING KO cells. Error bars represent SEM from three independent experiments, analyzed by unpaired, two-tailed t-test without multiple comparison correction. Analysis of glutathione peroxidase (GPx) activity in FaDu WT and STING KO cells at baseline (g) and after radiation (h). In g and h error bars represent SEM from three independent experiments, analyzed by unpaired, two-tailed Student’s t test. i Flow cytometry-based analysis of ROS (measured by CM-H2DCFDA) in FaDu WT and STING KO cells treated with NAC (2 mM) or H2O2 (10 μM), or 6 h after RT (2 Gy × 4). Error bars represent SD from three independent experiments, analyzed by unpaired, two-tailed t-test. j Analysis of γH2AX foci in WT and STING KO FaDu cells treated with NAC (2 mM) or H2O2 (10 μM), or 6 h after RT (1 Gy × 4). Error bars represent SEM from three independent experiments, analyzed by unpaired, and two-tailed t-test without multiple comparison correction.
Fig. 5
Fig. 5. STING expression and outcomes in HNSCC.
a Kaplan–Meier curves of HNSCC TCGA cohort stratified by STING mRNA expression (low vs high). b Kaplan–Meier curves of patients stratified by total STING expression (low vs high). c Representative images of TMA spot from b stained for DAPI, cytokeratin (tumor mask), and STING. Arrows indicated STING staining in both compartments (tumor and stroma). d Representative images of TMA spots illustrating grouping of TMA specimens into four groups based upon compartmental STING expression. Each patient specimen was stained once due to lack of material, with images representative of their respective groups: b (from entire patient cohort) or d (groups defined in e). e Kaplan–Meier curves of patients stratified by four groups identified in d. All statistical analysis was performed by log-rank testing with P-values as indicated in graphs. Scale bars are 100 μm in c and d.
Fig. 6
Fig. 6. Novel STING agonist SB11285 enhances in vivo response to radiation therapy.
a FaDu tumor growth curves for each treatment group. Error bars represent the SEM of n = 8 mice per treatment group; *P-values for 7, 9, 11, 14, and 16 days are 0.0007, 0.0003, 0.0002, 0.0007, and 0.002 (RT + SBP11285 compared to RT) based on two-way ANOVA with Sidak post-hoc multiple comparison correction. b Kaplan–Meier curves of percent tumors without tumor doubling (400 mm3). Statistical analysis was performed by log-rank testing (n = 8 per treatment group), with **P < 0.0001. c Weight as stratified by treatment group (n = 8 mice per group). d Detroit 562 growth curves for each treatment group. Error bars represent the SEM of n = 8 mice per treatment group; *P-values for 7, 9, 11, 14, and 16 days are 0.001, 0.002, 0.002, 0.0002, and 0.002 (RT + SBP11285 compared to RT) based on two-way ANOVA with Sidak post-hoc multiple comparison correction. e Kaplan–Meier curves of percent tumors without tumor doubling (400 mm3). Statistical analysis was performed by log-rank testing (n = 8 per treatment group), with **P < 0.0001. f Western blots of STING expression in FaDu and MOC1 cells and are representative of two independent experiments. g MOC1 tumor growth curves for each treatment group. Error bars represent the SEM of n = 6 mice per treatment group; *P = 0.03 (RT + SBP11285 compared to RT) based on two-way ANOVA with Sidak post-hoc multiple comparison correction. h Proposed model of tumor intrinsic STING loss leading to treatment resistant phenotype.

References

    1. Morgan MA, Lawrence TS. Molecular pathways: overcoming radiation resistance by targeting DNA damage response pathways. Clin. Cancer Res. 2015;21:2898–2904. doi: 10.1158/1078-0432.CCR-13-3229. - DOI - PMC - PubMed
    1. Helleday T, Petermann E, Lundin C, Hodgson B, Sharma RA. DNA repair pathways as targets for cancer therapy. Nat. Rev. Cancer. 2008;8:193–204. doi: 10.1038/nrc2342. - DOI - PubMed
    1. Cheung-Ong K, Giaever G, Nislow C. DNA-damaging agents in cancer chemotherapy: serendipity and chemical biology. Chem. Biol. 2013;20:648–659. doi: 10.1016/j.chembiol.2013.04.007. - DOI - PubMed
    1. Pearl LH, Schierz AC, Ward SE, Al-Lazikani B, Pearl FMG. Therapeutic opportunities within the DNA damage response. Nat. Rev. Cancer. 2015;15:166–180. doi: 10.1038/nrc3891. - DOI - PubMed
    1. Sies H, Jones DP. Reactive oxygen species (ROS) as pleiotropic physiological signalling agents. Nat. Rev. Mol. Cell Biol. 2020;21:363–383. doi: 10.1038/s41580-020-0230-3. - DOI - PubMed

Publication types