. 2021 Apr 19;12(1):2324.
doi: 10.1038/s41467-021-22649-4.

Short-range quorum sensing controls horizontal gene transfer at micron scale in bacterial communities

Affiliations

Short-range quorum sensing controls horizontal gene transfer at micron scale in bacterial communities

Jordi van Gestel et al. Nat Commun. .

Abstract

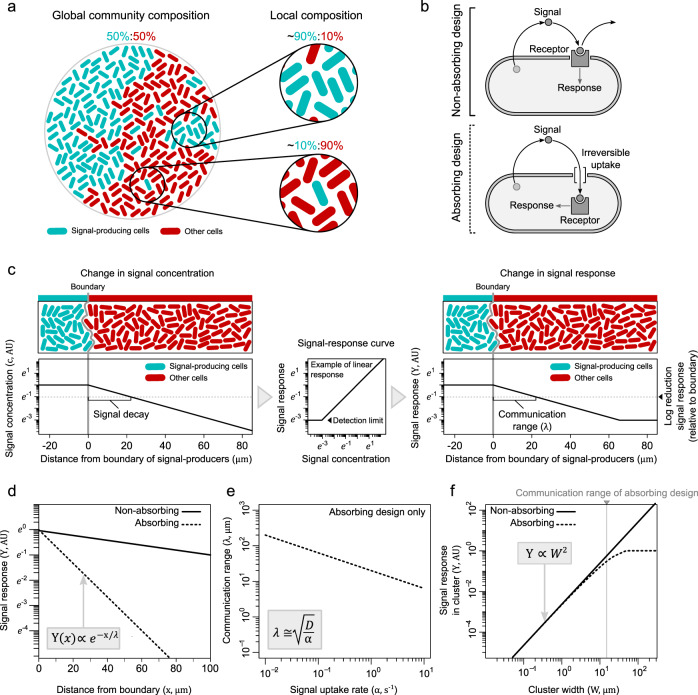
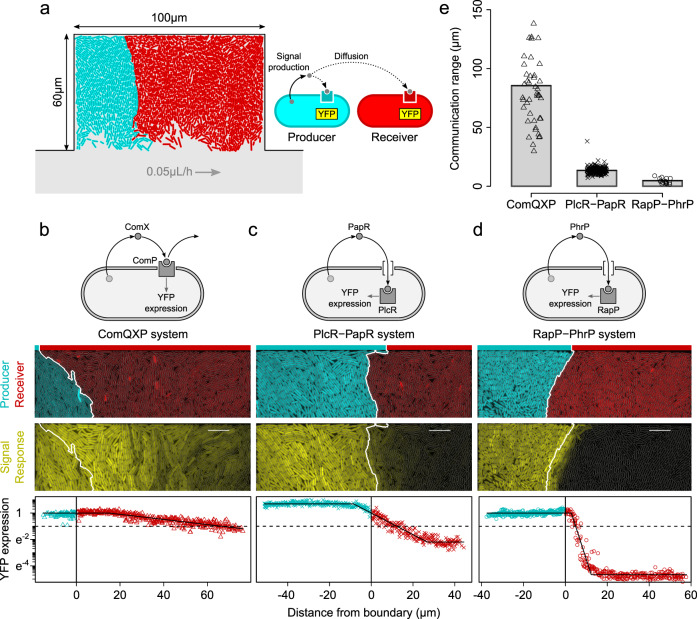
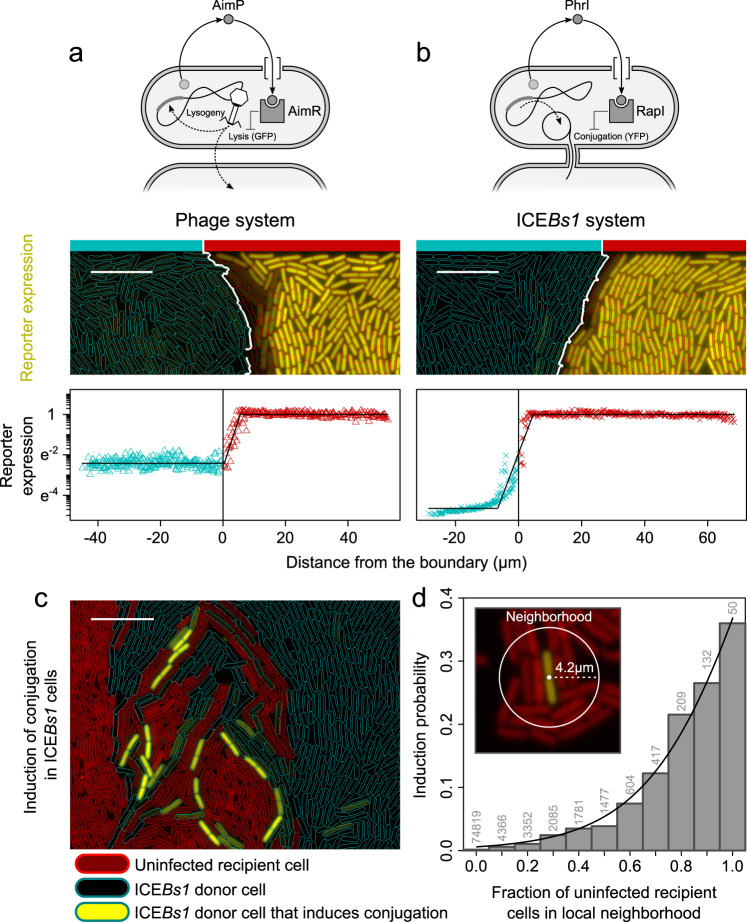
In bacterial communities, cells often communicate by the release and detection of small diffusible molecules, a process termed quorum-sensing. Signal molecules are thought to broadly diffuse in space; however, they often regulate traits such as conjugative transfer that strictly depend on the local community composition. This raises the question how nearby cells within the community can be detected. Here, we compare the range of communication of different quorum-sensing systems. While some systems support long-range communication, we show that others support a form of highly localized communication. In these systems, signal molecules propagate no more than a few microns away from signaling cells, due to the irreversible uptake of the signal molecules from the environment. This enables cells to accurately detect micron scale changes in the community composition. Several mobile genetic elements, including conjugative elements and phages, employ short-range communication to assess the fraction of susceptible host cells in their vicinity and adaptively trigger horizontal gene transfer in response. Our results underscore the complex spatial biology of bacteria, which can communicate and interact at widely different spatial scales.


Conflict of interest statement

The authors declare no competing interests.

Figures

Fig. 1
Fig. 1. Predicted communication ranges in absorbing and nonabsorbing quorum-sensing systems.
a Differences in community composition at local and global spatial scales. b Quorum-sensing designs (see also Supplementary Fig. 4). c Model setup with clusters of signal-producing cells (blue) embedded in a community of nonproducers (red). In the case of linearity in both signal response and uptake, the spatial decay in the signal concentration (left) corresponds to that in signal response (right). We define the communication range (λ) as the distance from the boundary of signal producers over which the signal response reduces one order of magnitude (on a natural log scale; dashed horizontal line) (see Supplementary Discussion, Section 1.3 and Supplementary Fig. 1). d Decline in signal response (Y) in absorbing (dashed line) and nonabsorbing (solid line) systems as a function of the distance (x, in μm) from the boundary of signal producers. e Communication range as a function of signal uptake rate (α) in absorbing systems (for nonabsorbing systems α=0). Uptake rates used here are of realistic values for RNPP systems, and the signal diffusion rate used is 400 μm2 s−1 (Supplementary Discussion, Section 1.4.2). f Average signal response in clusters of signal producers with different widths (W). Equations in (ce) show analytical modeling predictions for the absorbing system. For a more detailed mathematical comparison of different quorum-sensing designs see Supplementary Discussion, Section 2.
Fig. 2
Fig. 2. Communication range in absorbing and nonabsorbing quorum-sensing systems.
a Representation of growth chamber with signal-producing (blue, marked by constitutive BFP) and signal-receiving cells (red, marked by constitutive RFP). Role of producers and receivers is illustrated on the right. Communication ranges in b ComQXP system, c PlcR-PapR system, and d RapP-PhrP system, from top to bottom: schematic depiction of quorum-sensing system (see also Supplementary Fig. 9), microscopy image with the distribution of signal producers (blue) and receivers (red) in microfluidic chamber, microscopy image of signal response (YFP expression; scale bar = 10 μm), and signal response as a function of the distance of cells to the boundary of signal producers (thick white line in microscopy images). Signal-producing cells are marked in blue with negative distances, while receivers are marked in red with positive distances. Black line marks best-fit curves (see “Methods”). Horizontal dotted line shows one order of magnitude reduction in signal response (on natural log scale). Solid vertical line in shows boundary. e Communication ranges of ComQXP, PlcR-PapR, and RapP-PhrP quorum-sensing systems (χ(2)2=141.98,p<1016). Source data are provided in Supplementary Data 1.
Fig. 3
Fig. 3. Signal uptake leads to a shorter communication range in absorbing PlcR-PapR system.
a Normalized YFP expression in signal receivers as a function of their distance to the producers in IPTG-inducible opp system and scoC knockout mutant (right, representative microscopy images). Signal producers in (a) do not express YFP. Gray lines show best fits (see “Methods”). b Communication range decreases for higher IPTG concentrations in the IPTG-inducible opp system (U=825,p=2.7×10⁵) and decreases even further in the scoC knockout (U=648,p=1.5×10⁴) (200 μM IPTG, n=24; 1000 μM IPTG, n=43; scoC, n=19; statistics show two-sided Mann–Whitney U tests without adjustments for multiple comparisons). c Representative microscopy images of differently sized clusters of signal producers. d Normalized YFP expression in isolated clusters of signal producers as a function of their half-width (blue dots), observed YFP expression (n=362 chambers). YFP levels are normalized to their maximal levels; black line, theoretical prediction based on the measured communication range (see “Methods”); vertical dashed line, the communication range of PlcR-PapR system. Enlarged data points 1–3 correspond to three co-occurring clusters of signal producers visualized in (e). e Observed (dots) and predicted (grid surface) YFP expression in chamber with three co-occurring clusters of signal-producing cells. f Communication range as a function of the cluster size for clusters wider than 3 μm (linear regression: intersect = 14.8±0.5μm(s.e.), slope = 0.04±0.01μm, p=0.0014,n=213 chambers). Microscopy images: blue bars = region of signal producers; red bars = region of signal receivers; yellow = signal response; scale bar = 10 μM. Source data are provided in Supplementary Data 1.
Fig. 4
Fig. 4. Short-range communication regulates horizontal gene transfer.
Quorum-sensing systems of a phage system (φ3T) and b integrative conjugative element (ICEBs1). From top to bottom: scheme of quorum-sensing system, distribution of signal producers (blue outlines) and receivers (red outlines) and their reporter expression, GFP expression for φ3T system (artificially colored yellow), and YFP expression for ICEBs1 system (scale bar = 10 μm), and reporter expression as a function of the distance of cells to the boundary of signal producers. Reporter gene expression indicates induction of horizontal gene transfer: lytic lifestyle for phage system and conjugation for ICEBs1 element. Black line marks best-fit curves (see “Methods”). The zone of inhibition is determined by the spatial distance from the boundary of signal producers, where we observe repression in reporter gene expression (Supplementary Fig. 19). c Representative microscopy image of coculture of ΔconB ICEBs1 donor cells (blue outline) and uninfected recipient cells (red outline) (scale bar = 10  μm). Donor cells that express YFP induce conjugation. d Induction probability as a function of fraction of uninfected recipient cells in the local neighborhood (n=89, 292 cells; numbers above bars in plot show how cells are distributed across neighborhoods). Neighborhood size is determined by the zone of inhibition. Induction probability increases significantly with fraction of uninfected recipient cells in the local neighborhood (regression: y=11+eax+b;a=4.7±0.2s.e.,pa<109;b=1.1±0.01,pb<1014; residuals.e.=0.01;d.f.=9). Source data are provided in Supplementary Data 1.

Similar articles

Cited by

References

    1. Wilbert SA, Mark Welch JL, Borisy GG. Spatial ecology of the human tongue dorsum microbiome. Cell Rep. 2020;30:4003–4015. doi: 10.1016/j.celrep.2020.02.097. - DOI - PMC - PubMed
    1. Waters CM, Bassler BL. Quorum sensing: cell-to-cell communication in bacteria. Annu. Rev. Cell Dev. Biol. 2005;21:319–346. doi: 10.1146/annurev.cellbio.21.012704.131001. - DOI - PubMed
    1. Yarwood JM, Bartels DJ, Volper EM, Greenberg EP. Quorum sensing in Staphylococcus aureus biofilms. J. Bacteriol. 2004;186:1838–1850. doi: 10.1128/JB.186.6.1838-1850.2004. - DOI - PMC - PubMed
    1. Darch SE, et al. Spatial determinants of quorum signaling in a Pseudomonas aeruginosa infection model. Proc. Natl Acad. Sci. USA. 2018;115:4779–4784. doi: 10.1073/pnas.1719317115. - DOI - PMC - PubMed
    1. Mukherjee S, Bassler BL. Bacterial quorum sensing in complex and dynamically changing environments. Nat. Rev. Microbiol. 2019;17:371–382. doi: 10.1038/s41579-019-0186-5. - DOI - PMC - PubMed

Publication types

MeSH terms

Substances

LinkOut - more resources