. 2021 Apr 19;11(1):8506.
doi: 10.1038/s41598-021-87893-6.

Olfactory signals and fertility in olive baboons

Affiliations

Olfactory signals and fertility in olive baboons

Stefano Vaglio et al. Sci Rep. .

Abstract

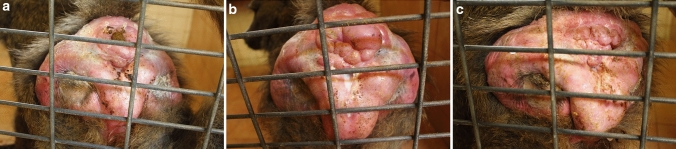
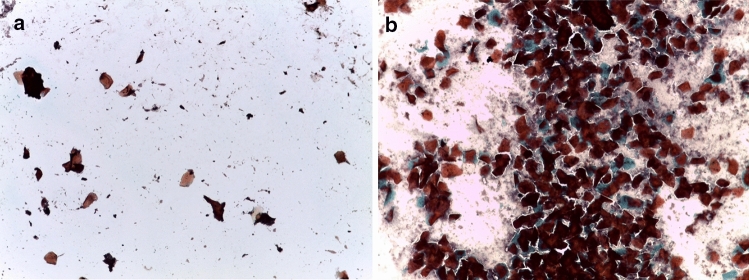
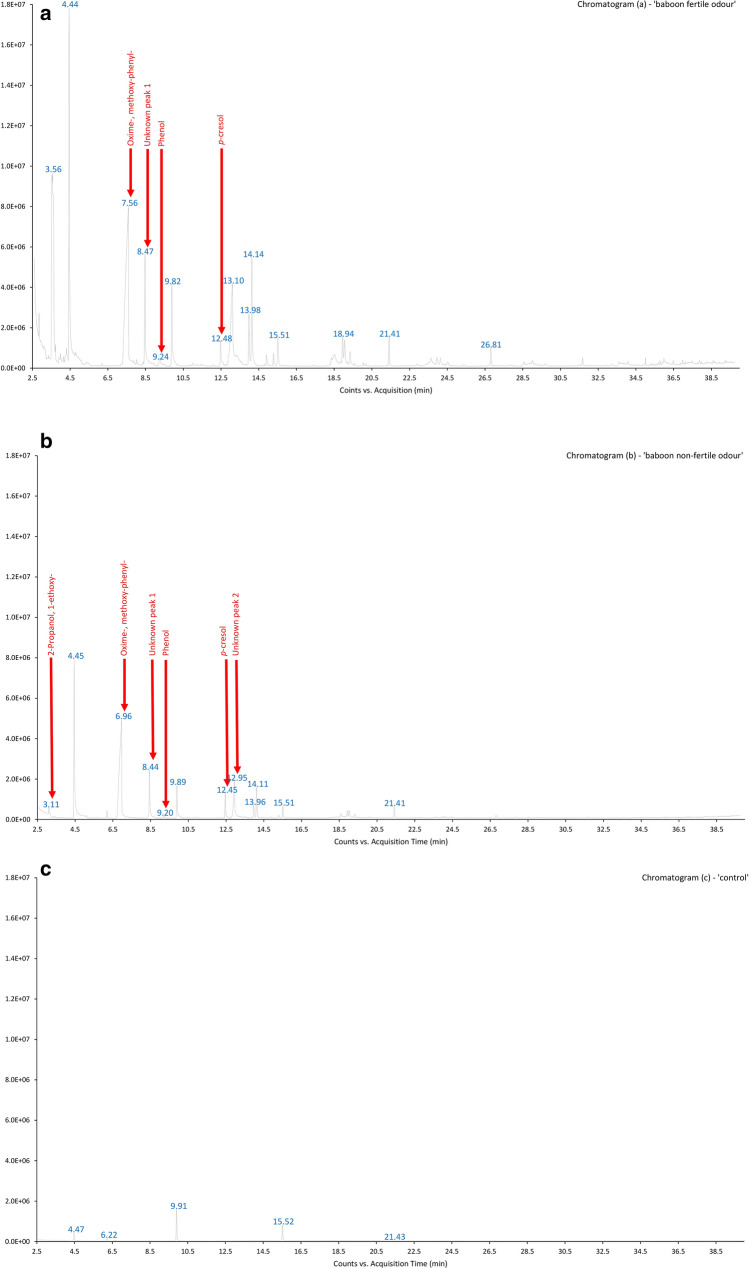
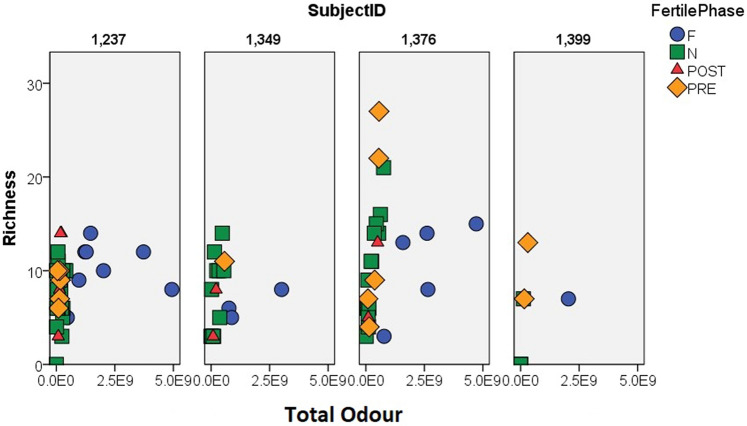
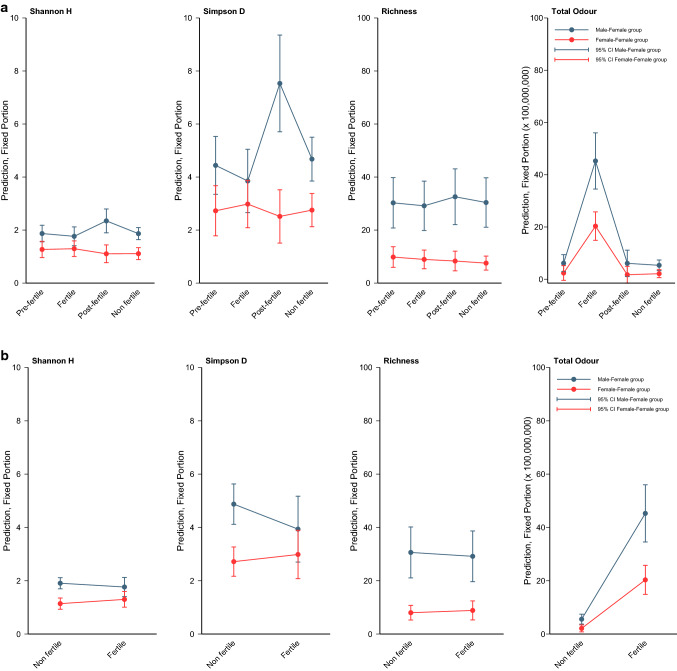
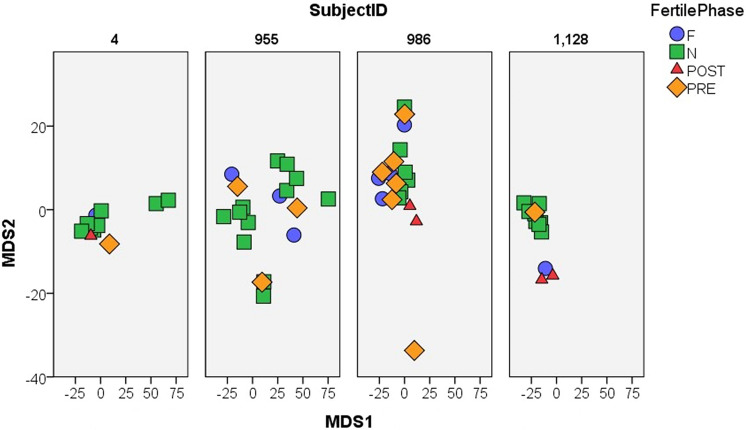
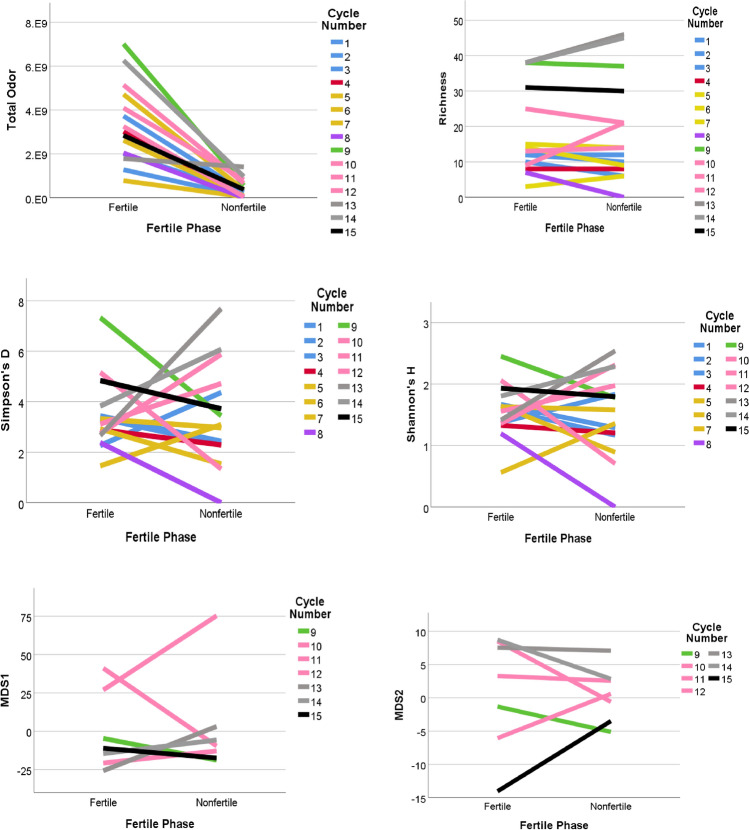
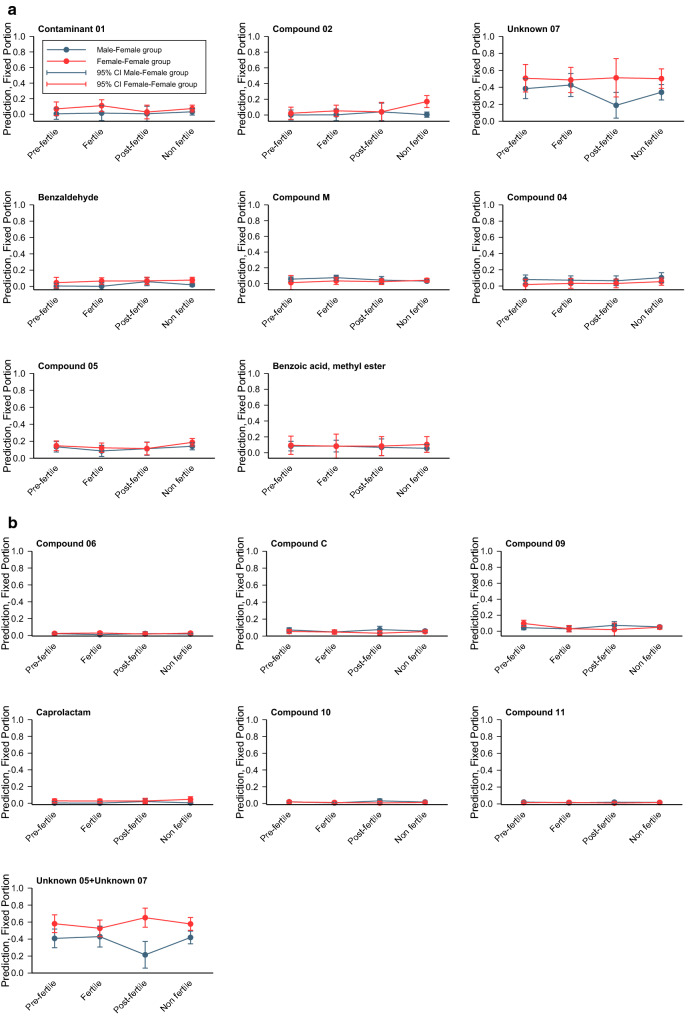
Female primates signal impending ovulation with a suite of sexual signals. Studies of these signals have focussed on visual, and to a lesser extent, acoustic signals, neglecting olfactory signals. We aimed to investigate the information content of female olfactory signals in captive olive baboons (Papio anubis) and relate these to the female fertile period. We studied eight adult females living in four groups at the CNRS Station de Primatologie, Rousset-sur-Arc, France. We used vaginal cytology to detect ovulation. We investigated the volatile component of odour signals using solid-phase microextraction and gas chromatography-mass spectrometry. We found a total of 74 volatile compounds, of which we tentatively identified 25, including several ketones, alcohols, aldehydes, terpenes, volatile fatty acids and hydrocarbons that have been identified in odour profiles of other primates. Our results show that vaginal odour intensity differs with sexual cycle stage suggesting that odour might play a role in signalling female baboon fertility. We found differences in vaginal odour between females living in all-female and in mixed sex groups but we could not distinguish the effects of group composition, female age and identity. This study of olfactory signalling improves our understanding of how female primates advertise their sexual receptivity.


Conflict of interest statement

The authors declare no competing interests.

Figures

Figure 1
Figure 1
Pictures of moderate (a), large (b) and deflating (c) genital swellings of the same female baboon across her menstrual cycle.
Figure 2
Figure 2
Genital cytology data confirming that females experienced regular receptive cycles. In comparison to the pre-ovulatory phase (a), the post-ovulatory phase (b) is marked by the return of leukocytes and mucus, as well as clumped, curled and folded cells and, quite commonly, placard or rosette arrangements of cells.
Figure 3
Figure 3
Example chromatograms from female olive baboon, vaginal odour sample from fertile period (chromatogram (a)—‘baboon fertile odour’); female olive baboon, vaginal odour sample from non-fertile period (chromatogram (b)—‘baboon non-fertile odour’); and control sample, showing contaminants (chromatogram (c)—‘control’).
Figure 4
Figure 4
Scatterplots of Total Odour (x-axis) and Richness (y-axis) for each female, showing how the samples differ by fertility phase. The top row shows the FF females. The bottom row shows the MF females. Note that the Richness scale is smaller for the FF females. For both groups, Total Odour separates the fertile phase samples from the rest. F, N, Post, and Pre are fertile, non-fertile, post-fertile, and pre-fertile, respectively. FF indicates that the females are from an all-female group. MF indicates that the females are from a group with both sexes.
Figure 5
Figure 5
Predictions of the three diversity indices and of Total Odour by using GLMM estimates of the fixed effects.
Figure 6
Figure 6
Scatterplot showing that MDS1 and MDS2 calculated from the percentage data do not separate the different cycle stages into clusters. F, N, Post, and Pre are fertile, non-fertile, post-fertile, and pre-fertile, respectively.
Figure 7
Figure 7
Comparison of the matched pairs of fertile and non-fertile samples for the 15 cycles, using Total Odour, Richness, Shannon’s H, Simpson’s D, and MDS1 and MDS2. Each line represents a cycle and the colours represent the different females. Only Total Odour shows a clear difference between non-fertile and fertile samples. Greater clustering of lines by individual (colour) indicates lower variability in the odour profile of each female.
Figure 8
Figure 8
Predictions among the 15 individual compounds with measurements above the third quartile of the distribution for FF and MF separately by using GLMMs. No compounds differed significantly between fertile and non-fertile phases.

Similar articles

Cited by

References

    1. Andersson M. Sexual Selection. Princeton University Press; 1994.
    1. van Schaik CP, van Noordwijk MA, Nunn CL. Sex and social evolution in primates. In: Lee PC, editor. Comparative Primate Socioecology. Cambridge: Cambridge University Press; 2000. pp. 204–240.
    1. Nunn CL. The evolution of exaggerated sexual swellings in primates and the graded signal hypothesis. Anim. Behav. 1999;58:246–299. doi: 10.1006/anbe.1999.1159. - DOI - PubMed
    1. Pagel M. The evolution of conspicuous oestrous advertisement in Old World monkeys. Anim. Behav. 1994;47:1333–1341. doi: 10.1006/anbe.1994.1181. - DOI
    1. Kücklich M, Weiß BM, Birkemeyer C, Einspanier A, Widding A. Chemical cues of female fertility states in a non-human primate. Sci. Rep. 2019;9:131716. doi: 10.1038/s41598-019-50063-w. - DOI - PMC - PubMed

Publication types

Substances

LinkOut - more resources