

The other-race effect and holistic processing across racial groups
- PMID: 33875735
- PMCID: PMC8055977
- DOI: 10.1038/s41598-021-87933-1
The other-race effect and holistic processing across racial groups
Abstract
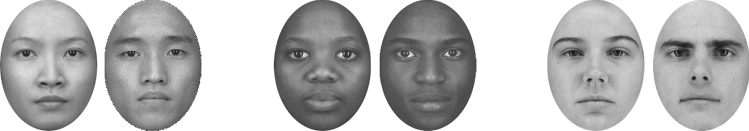
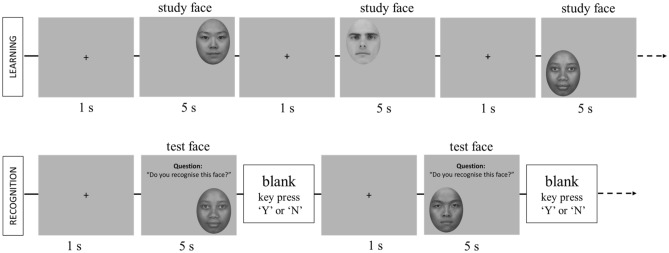
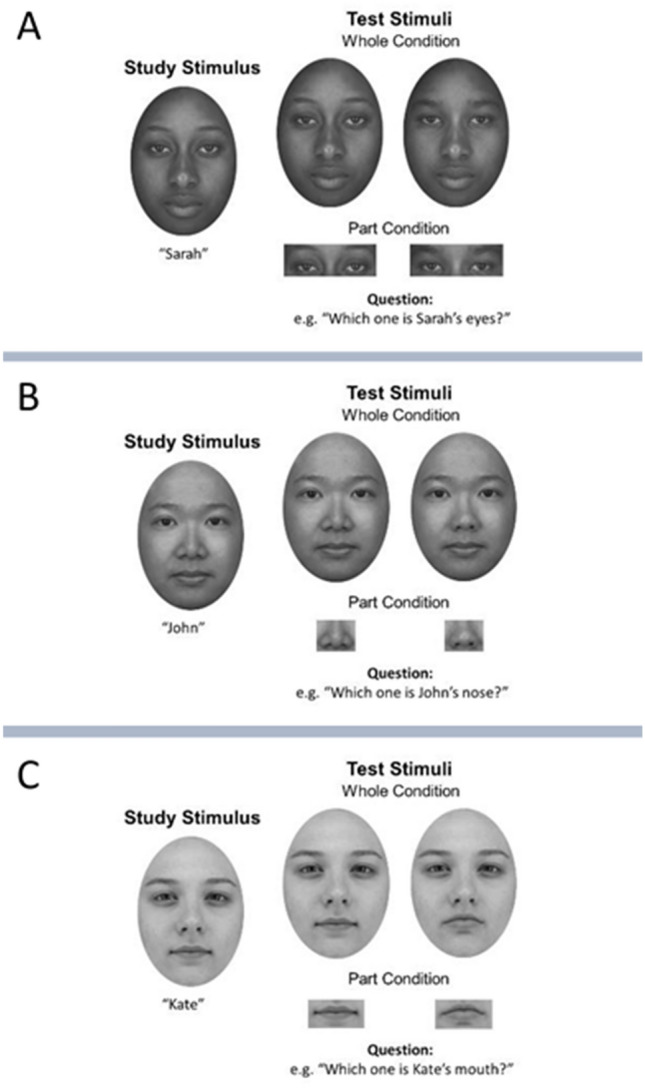
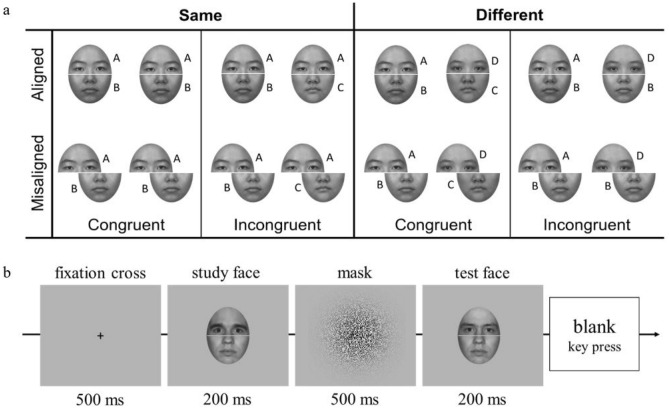
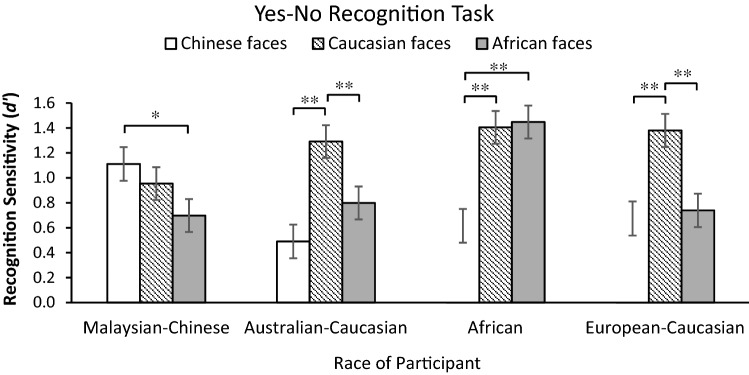
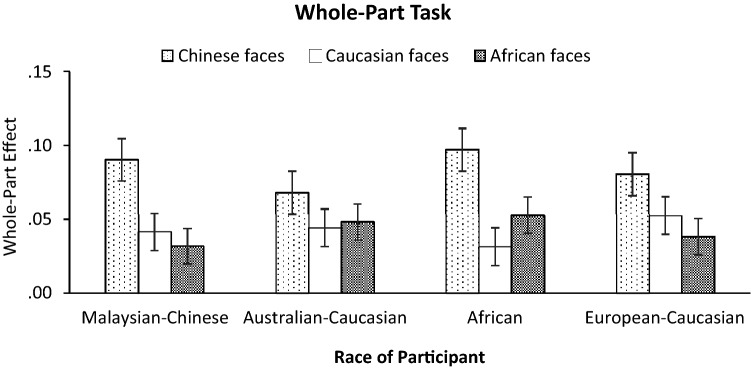
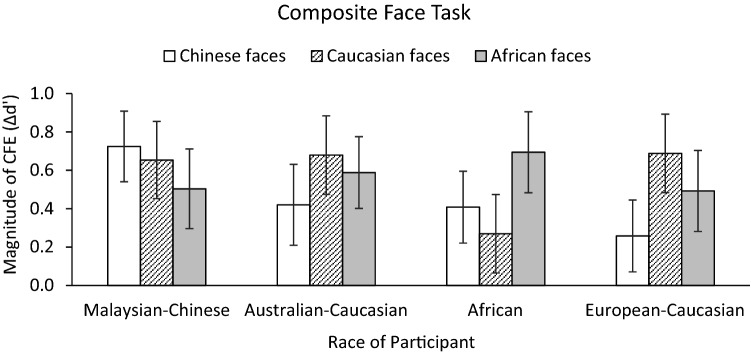
It is widely accepted that holistic processing is important for face perception. However, it remains unclear whether the other-race effect (ORE) (i.e. superior recognition for own-race faces) arises from reduced holistic processing of other-race faces. To address this issue, we adopted a cross-cultural design where Malaysian Chinese, African, European Caucasian and Australian Caucasian participants performed four different tasks: (1) yes-no face recognition, (2) composite, (3) whole-part and (4) global-local tasks. Each face task was completed with unfamiliar own- and other-race faces. Results showed a pronounced ORE in the face recognition task. Both composite-face and whole-part effects were found; however, these holistic effects did not appear to be stronger for other-race faces than for own-race faces. In the global-local task, Malaysian Chinese and African participants demonstrated a stronger global processing bias compared to both European- and Australian-Caucasian participants. Importantly, we found little or no cross-task correlation between any of the holistic processing measures and face recognition ability. Overall, our findings cast doubt on the prevailing account that the ORE in face recognition is due to reduced holistic processing in other-race faces. Further studies should adopt an interactionist approach taking into account cultural, motivational, and socio-cognitive factors.
Conflict of interest statement
The authors declare no competing interests.
Figures


Similar articles
-
Processes underlying the cross-race effect: an investigation of holistic, featural, and relational processing of own-race versus other-race faces.Perception. 2010;39(8):1065-85. doi: 10.1068/p6608. Perception. 2010. PMID: 20942358
-
Face format at encoding affects the other-race effect in face memory.J Vis. 2014 Aug 7;14(9):6. doi: 10.1167/14.9.6. J Vis. 2014. PMID: 25104831
-
Training with own-race faces can improve processing of other-race faces: evidence from developmental prosopagnosia.Neuropsychologia. 2011 Jul;49(9):2505-13. doi: 10.1016/j.neuropsychologia.2011.04.031. Epub 2011 May 6. Neuropsychologia. 2011. PMID: 21570991 Free PMC article.
-
Socio-cognitive, expertise-based and appearance-based accounts of the other-'race' effect in face perception: A label-based systematic review of neuroimaging results.Br J Psychol. 2023 May;114 Suppl 1:45-69. doi: 10.1111/bjop.12595. Epub 2022 Sep 16. Br J Psychol. 2023. PMID: 36111613
-
A hierarchy of visual processing deficits in body dysmorphic disorder: a conceptual review and empirical investigation.Cogn Neuropsychiatry. 2024 Mar;29(2):116-140. doi: 10.1080/13546805.2024.2326243. Epub 2024 Apr 2. Cogn Neuropsychiatry. 2024. PMID: 38563811 Review.
Cited by
-
The role of implicit social bias on holistic processing of out-group faces.Cogn Res Princ Implic. 2023 Jan 26;8(1):7. doi: 10.1186/s41235-023-00464-3. Cogn Res Princ Implic. 2023. PMID: 36701034 Free PMC article.
-
Multiple latent variables but functionally dependent output mappings underlying the recognition of own- and other-race faces for Chinese individuals: Evidence from state-trace analysis.Front Psychol. 2022 Jul 28;13:968956. doi: 10.3389/fpsyg.2022.968956. eCollection 2022. Front Psychol. 2022. PMID: 35967718 Free PMC article.
-
Judgment of Social Traits and Emotions of "Neutral" Avatars.Cyberpsychol Behav Soc Netw. 2025 Mar;28(3):196-201. doi: 10.1089/cyber.2024.0401. Epub 2025 Jan 6. Cyberpsychol Behav Soc Netw. 2025. PMID: 39761121
-
Two faces of holistic face processing: Facilitation and interference underlying part-whole and composite effects.J Vis. 2024 Oct 3;24(11):13. doi: 10.1167/jov.24.11.13. J Vis. 2024. PMID: 39417756 Free PMC article.
-
Face masks affect emotion categorisation, age estimation, recognition, and gender classification from faces.Cogn Res Princ Implic. 2022 Oct 8;7(1):91. doi: 10.1186/s41235-022-00438-x. Cogn Res Princ Implic. 2022. PMID: 36209185 Free PMC article.
References
-
- Meissner CA, Brigham JC. Thirty years of investigating the own-race bias in memory for faces: A meta-analytic review. Psychol. Public Policy Law. 2001;7(1):3–35. doi: 10.1037//1076-8971.7.1.3. - DOI
-
- Platz SJ, Hosch HM. Cross-racial/ethnic eyewitness identification: A field study. J. Appl. Soc. Psychol. 1988;18(11):972–984. doi: 10.1111/j.1559-1816.1988.tb01187.x. - DOI
-
- Rossion B, Michel C. An experience-based holistic account of the other-race face effect. In: Calder A, Rhodes G, Haxby JV, Johnson M, editors. The Oxford Handbook of Face Perception. Oxford University Press; 2011. pp. 215–244.
-
- Rossion B. The composite face illusion: A whole window into our understanding of holistic face perception. Vis. Cogn. 2013;21(2):1–115. doi: 10.1080/13506285.2013.772929. - DOI
MeSH terms
LinkOut - more resources
Full Text Sources
Other Literature Sources
Miscellaneous
