. 2021 Apr 19;4(1):476.
doi: 10.1038/s42003-021-02001-8.

Amplification-free RNA detection with CRISPR-Cas13

Affiliations

Amplification-free RNA detection with CRISPR-Cas13

Hajime Shinoda et al. Commun Biol. .

Abstract

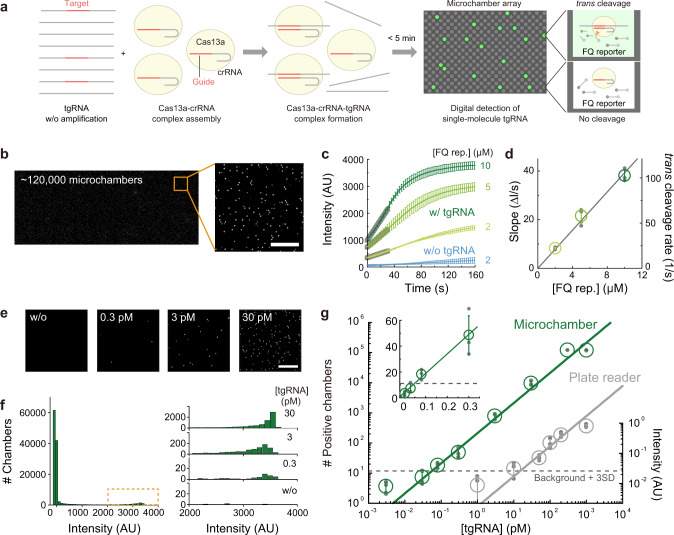
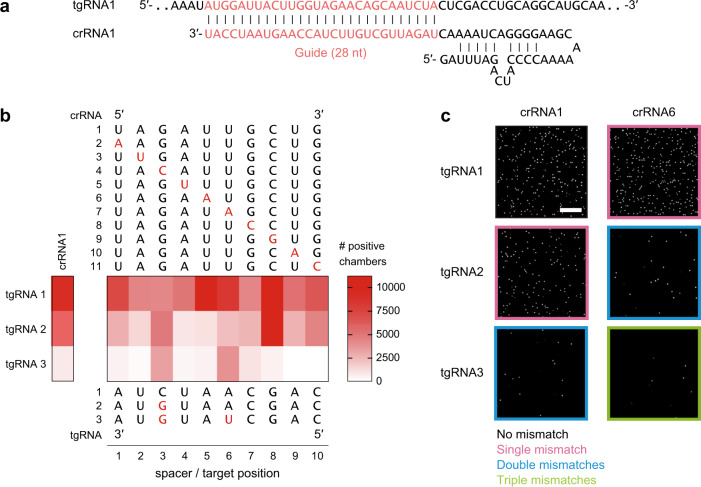
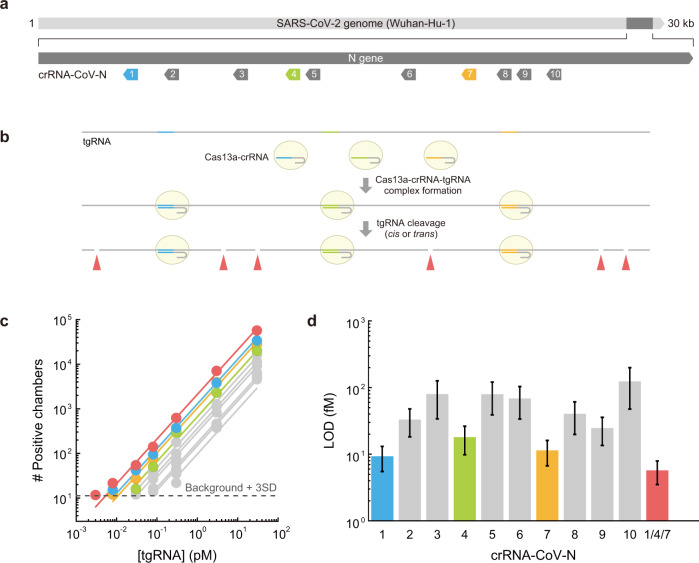
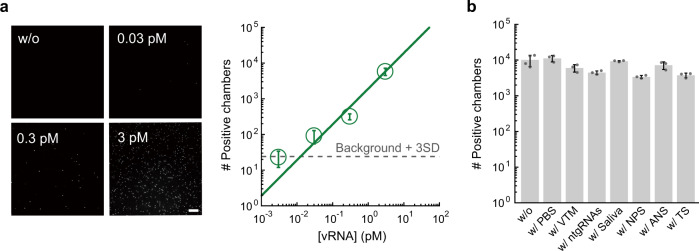
CRISPR-based nucleic-acid detection is an emerging technology for molecular diagnostics. However, these methods generally require several hours and could cause amplification errors, due to the pre-amplification of target nucleic acids to enhance the detection sensitivity. Here, we developed a platform that allows "CRISPR-based amplification-free digital RNA detection (SATORI)", by combining CRISPR-Cas13-based RNA detection and microchamber-array technologies. SATORI detected single-stranded RNA targets with maximal sensitivity of ~10 fM in <5 min, with high specificity. Furthermore, the simultaneous use of multiple different guide RNAs enhanced the sensitivity, thereby enabling the detection of the SARS-CoV-2 N-gene RNA at ~5 fM levels. Therefore, we hope SATORI will serve as a powerful class of accurate and rapid diagnostics.


Conflict of interest statement

The authors declare no competing interests.

Figures

Fig. 1
Fig. 1. Amplification-free digital RNA counting with CRISPR–Cas13 in a microchamber array device.
a Schematic illustration of SATORI. LwaCas13a–crRNA–tgRNA cleaves FQ reporters, leading to fluorescence increases in a microchamber array device. b Representative fluorescence image obtained by SATORI in the presence of 30 pM tgRNA. Forty images acquired by tiling imaging were combined. An enlarged view of the orange square is shown on the right. Scale bar is 50 μm. c, d Time course of fluorescence increase (c) and rates of trans cleavage (d) by LwaCas13a–crRNA–tgRNA with different concentrations of the FQ reporter. In c, average values of ten representative traces are shown with error bars (S.D.). In d, data are mean ± S.D. (n = 3 technical replicates). e Representative fluorescence images obtained with different concentrations of tgRNA. Scale bar is 50 μm. f Histograms of mean intensity values in each chamber (~120,000 chambers in the combined image). Enlarged views of the orange dotted box, with different concentrations of tgRNA, are shown on the right. g Comparison of LwaCas13a-mediated RNA detection methods in a microchamber device (SATORI, green) and a plate reader (gray), without recombinase polymerase amplification. Data are mean ± S.D. (n = 3 technical replicates), fitted to linear regressions. The dotted line is the value of the background mean + 3 S.D. LOD values for SATORI and the plate reader-based bulk assay were 56 fM and 11 pM, respectively.
Fig. 2
Fig. 2. Sequence specificity of SATORI.
a Sequences of the crRNA and tgRNA. b Effects of single, double, and triple mismatches on the number of positive chambers. Mutations are highlighted in red. Data are means (n = 3 technical replicates). c Representative fluorescence images obtained with different combinations of the crRNA and tgRNA sequences.
Fig. 3
Fig. 3. SARS-CoV-2 detection by SATORI.
a Schematics of the crRNAs targeting different sites in the SARS-CoV-2 N-gene (Wuhan-Hu-1). b Schematics of multiplexed SATORI. c Numbers of positive chambers obtained with the crRNAs (crRNA-CoV-N-1–10) at different concentrations of tgRNA (SARS-CoV-2 N-gene). Data with crRNA-CoV-N-1, -4, and -7 are colored blue, yellow-green, and orange, respectively, while those with a combination of these crRNAs are highlighted in red. Solid lines represent linear regressions. d LOD values of the SARS-CoV-2 N-gene RNA for different crRNAs.
Fig. 4
Fig. 4. Practicability of SATORI for clinical applications.
a Digital detection of RNA extracted from SARS-CoV-2 virus (vRNA). The representative fluorescence images and the number of positive chambers, obtained with the crRNA-CoV-N1 at different concentrations of vRNA, are shown. b Effects of contaminants on SATORI. SATORI assays were performed with the crRNA1 and the tgRNA1 in the presence of 10% PBS, 70% virus transport medium (VTM), 3 ng/μL nontarget RNAs (ntgRNAs), 10% saliva, nasopharyngeal swab (NPS), anterior nasal swab (ANS), or throat swab (TS).

References

    1. Siravegna G, Marsoni S, Siena S, Bardelli A. Integrating liquid biopsies into the management of cancer. Nat. Rev. Clin. Oncol. 2017;14:531–548. doi: 10.1038/nrclinonc.2017.14. - DOI - PubMed
    1. Grubaugh ND, et al. Tracking virus outbreaks in the twenty-first century. Nat. Microbiol. 2019;4:10–19. doi: 10.1038/s41564-018-0296-2. - DOI - PMC - PubMed
    1. Dong E, Du H, Gardner L. An interactive web-based dashboard to track COVID-19 in real time. Lancet Infect. Dis. 2020;20:533–534. doi: 10.1016/S1473-3099(20)30120-1. - DOI - PMC - PubMed
    1. Esbin MN, et al. Overcoming the bottleneck to widespread testing: a rapid review of nucleic acid testing approaches for COVID-19 detection. RNA. 2020;26:771–783. doi: 10.1261/rna.076232.120. - DOI - PMC - PubMed
    1. Soleimany AP, Bhatia SN. Activity-based diagnostics: an emerging paradigm for disease detection and monitoring. Trends Mol. Med. 2020;26:450–468. doi: 10.1016/j.molmed.2020.01.013. - DOI - PMC - PubMed

Publication types