. 2021 May;53(5):742-751.
doi: 10.1038/s41588-021-00836-9. Epub 2021 Apr 19.

Large-scale sequencing of flatfish genomes provides insights into the polyphyletic origin of their specialized body plan

Affiliations

Large-scale sequencing of flatfish genomes provides insights into the polyphyletic origin of their specialized body plan

Zhenming Lü et al. Nat Genet. 2021 May.

Abstract

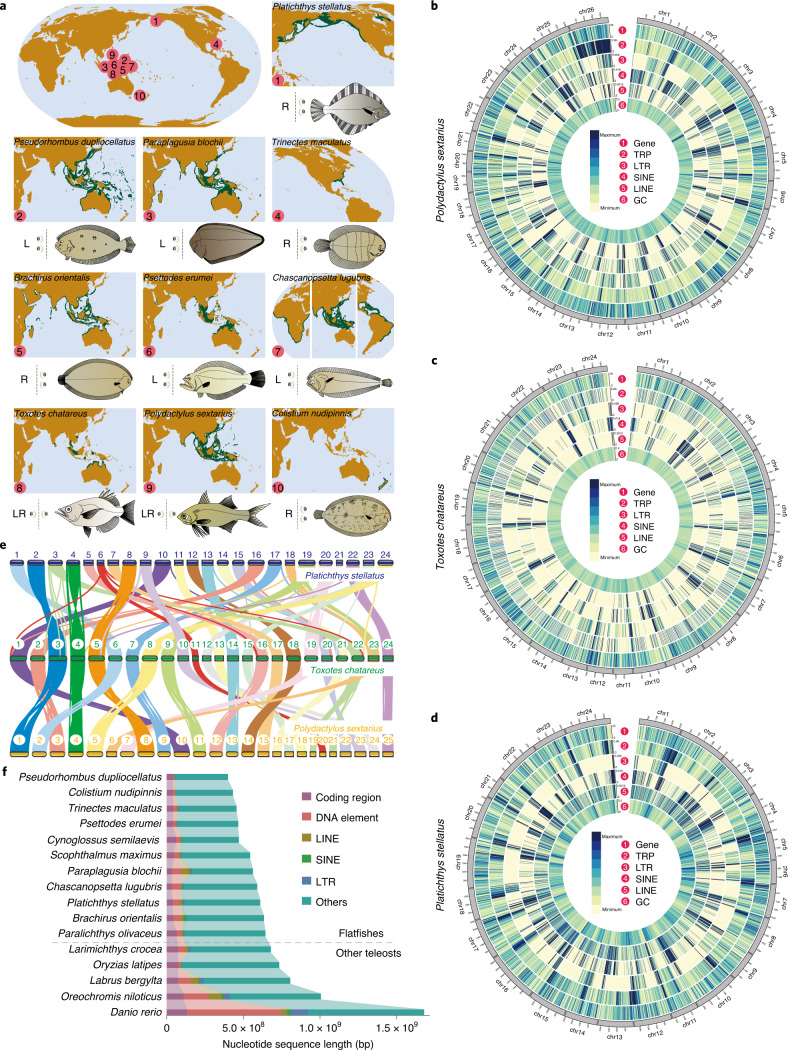
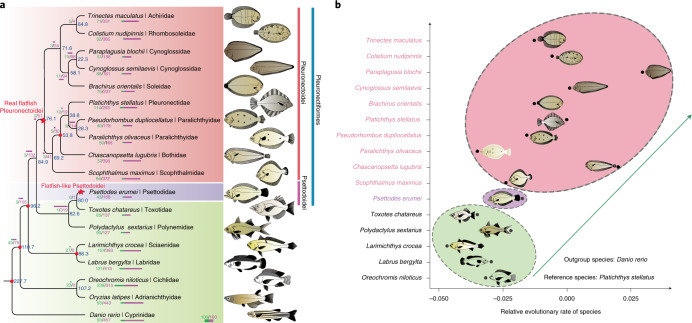
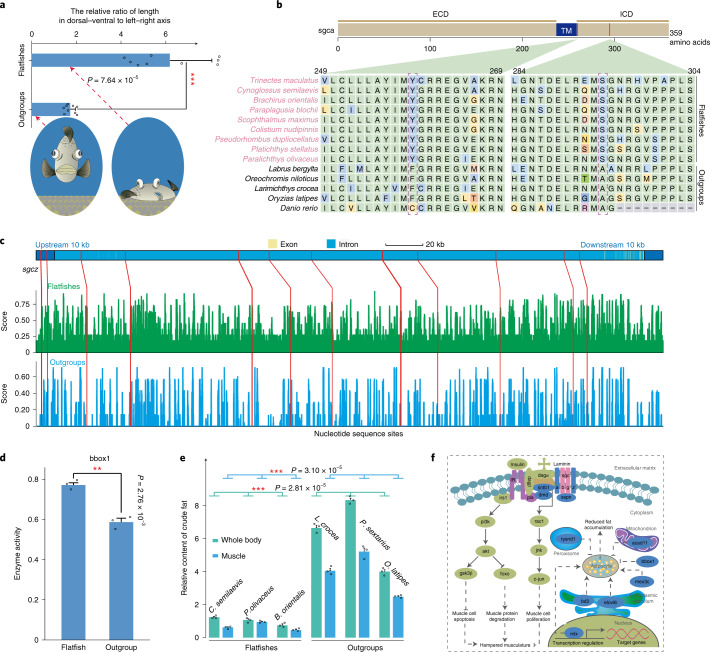
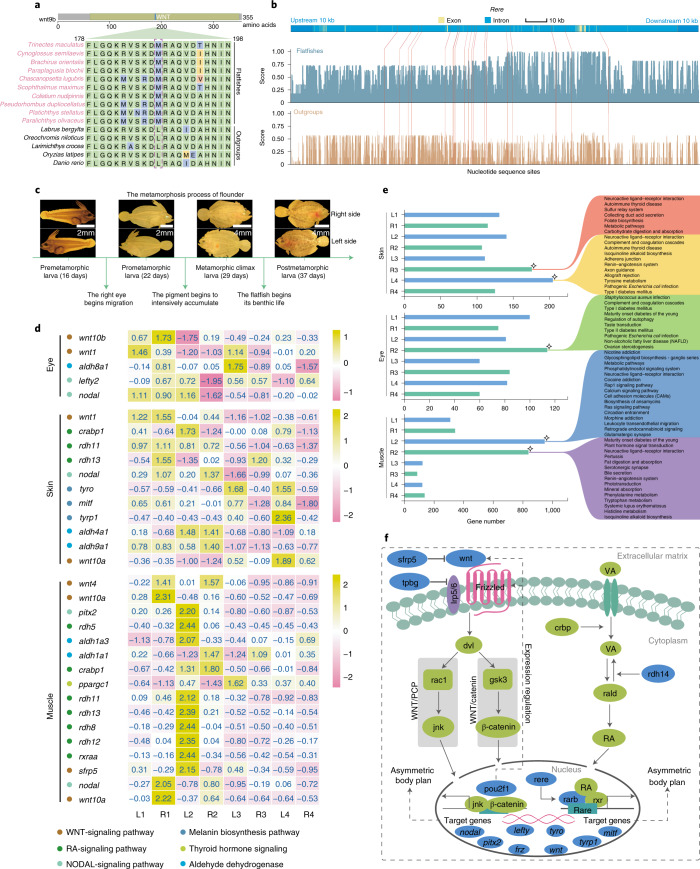
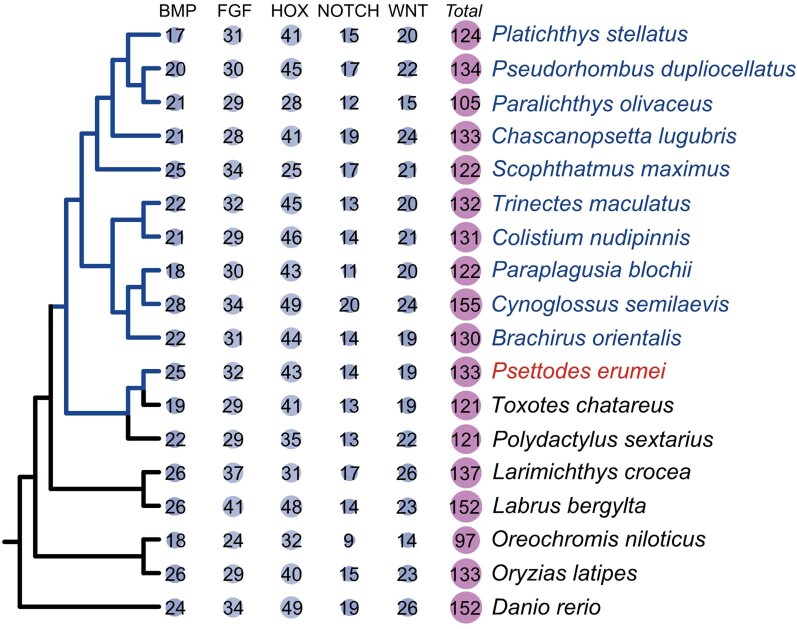
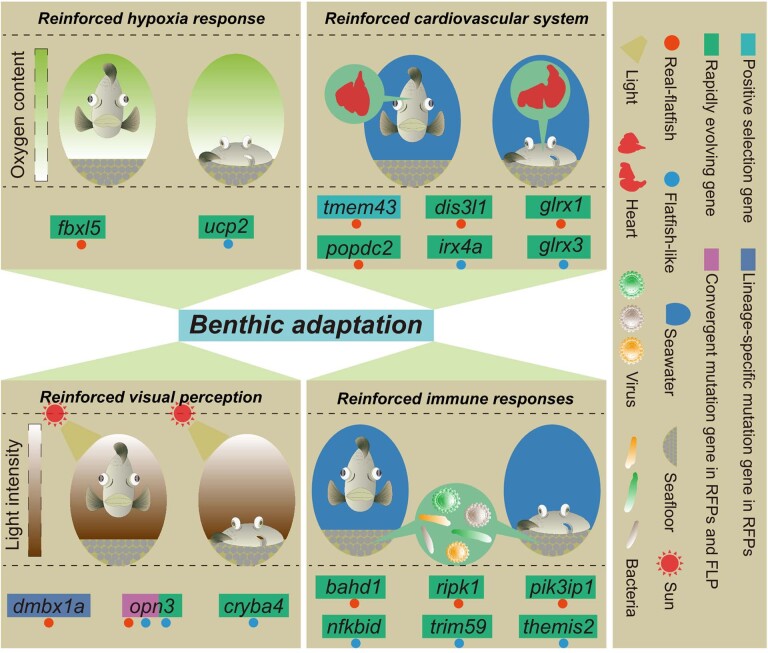
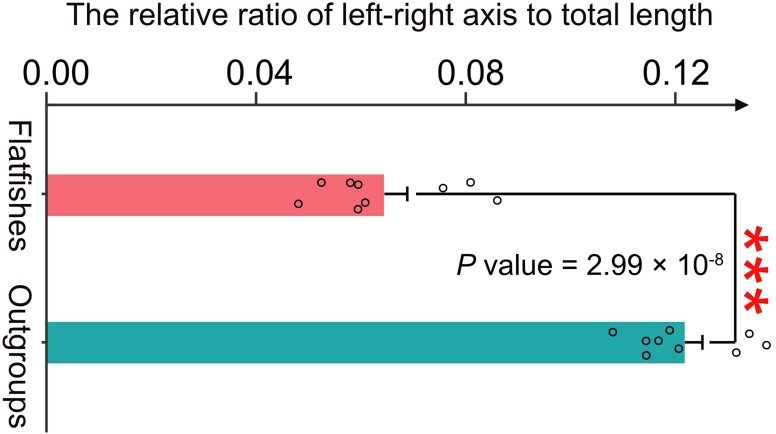
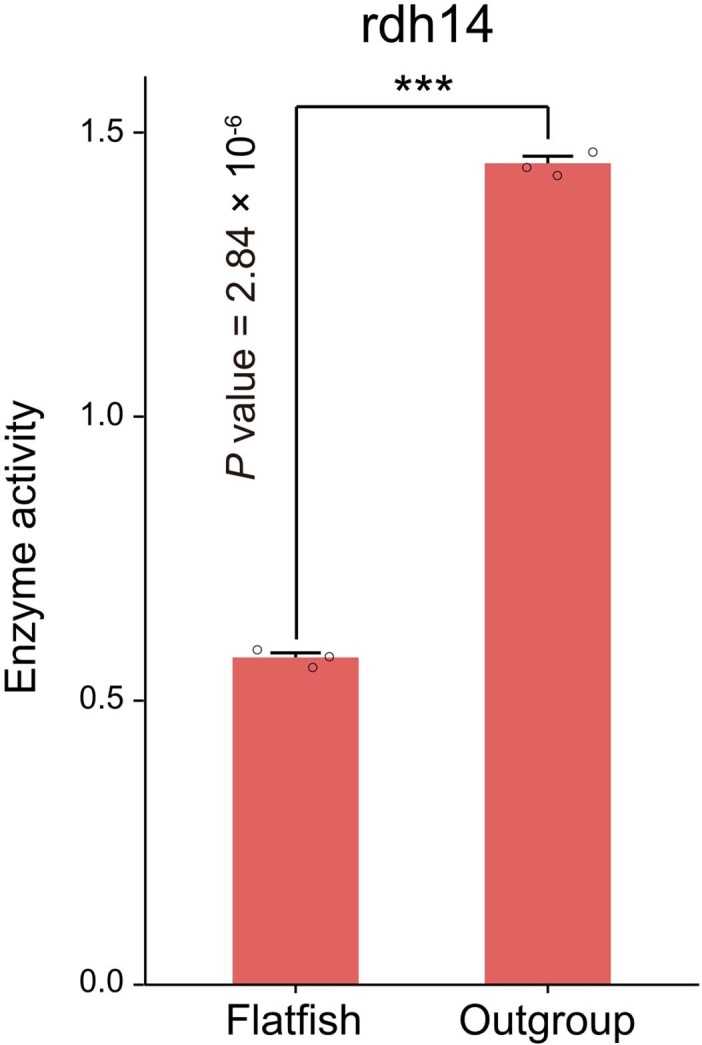
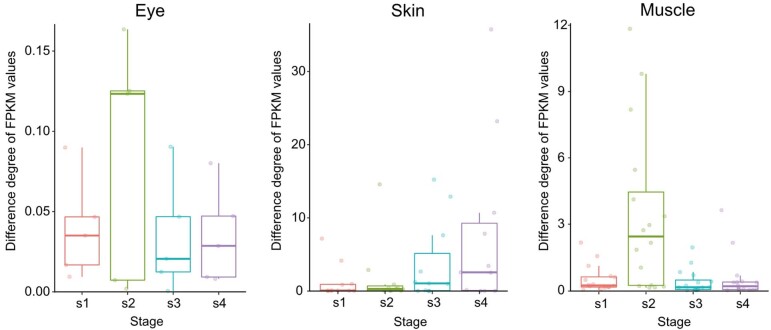
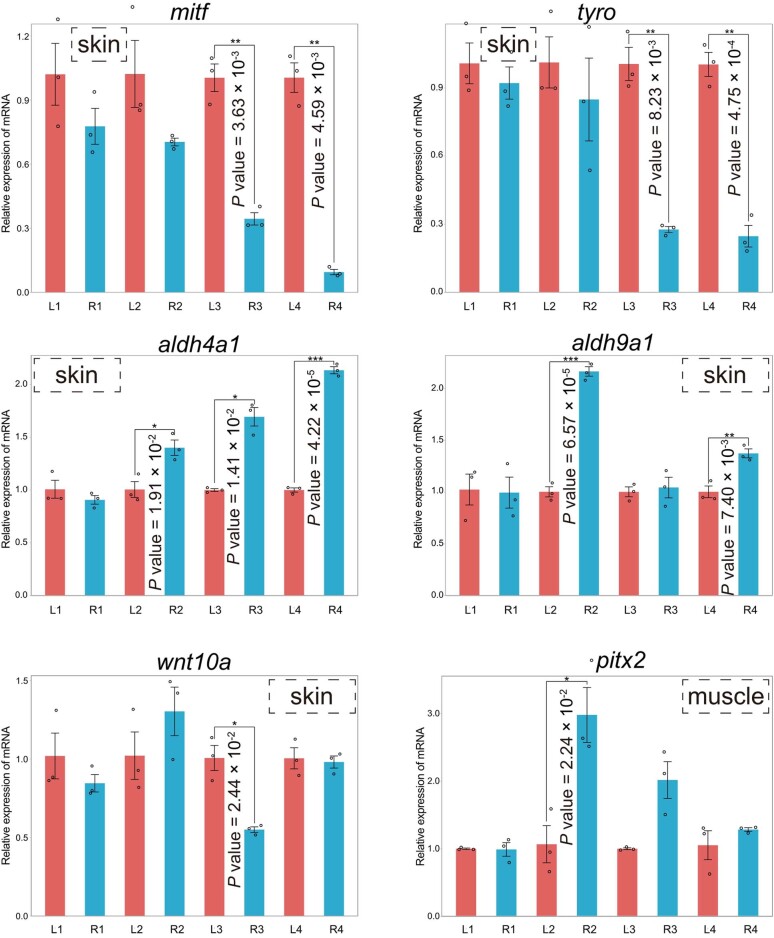
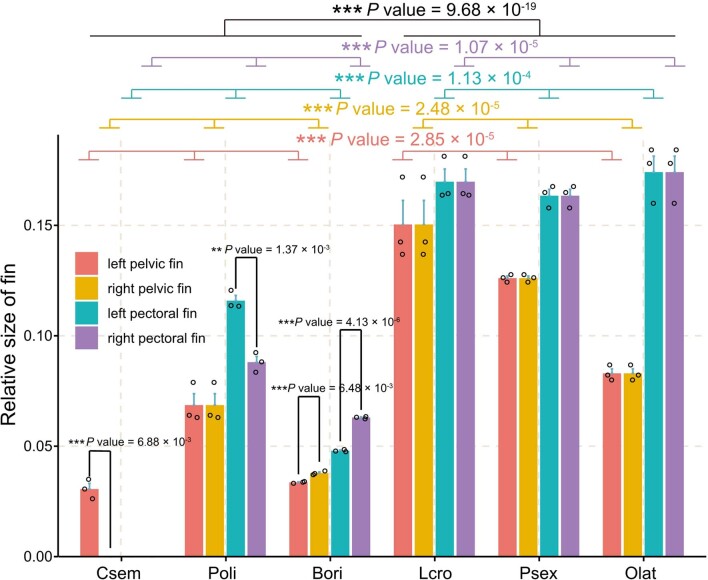
The evolutionary and genetic origins of the specialized body plan of flatfish are largely unclear. We analyzed the genomes of 11 flatfish species representing 9 of the 14 Pleuronectiforme families and conclude that Pleuronectoidei and Psettodoidei do not form a monophyletic group, suggesting independent origins from different percoid ancestors. Genomic and transcriptomic data indicate that genes related to WNT and retinoic acid pathways, hampered musculature and reduced lipids might have functioned in the evolution of the specialized body plan of Pleuronectoidei. Evolution of Psettodoidei involved similar but not identical genes. Our work provides valuable resources and insights for understanding the genetic origins of the unusual body plan of flatfishes.


Conflict of interest statement

The authors declare no competing interests.

Figures

Fig. 1
Fig. 1. Genome assembly and gene annotation of ten species.
a, Geographical distribution of the species sequenced in this study. The dark green areas on the maps represent the global distribution regions of each species, which were acquired from the open source FishBase database (www.fishbase.se). The L, R and LR represent sequenced species that have left-side eyes, right-side eyes or one eye on each side of the body, respectively. bd, Circos plot of distribution of the genomic elements in the species Polydactylus sextarius (b), Toxotes chatareus (c) and Platichthys stellatus (d). From outer to inner ring are the distributions of protein-coding genes, tandem repeats (TRP), long terminal repeats (LTR), short interspersed nuclear elements (SINE), long interspersed nuclear elements (LINE) and GC content, respectively. e, Genomic colinearity of three chromosome-level genomes. The number in the circles represents the chromosome identity for each species. f, Genome size statistics of these species. Diagram indicates the size of each type of element, including the coding regions, DNA elements, LINE, SINE, LTR and other genomic regions, in each species.
Fig. 2
Fig. 2. Polyphyletic origin and fast genome evolution of flatfishes.
a, Phylogenetic relationship and divergence time among the flatfish species. The number in each node represents the divergence time among species and the red circle indicates the fossil record used for calibration in the node. The numbers with slashes, as well as the bars, represent the expanded and contracted gene families in this node, respectively. The silhouette image of each species was drawn according to their morphology using Adobe Illustrator software. b, Relative evolutionary rates of the flatfish species. Zebrafish was used as the outgroup and Platichthys stellatus as the reference species. The arrow represents the trend of the relative evolutionary rates. The colored ovals represent different fish groups that showed contrasted relative evolutionary rates.
Fig. 3
Fig. 3. Genetic changes correlated with the flat body plan in flatfishes.
a, The relative ratio of length in dorsal–ventral to left–right axis. The relative ratio of maximum height of dorsal–ventral axis/maximum length of left–right axis here was used to indicate the degree of body plan flatness of fishes. The ratio was measured in three individuals for each species, and the data are presented as mean values ±s.d. The statistical difference between groups was calculated using Student’s t-test (two tails) with *** representing a statistical P value <0.001. b, Mutations in RFP sgca compared to outgroups. ECD, ICD and TM represent the extracellular, intracellular and transmembrane domain, respectively. The fixed substitutions between RFP and outgroups are marked with a dashed box. c, SCNEs nearby sgcz gene. The x axis represents the nucleotide sequence sites across the sgcz gene and the y axis represents sequence similarity scores. The green and blue columns represent the average sequence similarity score within RFP and outgroups for each site, respectively; the red lines represent the physical locations of the SCNEs across the gene. d, The relative catalyzing activity of bbox1 in RFP and outgroups. The experiment was carried out three times and the data are presented as indicated above. e, Relative fat content in whole body and muscle tissues in flatfishes and outgroups. The fat content was measured in three individuals for each species, and the data are presented as indicated above. f, Hypothetical signaling pathway that may correlate with the body-plan flatness of flatfishes. Proteins marked blue are those encoded by genes that have undergone genetic alterations in RFP. Source data
Fig. 4
Fig. 4. Genetic changes associated with asymmetric body plan in flatfishes.
a, Mutations of wnt9b in RFP compared with outgroups. The diagram of protein structure is shown on the top of the graph, and the site that showed variation is marked with a dashed box. b, SCNEs nearby the rere gene. The x axis represents the nucleotide sequence sites across rere; the y axis represents sequence similarity scores. The blue and brown columns represent the average sequence similarity score within RFP and outgroups for each site, respectively; the red lines represent the physical locations of the SCNEs across the gene. c, Metamorphic process of flounder. Images of flatfish in premetamorphic stage, prometamorphic stage, metamorphic climax stage and postmetamorphic stage are shown. d, Left–right asymmetrical expression of genes in eye, skin and muscle tissues of metamorphic larvae of flounder. The numbers 1–4 on the x axis represent the four metamorphic stages of flounder. L and R on the x axis represent tissues on the left side and right side of the larva, respectively. e, Number of the specifically highly expressed genes during metamorphosis of flounder. The right diagram represents the biological processes in which these genes were involved. The rhombus symbols mark the stages during which the number of the genes began to show greatest expression changes. f, Hypothetical signaling pathway that may correlate to the body plan asymmetry in flatfishes. Proteins marked blue are those encoded by genes that experienced genetic alteration in RFP. Genes marked blue and italicized are regulating targets of these proteins and also exhibited abnormal expression (left–right asymmetry) during metamorphosis in RFP.
Extended Data Fig. 1
Extended Data Fig. 1. Comparison of the annotated coding genes in the species analyzed in this study with those annotated in previously published species.
The x-axis shows the length distribution of the mRNA, CDS, exon, and intron sequences in each species, and the y-axis shows the corresponding ratios of each type of sequences in genome for a particular length.
Extended Data Fig. 2
Extended Data Fig. 2. Statistics of gene number in some gene families known to mediate body plan development in each species.
The gene number of each specific gene family is shown in blue circle and total gene number known to mediate body plan development is shown in purple circle. The circle sizes are equivalent to the gene number that was observed.
Extended Data Fig. 3
Extended Data Fig. 3. Genes associated with seafloor colonization of flatfishes.
The genes associated with certain seafloor colonization adaptation are shown below in the panel. Genes under positive selection, fast evolution, lineage specific mutation or possessing lineage-specific conserved non-coding elements are marked in different colors. The red and blue dots represent real flatfish Pleuronectoidei and flatfish-like Psettodoidei lineages, respectively. The enlarged red diagrams in the panel of ‘reinforced cardiovascular system’ represent heart tissues. The enlarged green diagrams in the panel of ‘reinforced immune responses’ represent bacteria and viruses.
Extended Data Fig. 4
Extended Data Fig. 4. The relative ratio of left-right axis to total length.
The relative ratio of maximum length of left-right axis to the total length was used here to indicate the degree of body pan flatness of fishes. The ratio was measured in three individuals for each species and the data are presented as mean values ± SD. The statistical difference between groups was calculated using Student’s t-test (two tails) with ‘***’ representing a statistical significance of P value < 0.001. Source data
Extended Data Fig. 5
Extended Data Fig. 5. The catalyzing efficiency of enzyme rdh14 in RFP compared to that of the outgroups.
The x-axis represents the RFP specific rdh14 and that of the outgroups. The y-axis represents the measured relative catalyzing efficiency of rdh14. Each experiment was performed with three reaction replicates to determine the mean values ± SD. The distinction of enzyme catalytic activity of RFP compared to non-flatfish teleosts was tested using Student’s t-test (two tails) with ‘***’ represents a statistical significance of P value < 0.001. Source data
Extended Data Fig. 6
Extended Data Fig. 6. Asymmetric gene expression in metamorphic flounders.
The symbol s1-s4 in the x-axis represents the four developmental stages of flounder, including the pre-metamorphic stage, the pro-metamorphic stage, the metamorphic climax stage, and the post-metamorphic stage, respectively. The y-axis represents the gene expression difference across the left-right axis of flounder, as indicated by FPKM values. The minima, maxima, centre, and the upper and lower bounds of box represent the maximum, minimum, median value, upper and lower quartile, respectively. Each colored dot represents one gene in WNT, RA, or NODAL signal pathway, or gene that associated with pigmentation that are equivalent to those indicated in Fig. 4d in the main text.
Extended Data Fig. 7
Extended Data Fig. 7. Asymmetric gene expression confirmed by Real-time quantitative PCR.
For each metamorphic time window, three biological replicates were sampled, with each replicate containing tissues from at least 30 individuals, and were used for the RNAs extraction and q-PCR analysis. The numbers 1-4 in the x-axis represent the four developmental stages of flounder, including the pre-metamorphic stage, the pro-metamorphic stage, the metamorphic climax stage, and the post-metamorphic stage. L and R in the x-axis represent tissues on left-side and right-side of the larva, respectively. The y-axis represents the relative expression level of genes compared with internal control of beta-actin and the data are presented as mean values ± SD. The left-right distinction of gene expression profiles in each metamorphic time window was tested using Student’s t-test (two tails), and ‘*’, ‘**’, and ‘***’ represents a statistical significance of P value < 0.05, 0.01, and 0.001, respectively. Source data
Extended Data Fig. 8
Extended Data Fig. 8. Relative size of pelvic and pectoral fins in flatfishes compared to non-flatfish species.
The x-axis in the panel shows the species with pectoral and pelvic fins measured, and the y-axis shows the relative sizes of fins represented by the ratios of length of pectoral and pelvic fins to the total length of the fish. All the parameters were measured in three individuals for each species and the data are presented as mean values ± SD. The distinction of fin morphology of flatfishes compared to non-flatfish teleosts was tested using Student’s t-test (two tails) with ‘**’ and ‘***’ representing a statistical significance of P value < 0.01 and P value < 0.001 respectively. Csem (Cynoglossus semilaevis); Poli (Paralichthys olivaceus); Bori (Brachirus orientalis); Lcro (Larimichthys crocea); Psex (Polydactylus sextarius); Olat (Oryzias latipes). Source data
Extended Data Fig. 9
Extended Data Fig. 9. Relative sizes of dorsal and anal fins in flatfishes compared to non-flatfish species.
The x-axis in the diagram shows the species with dorsal and anal fins measured, and the y- axis in the diagram shows the relative sizes of fins represented by the ratios of length of dorsal and anal fins to the total length of the fish. All the parameters were measured in three individuals for each species and the data are presented as mean values ± SD. The distinction of fin morphology of flatfishes compared to non-flatfish teleosts was tested using Student’s t-test (two tails) with ‘***’ representing a statistical significance of P value < 0.001. Csem (Cynoglossus semilaevis); Poli (Paralichthys olivaceus); Bori (Brachirus orientalis); Lcro (Larimichthys crocea); Psex (Polydactylus sextarius); Olat (Oryzias latipes). Source data
Extended Data Fig. 10
Extended Data Fig. 10. The lineage specific mutated gene of hoxd12a in real flatfish species.
The sites that showed variation between species are marked in different colors. The fixed variation site between real flatfish Pleuronectoidei species and outgroups are marked with a dashed box.

Similar articles

Cited by

References

    1. Dornbos SQ, Bottjer DJ, Chen JY. Paleoecology of benthic metazoans in the early cambrian maotianshan shale biota and the middle cambrian burgess shale biota: evidence for the Cambrian substrate revolution. Palaeogeogr. Palaeoclmatol. Palaeoecol. 2005;220:47–67. doi: 10.1016/j.palaeo.2003.11.016. - DOI
    1. Bottjer DJ. The Cambrian substrate revolution and early evolution of the phyla. J. Earth Sci. 2010;21:21–24. doi: 10.1007/s12583-010-0160-7. - DOI
    1. Ryer CH. A review of flatfish behavior relative to trawls. Fish. Res. 2008;90:138–146. doi: 10.1016/j.fishres.2007.10.005. - DOI
    1. Janvier P. Squint of the fossil flatfish. Nature. 2008;454:169–170. doi: 10.1038/454169a. - DOI - PubMed
    1. Holmes RA, Gibson RN. A comparison of predatory behavior in flatfish. Anim. Behav. 1983;31:1244–1255. doi: 10.1016/S0003-3472(83)80031-1. - DOI

Publication types

LinkOut - more resources