. 2021 May;18(5):472-481.
doi: 10.1038/s41592-021-01117-3. Epub 2021 Apr 19.

Critical assessment of protein intrinsic disorder prediction

Collaborators, Affiliations

Critical assessment of protein intrinsic disorder prediction

Marco Necci et al. Nat Methods. 2021 May.

Abstract

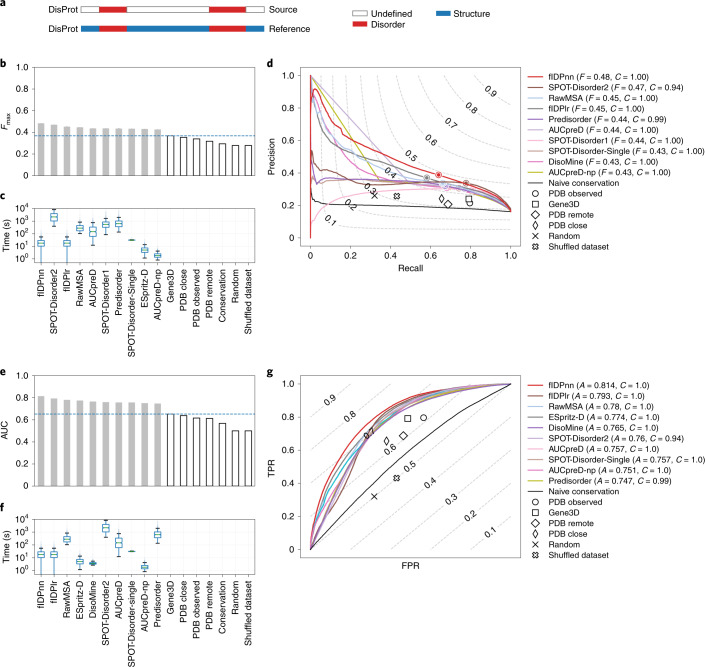
Intrinsically disordered proteins, defying the traditional protein structure-function paradigm, are a challenge to study experimentally. Because a large part of our knowledge rests on computational predictions, it is crucial that their accuracy is high. The Critical Assessment of protein Intrinsic Disorder prediction (CAID) experiment was established as a community-based blind test to determine the state of the art in prediction of intrinsically disordered regions and the subset of residues involved in binding. A total of 43 methods were evaluated on a dataset of 646 proteins from DisProt. The best methods use deep learning techniques and notably outperform physicochemical methods. The top disorder predictor has Fmax = 0.483 on the full dataset and Fmax = 0.792 following filtering out of bona fide structured regions. Disordered binding regions remain hard to predict, with Fmax = 0.231. Interestingly, computing times among methods can vary by up to four orders of magnitude.


Conflict of interest statement

The authors declare no competing interests.

Figures

Fig. 1
Fig. 1. CAID dashboard.
a, CAID timeline: phases of CAID from June 2018 to the present. The initial results were presented and discussed at the conferences Intelligent Systems for Molecular Biology (ISMB) and CASP. b, CAID process: iterative process of the CAID experiment in four phases. (1) Annotation: any process that produces unpublished annotation of IDR coordinates; in this edition, annotation refers to the DisProt round of annotation. (2) Prediction: annotations are used to build references with which we test predictors. (3) Evaluation: predictions are evaluated. (4) Report: a report of the evaluation is produced and published in peer-reviewed journals and on a web page that allows the reader to browse the evaluation of all CAID editions. c, Residue classification strategy for the DisProt and DisProt-PDB references. d, Number of residues for each class in different references. e, Number of proteins for each set of annotations that they contain. f, Number of proteins in each taxon.
Fig. 2
Fig. 2. Prediction success and CPU times for the ten top-ranking disorder predictors in the DisProt dataset.
a, The reference used (DisProt, n = 646 proteins) in the analysis and how it was obtained. bg, Performance of predictors expressed as maximum F1-score across all thresholds (Fmax) (b) and AUC (e) for the ten top-ranking methods (light gray) and baselines (white), and distribution of execution time per target (c,f) using the DisProt dataset. b,e, The horizontal line indicates, respectively, Fmax and AUC of the best baseline. d,g, Precision–recall (d) and ROC curves (g) of the ten top-ranking methods and baselines using the DisProt dataset, with level curves of F1-score and balanced accuracy, respectively. F, Fmax; C, coverage; A, AUC. c,f, Boxplots are defined as follows: the middle value of the dataset is the median (Q2/50th percentile) and box boundaries are the first quartile (Q1/25th percentile) and third quartile (Q3/75th percentile), respectively; maximum is Q3 + 1.5 × (Q3 – Q1) and minimum is Q1 – 1.5 × (Q3 – Q1). Outliers are hidden for clarity. c,f, Magenta dots indicate that the entire distribution of execution times is <1 s. Q1–Q3, first to third quartiles. TPR, true positive rate; FPR, false positive rate.
Fig. 3
Fig. 3. Prediction success and CPU times for the ten top-ranking disorder predictors in the DisProt-PDB dataset.
a, The reference used (DisProt-PDB, n = 646 proteins) in the analysis and how it was obtained. bg, Performance of predictors expressed as maximum F1-score across all thresholds (Fmax) (b) and AUC (e) for the ten top-ranking methods (light gray) and baselines (white), and distribution of execution time per target (c,f) using the DisProt-PDB dataset. b,e, The horizontal line indicates, respectively, Fmax and AUC of the best baseline. d,g, Precision–recall (d) and ROC curves (g) of the ten top-ranking methods and baselines using the DisProt-PDB dataset, with level curves of F1-score and balanced accuracy, respectively. c,f, boxplots are defined as follows: the middle value of the dataset is the median (Q2/50th percentile) and box boundaries are the first quartile (Q1/25th percentile) and third quartile (Q3/75th percentile), respectively; maximum is Q3 + 1.5 × (Q3 – Q1) and minimum is Q1 – 1.5 × (Q3 – Q1). Outliers are hidden for clarity. c,f, Magenta dots indicate that the entire distribution of execution times is <1 s.
Fig. 4
Fig. 4. Prediction success and CPU times for the ten top-ranking binding predictors in the DisProt-binding dataset.
a, The reference used (DisProt-binding, n = 646 proteins) in the analysis and how it was obtained. bg, Performance of predictors expressed as maximum F1-score across all thresholds (Fmax) (b) and AUC (e) for the ten top-ranking methods (light gray) and baselines (white), and distribution of execution time per target (c,f) using the DisProt-binding dataset. b,e, The horizontal line indicates, respectively, Fmax and AUC of the best baseline. d,g, Precision–recall (d) and ROC curves (g) of the ten top-ranking methods and baselines using the DisProt-binding dataset, with level curves of F1-score and balanced accuracy, respectively. c,f, boxplots are defined as follows: the middle value of the dataset is the median (Q2/50th percentile) and box boundaries are the first quartile (Q1/25th percentile) and third quartile (Q3/75th percentile), respectively; maximum is Q3 + 1.5 × (Q3 – Q1) and minimum is Q1 – 1.5 × (Q3 – Q1). Outliers are hidden for clarity. c,f, Magenta dots indicate that the entire distribution of execution times is <1 s.

Comment in

References

    1. Tompa, P. & Fersht, A. Structure and Function of Intrinsically Disordered Proteins (CRC Press, 2009).
    1. Dunker AK, Bondos SE, Huang F, Oldfield CJ. Intrinsically disordered proteins and multicellular organisms. Semin. Cell Dev. Biol. 2015;37:44–55. - PubMed
    1. Wright PE, Dyson HJ. Intrinsically disordered proteins in cellular signalling and regulation. Nat. Rev. Mol. Cell Biol. 2015;16:18–29. - PMC - PubMed
    1. Ward JJ, Sodhi JS, McGuffin LJ, Buxton BF, Jones DT. Prediction and functional analysis of native disorder in proteins from the three kingdoms of life. J. Mol. Biol. 2004;337:635–645. - PubMed
    1. Necci M, Piovesan D, Tosatto SCE. Large-scale analysis of intrinsic disorder flavors and associated functions in the protein sequence universe. Protein Sci. 2016;25:2164–2174. - PMC - PubMed

Publication types

Substances

LinkOut - more resources