. 2021 May;24(5):737-745.
doi: 10.1038/s41593-021-00826-4. Epub 2021 Apr 19.

An expanded set of genome-wide association studies of brain imaging phenotypes in UK Biobank

Affiliations

An expanded set of genome-wide association studies of brain imaging phenotypes in UK Biobank

Stephen M Smith et al. Nat Neurosci. 2021 May.

Abstract

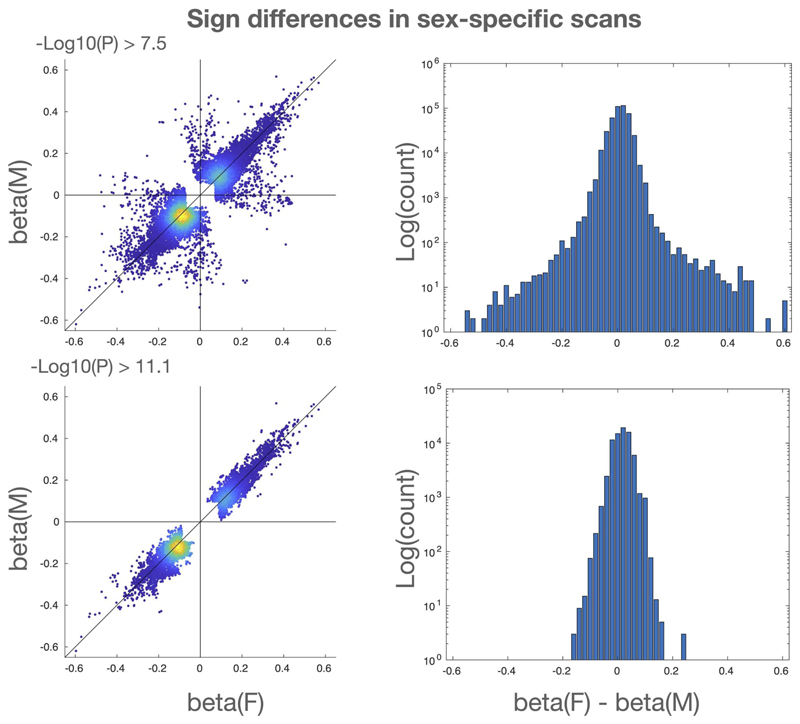
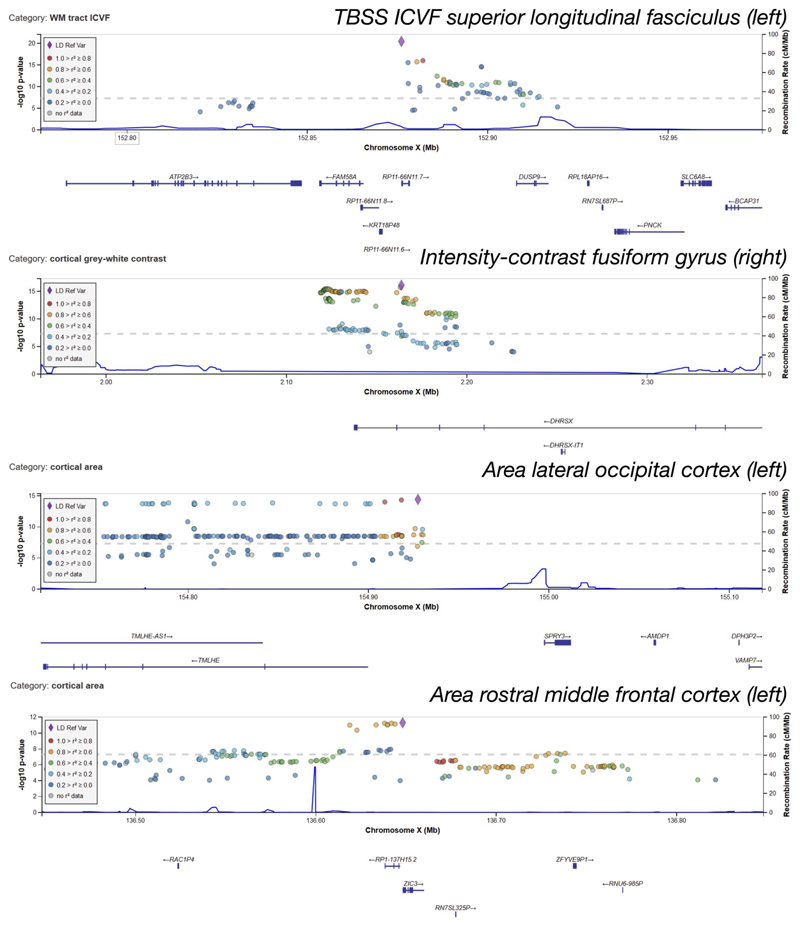
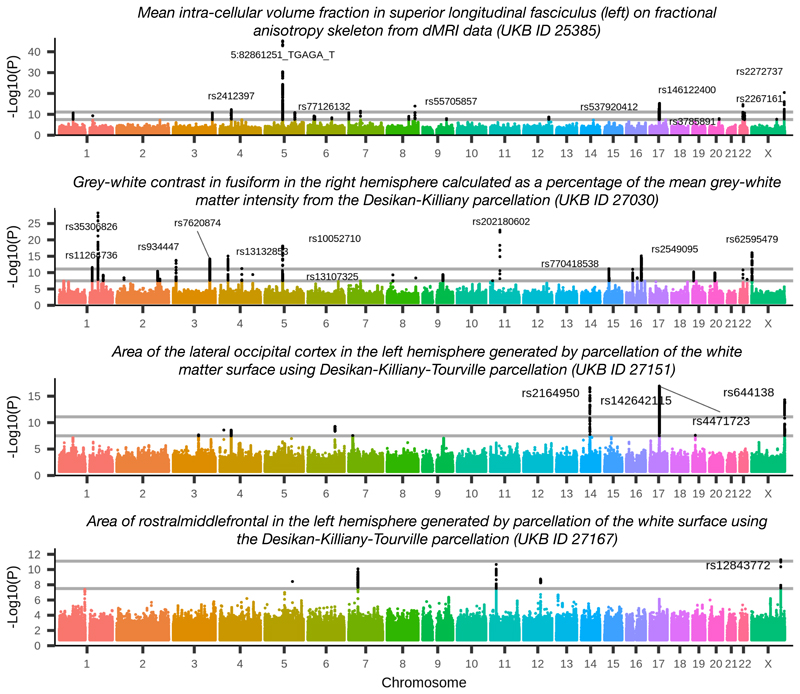
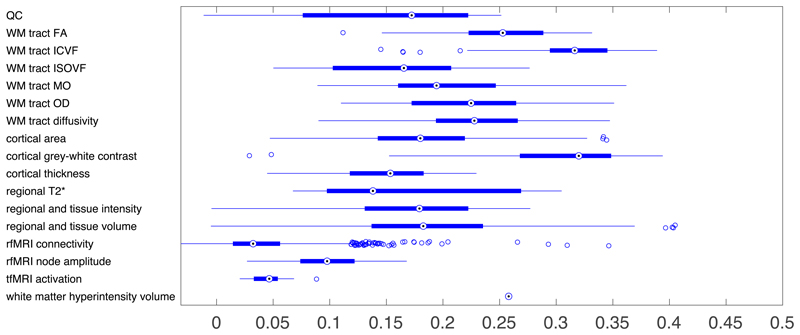
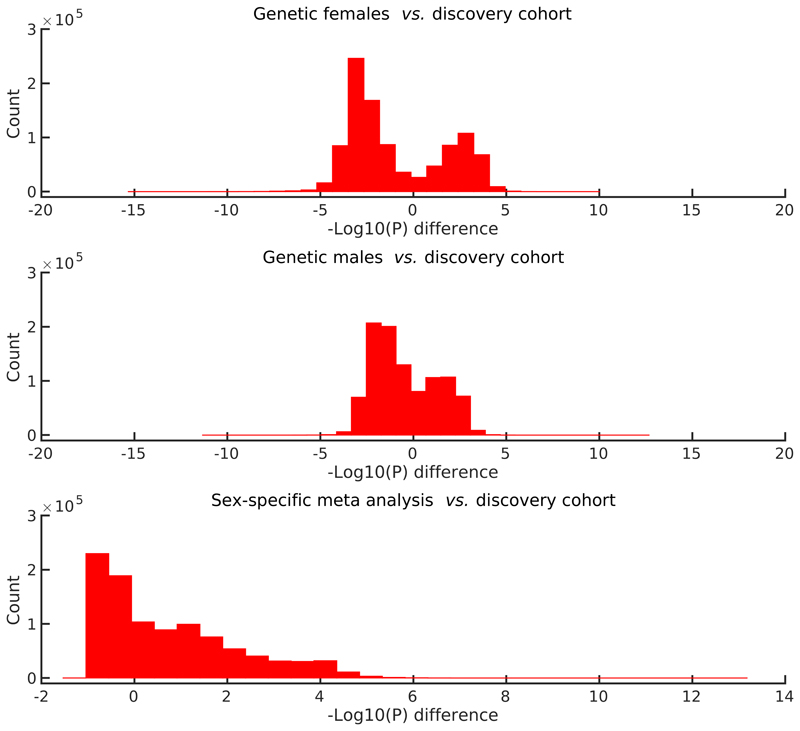
UK Biobank is a major prospective epidemiological study, including multimodal brain imaging, genetics and ongoing health outcomes. Previously, we published genome-wide associations of 3,144 brain imaging-derived phenotypes, with a discovery sample of 8,428 individuals. Here we present a new open resource of genome-wide association study summary statistics, using the 2020 data release, almost tripling the discovery sample size. We now include the X chromosome and new classes of imaging-derived phenotypes (subcortical volumes and tissue contrast). Previously, we found 148 replicated clusters of associations between genetic variants and imaging phenotypes; in this study, we found 692, including 12 on the X chromosome. We describe some of the newly found associations, focusing on the X chromosome and autosomal associations involving the new classes of imaging-derived phenotypes. Our novel associations implicate, for example, pathways involved in the rare X-linked STAR (syndactyly, telecanthus and anogenital and renal malformations) syndrome, Alzheimer's disease and mitochondrial disorders.


Conflict of interest statement

Competing interests

The authors declare no competing interests.

Figures

Extended Data Fig. 1
Extended Data Fig. 1. Comparisons of effect sizes and signs for genetic females and males
Top row: Effect sizes for all associations with either genetic females or genetic males (or both) having -Log10(P) >= 7.5. Bottom row: effect sizes for all associations with either genetic females or genetic males (or both) having -Log10(P) >= 11.1. Left column: Scatter plots of effect sizes, indicating a small fraction (0.58%) of sign differences for -Log10(P) >= 7.5 and no sign differences (quadrants II and IV empty) for -Log10(P) >= 11.1 condition. Right column: Histograms of difference between effect sizes. Log y-scale indicates generally close matching of effect sizes.
Extended Data Fig. 2
Extended Data Fig. 2. Regional association plots of the significant variants in X.
First row: Region around rs2272737 (P = 3.5 × 10⁻²¹). This variant is an eQTL of FAM58A. Second row: Region around rs62595479 (P = 8.2 × 10⁻¹⁷). This variant is located in a pseudo autosomal region (PAR1) of X, in an intron of DHRSX. Third row: Region around rs644138 (P = 4.8 × 10⁻¹⁵). This variant is in an intron of SPRY3 (and is an eQTL in brain tissue of various genes). Bottom row: Region around rs12843772 (P = 5.1 × 10⁻¹²) located ≤150 bp from ZIC3. The genomic positions of the loci and genes are based on Human Genome build hg19. Regions considered include all loci within 10 kbp of the hit.
Figure 1
Figure 1
Manhattan plots for the four phenotypes achieving Bonferroni corrected significance on the X chromosome. Genetic variants are labelled for peak associations achieving the Bonferroni level. Plot titles indicate phenotype definition (including UKB ID field index from http://biobank.ctsu.ox.ac.uk/crystal/field.cgi?id=25385, 27030, 27151 or 27167). Black dots indicate associations that are significant associations at the genome-wide level, −Log10(P) ≥ 7.5. Grey lines show genome-wide+Bonferroni level (11.1) and genome-wide significance level (7.5). These associations involve diffusion MRI and the Desikan-Killiany and the Dessikan-Killiany-Tourville parcellations of white matter and grey matter.
Figure 2
Figure 2
Heritability estimates (h 2) for phenotypes grouped according to IDP categories. Acronymns in y-labels include: quality control (QC), and diffusion tensor imaging phenotypes: white matter (WM), fractional anisotropy (FA), intra-cellular volume fraction (ICVF), isotropic or free water volume fraction (ISOVF), diffusion tensor mode (MO) and orientation dispersion index (OD). Boxplots indicate medians, 25th and 75th quantiles, and whiskers extending to maximal and minimal non-outliers (outliers are points exceeding 1.5 times the interquantile range from the median). More details for these 17 categories and heritability and standard errors for all phenotypes provided in Supplementary Table 1.
Figure 3
Figure 3
Paired difference histograms for the sex-specific scans on the X chromosome. We plot histograms for the differences between the −Log10(P) values for: genetic females (top), genetic males (middle), and the meta-analysis (bottom), vs. the discovery scan (which includes genetic male and female samples together, but did include a sex confound covariate). Differences are plotted for all associations for which the maximum −Log10(P) value over the four analyses is greater than 4.0, leading to the bimodal nature of the first two histograms. A total of 989,981 variants pass this maximum filter. The bottom plot shows that there is greater statistical sensitivity when carrying out sex-specific GWAS on the X chromosome, and then combining the results with a meta-analysis, than by combining all subjects together in a simple standard GWAS.

Comment in

  • From base pair to brain.
    Matoba N, Stein JL. Matoba N, et al. Nat Neurosci. 2021 May;24(5):619-621. doi: 10.1038/s41593-021-00852-2. Nat Neurosci. 2021. PMID: 33875895 No abstract available.

References

    1. Elliott LT, Sharp K, Alfaro-Almagro F, Shi S, Miller KL, Douaud G, Marchini J, Smith SM. Genome-wide association studies of brain imaging phenotypes in UK Biobank. Nature. 2018;562(7726):210–6. - PMC - PubMed
    1. Alfaro-Almagro F, McCarthy P, Afyouni S, Andersson JLR, Bastiani M, Miller KL, Nichols TE, Smith SM. Confound modelling in UK Biobank brain imaging. NeuroImage. 2020 In press. - PMC - PubMed
    1. Hormozdiari F, Kostem E, Yong Kang E, Pasaniuc B, Eskin E. Identifying causal variants at loci with multiple signals of association. Genetics. 2014;198(2):497–508. - PMC - PubMed
    1. Clayton D. Testing for association on the X chromosome. Biostatistics. 2008;9(4):593–600. - PMC - PubMed
    1. Lee JJ, Wedow R, Okbay A, Kong E, Maghzian O, Zacher M, Nguyen-Viet TA, Bowers P, Sidorenko J, Linnér RK, Fontana MA. Gene discovery and polygenic prediction from a genome-wide association study of educational attainment in 1.1 million individuals. Nature Genetics. 2018;50(8):1112. - PMC - PubMed

Publication types

LinkOut - more resources