

Identifying clinical and biochemical phenotypes in acute respiratory distress syndrome secondary to coronavirus disease-2019
- PMID: 33875978
- PMCID: PMC8047387
- DOI: 10.1016/j.eclinm.2021.100829
Identifying clinical and biochemical phenotypes in acute respiratory distress syndrome secondary to coronavirus disease-2019
Abstract
Background: Acute respiratory distress syndrome (ARDS) secondary to coronavirus disease-2019 (COVID-19) is characterized by substantial heterogeneity in clinical, biochemical, and physiological characteristics. However, the pathophysiology of severe COVID-19 infection is poorly understood. Previous studies established clinical and biological phenotypes among classical ARDS cohorts, with important therapeutic implications. The phenotypic profile of COVID-19 associated ARDS remains unknown.
Methods: We used latent class modeling via a multivariate mixture model to identify phenotypes from clinical and biochemical data collected from 263 patients admitted to Massachusetts General Hospital intensive care unit with COVID-19-associated ARDS between March 13 and August 2, 2020.
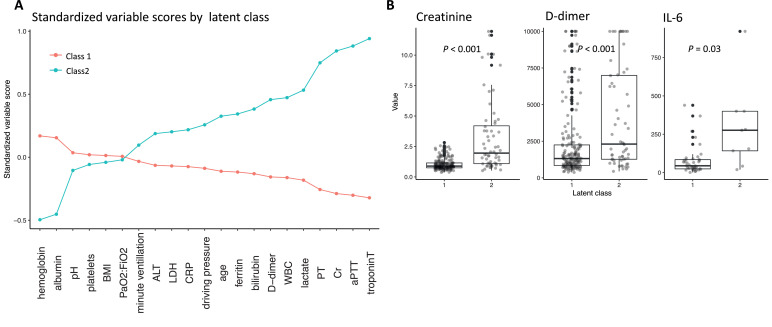
Findings: We identified two distinct phenotypes of COVID-19-associated ARDS, with substantial differences in biochemical profiles despite minimal differences in respiratory dynamics. The minority phenotype (class 2, n = 70, 26·6%) demonstrated increased markers of coagulopathy, with mild relative hyper-inflammation and dramatically increased markers of end-organ dysfunction (e.g., creatinine, troponin). The odds of 28-day mortality among the class 2 phenotype was more than double that of the class 1 phenotype (40·0% vs.· 23·3%, OR = 2·2, 95% CI [1·2, 3·9]).
Interpretation: We identified distinct phenotypic profiles in COVID-19 associated ARDS, with little variation according to respiratory physiology but with important variation according to systemic and extra-pulmonary markers. Phenotypic identity was highly associated with short-term mortality. The class 2 phenotype exhibited prominent signatures of coagulopathy, suggesting that vascular dysfunction may play an important role in the clinical progression of severe COVID-19-related disease.
Keywords: ARDS; COVID-19; Phenotypes; Statistical inference.
© 2021 The Author(s).
Conflict of interest statement
LB receives salary support from K23 HL128882/NHLBI NIH as principal investigator for his work on hemolysis and nitric oxide. LB receives technologies and devices from iNO Therapeutics LLC, Praxair Inc., Masimo Corp. LB receives grants from “Fast Grants for COVID-19 research” at Mercatus Center of George Mason University and from iNO Therapeutics LLC. BTT reports grants from NIH NHLBI and personal fees from Bayer, Thetis, and Novartis, outside the submitted work. CCH receives research support from AstraZeneca, outside the scope of the submitted work. The other authors have nothing to disclose.
Figures
References
LinkOut - more resources
Full Text Sources
Other Literature Sources
