Clinical Trial
. 2021 Sep 23;138(12):1019-1033.
doi: 10.1182/blood.2020008629.

SASH3 variants cause a novel form of X-linked combined immunodeficiency with immune dysregulation

Affiliations
Clinical Trial

SASH3 variants cause a novel form of X-linked combined immunodeficiency with immune dysregulation

Ottavia M Delmonte et al. Blood. .

Abstract

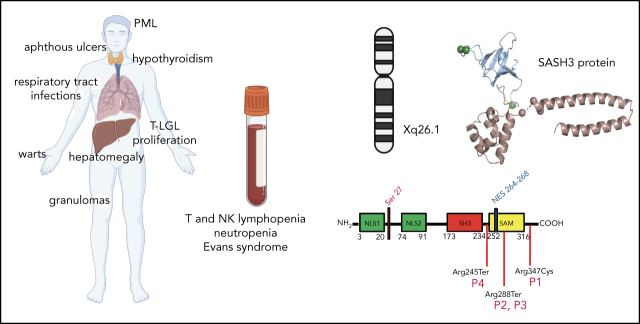
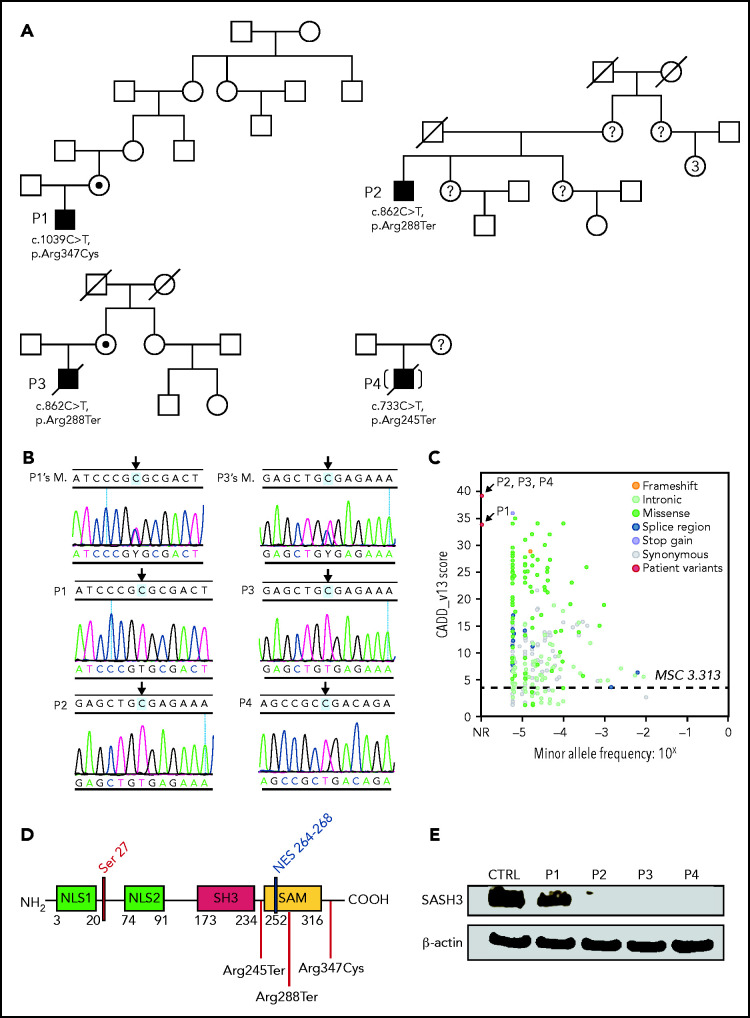
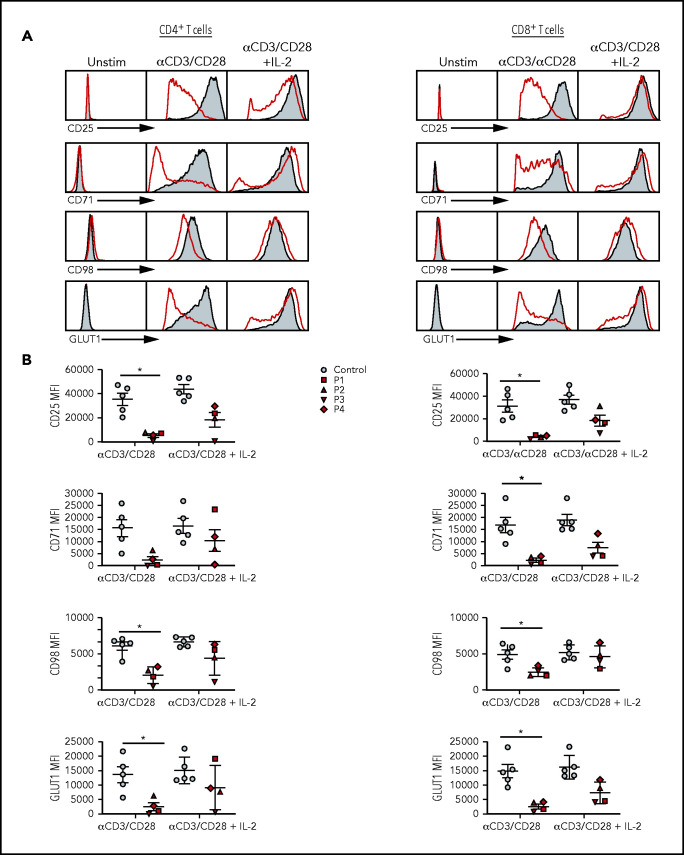
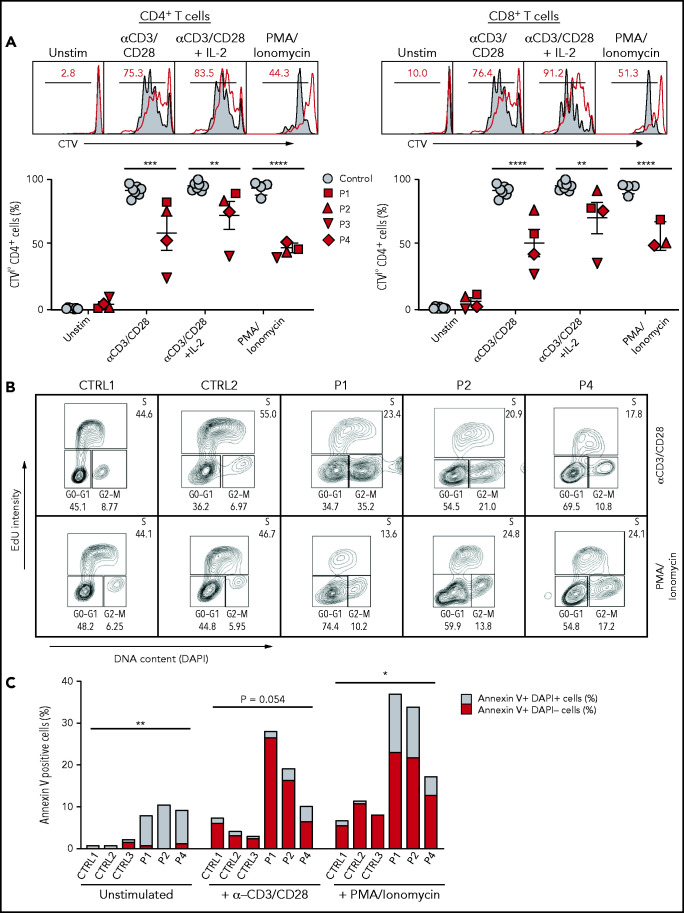
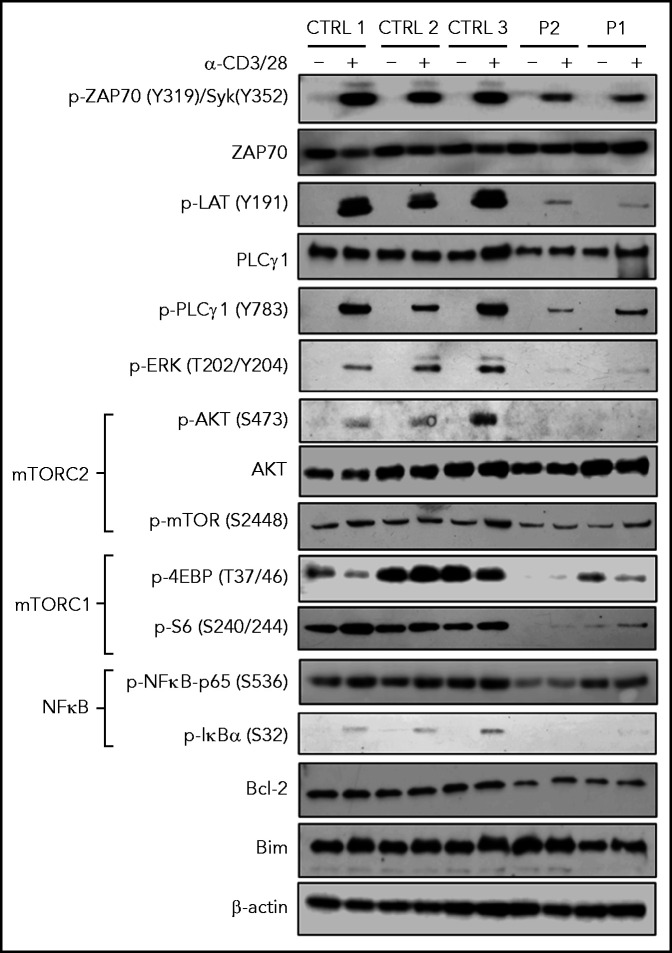
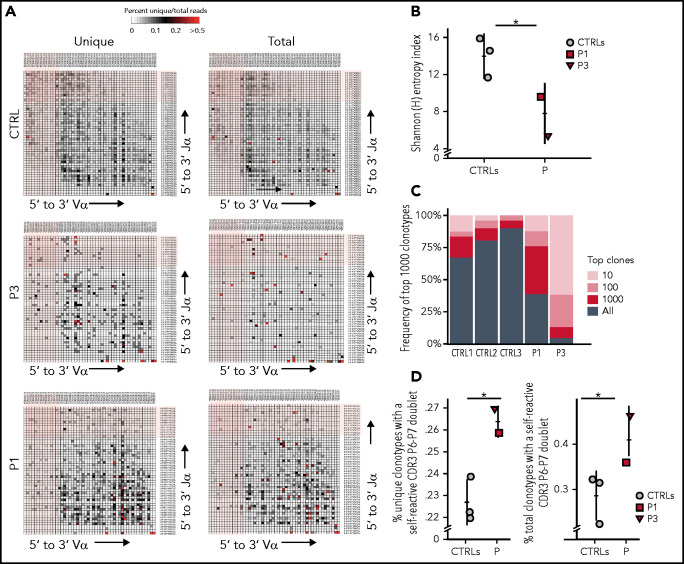
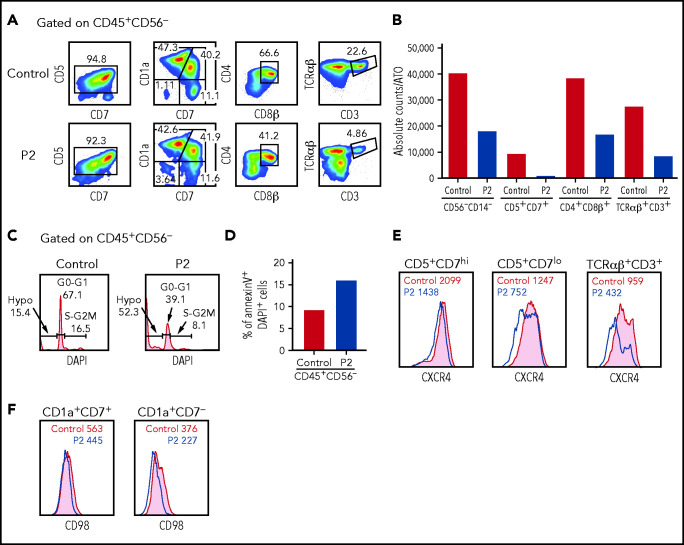
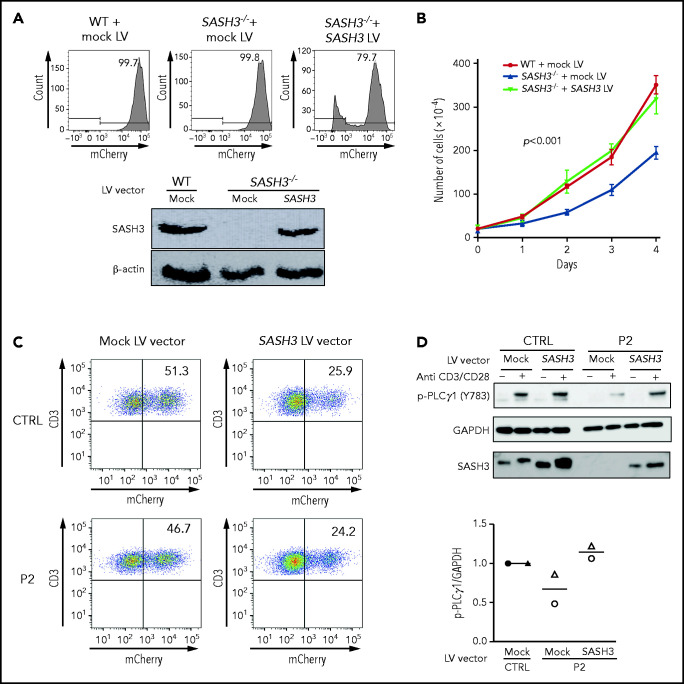
Sterile alpha motif (SAM) and Src homology-3 (SH3) domain-containing 3 (SASH3), also called SH3-containing lymphocyte protein (SLY1), is a putative adaptor protein that is postulated to play an important role in the organization of signaling complexes and propagation of signal transduction cascades in lymphocytes. The SASH3 gene is located on the X-chromosome. Here, we identified 3 novel SASH3 deleterious variants in 4 unrelated male patients with a history of combined immunodeficiency and immune dysregulation that manifested as recurrent sinopulmonary, cutaneous, and mucosal infections and refractory autoimmune cytopenias. Patients exhibited CD4+ T-cell lymphopenia, decreased T-cell proliferation, cell cycle progression, and increased T-cell apoptosis in response to mitogens. In vitro T-cell differentiation of CD34+ cells and molecular signatures of rearrangements at the T-cell receptor α (TRA) locus were indicative of impaired thymocyte survival. These patients also manifested neutropenia and B-cell and natural killer (NK)-cell lymphopenia. Lentivirus-mediated transfer of the SASH3 complementary DNA-corrected protein expression, in vitro proliferation, and signaling in SASH3-deficient Jurkat and patient-derived T cells. These findings define a new type of X-linked combined immunodeficiency in humans that recapitulates many of the abnormalities reported in mice with Sly1-/- and Sly1Δ/Δ mutations, highlighting an important role of SASH3 in human lymphocyte function and survival.


Figures

None
Graphical abstract
Figure 1.
Figure 1.
Pedigrees, SASH3 genetic variants, and protein expression. (A) Pedigrees and familial segregation of mutant SASH3 alleles. Probands are indicated as P1to P4. SASH3 variants detected by whole-exome sequencing are designated at the nucleotide and amino acid level below each patient. (B) Sanger sequencing confirmation of SASH3 variants. The patient is identified on the upper left of each chromatogram (M., mother). Arrows designate the mutated nucleotide. Parental sequencing was not obtained for P2 or for P4 who was adopted. (C) SASH3 variants are predicted to be damaging. Plot of combined annotation depletion dependent (CADD, version 13) score vs minor allele frequency (MAF) of SASH3 modified from PopViz (Rockefeller University, New York, NY). The dotted horizontal line corresponds to the SASH3 mutation significance cutoff (MSC) score. Arrows identify the CADD score of each of the SASH3 variants detected in the patients, all of which were private (MAF = 0). (D) Schematic representation of the SASH3 protein and its domains. Locations of the patients’ variants are indicated by vertical red lines. Numbers indicate amino acid positions. (E) SASH3 protein is not detectable in patients with nonsense SASH3 variants. The immunoblot shows results for SASH3 and β-actin protein expression in PBMC lysates for the patients identified above each lane. CTRL, control, NES, nuclear export signal; NLS1, nuclear localization signal 1; NLS2, nuclear localization signal 2; NR, not reported.
Figure 2.
Figure 2.
Activation profiles of SASH3-mutated T cells after in vitro stimulation with mitogens. (A) Representative plots of CD25, CD71, CD98, and GLUT1 expression in (left) CD4+ and (right) CD8+ T cells from P2 (red) and a healthy control (solid gray) in resting conditions or upon activation with anti-CD3 and anti-CD28 or anti-CD3 and anti-CD28 plus IL-2 in CD4+ T cells. (B) Cumulative mean fluorescence intensity (MFI) data for CD25, CD71, CD98, and GLUT1 expression in (left) CD4+ and (right) CD8+ T cells from controls (n = 5; solid gray) and SASH3-mutated patients (red). Bars represent mean values ± standard error of the mean. *P ≤ .05. Unstim, unstimulated.
Figure 3.
Figure 3.
Proliferation, cell cycle, and apoptosis of SASH3-mutated T cells after in vitro stimulation with mitogens. (A) Top: Representative plots showing Cell Trace Violet (CTV) staining in CD4+ or CD8+ T cells from P2 (red line) and control (solid gray). Red numbers correspond to the frequency of CTVlow proliferating cells (black bar). Bottom: Cumulative percentage of CTVlow cells among CD4+ or CD8+ T cells from controls (solid gray) or SASH3-mutated patients (red) in resting conditions or upon stimulation with anti-CD3 and anti-CD28, anti-CD3 and anti-CD28 plus IL-2, or PMA and ionomycin. Response to PMA and ionomycin was not studied in P3 because of a lack of available cells. Bars represent mean values ± standard error of the mean. (B) Cell cycle analysis. PBMCs from controls (CTRL1 and CRTL2) and patients (P1, P2, P4) were stimulated with anti-CD3 and anti-CD28 for 96 hours, or with PMA and ionomycin for 72 hours and then stained with 5-ethynyl-2′-deoxyuridine (EdU) and DAPI. A decreased proportion of cells in S phase and an accumulation of cells in G2/M phase were observed in the patients. (C) Analysis of cell apoptosis. PBMCs from controls (CTRL1 to CTRL3) and patients (P1, P2, P4) were either left unstimulated or were cultured with anti-CD3 and anti-CD28 or PMA and ionomycin for 96 hours and stained with annexin V and DAPI for 30 minutes; live cells were counted by flow cytometry. P3 was not studied because of lack of available cells. Increased apoptosis was observed in all patient samples when compared with controls. Statistical analysis was performed by comparing the percentage of annexin V+ cells in patients vs controls. *P ≤ .05; **P ≤ .01; ***P ≤ .001; ****P ≤ .0001.
Figure 4.
Figure 4.
TCR signaling in SASH3-mutated patients. Immunoblots for the indicated proteins and phosphorylated proteins on lysates from 5 × 10³ CD3+ T cells (obtained from PBMCs upon negative selection with magnetic beads) with (+) and without (–) stimulation with anti-CD3 and anti-CD28 Dynabeads for 20 minutes from 3 healthy controls and P1 and P2. β-actin was used as loading control.
Figure 5.
Figure 5.
HTS analysis of the TRA repertoire in SASH3-mutated patients. (A) Representative heat maps depicting and gene pairing in (left) unique and (right) total sequences of T cells from a healthy control, P1, and P3. The most upstream and most downstream gene segments at the TRA locus are shaded in light pink. (B) Shannon [H] entropy diversity index of unique T-cell reads. (C) Representation of the frequency of 1000 most represented clonotypes among all clonotypes in T cells from 3 controls, P1, and P3. (D) Percentage of (left) unique and (right) total clonotypes containing hydrophobic amino acid residues at positions 6 and 7 (P6 and P7) of the TRA-CDR3. Results are shown for 3 healthy controls (gray circles), P1 (red square), and P3 (red triangle). Bars represent mean values ± SD (B,D). *P < .05.
Figure 6.
Figure 6.
In vitro T-cell differentiation of CD34+CD3 hematopoietic stem and progenitor cells (HSPCs). (A) Representative analysis of T-cell differentiation of control and P2 HSPCs after 6 weeks of culture in an ATO system. The fluorescence-activated cell sorter (FACS) plots show expression of early and late markers of T-cell differentiation upon gating on LIVE/DEADCD45+CD14CD56CD34 cells. (B) The bar graph shows the absolute cell counts per ATO of indicated cell subsets in control (gray bar) and P2 (red bar) samples analyzed in parallel. (C) The histograms show distribution of cells in the different phases of cell cycle after cell staining for DNA content (DAPI) in control and P2, upon gating on total CD45+CD56 cells. (D) The bar graph shows the frequency of apoptotic cells after staining with annexin V and DAPI in control and P2 upon gating on total CD45+CD56 cells. (E-F) FACS plot representing CXCR4 and CD98 expression in more immature (CD5+CD7hi or CD1a+CD7+) and more mature (CD5+CD7lo or CD1a+CD7) developing T-cell progenitors and in mature TCRαβ+CD3+ cells.
Figure 7.
Figure 7.
Lentivirus-mediated correction of SASH3 deficiency in Jurkat cells and in patient-derived T cells. (A) Top: transduction efficiency as measured by mCherry expression in wild-type (WT) and SASH3−/− Jurkat cells upon transduction with mock and SASH3 lentivirus (LV) vectors. Bottom: western blot showing reconstitution of SASH3 protein expression in SASH3−/− Jurkat cells upon transduction with the SASH3 LV vector. (B) Correction of the proliferative defect of SASH3−/− Jurkat cells upon transduction with the SASH3 LV vector. WT, wild-type Jurkat; mock, SASH3−/− Jurkat cells transduced with mock LV vector; SASH3, SASH3−/− Jurkat cells transduced with the SASH3 LV vector. Statistical significance was assessed with 2-way analysis of variance for multiple comparisons. (C) Dot-plot showing transduction efficiency (as measured by mCherry expression) in control- and P2-derived T-cell blasts upon transduction with mock and SASH3 LV vectors. (D) Top: western blot showing reconstitution of PLCγ1 phosphorylation in SASH3-transduced P2 T cells upon in vitro stimulation with anti-CD3 and anti-CD28. Bottom: densitometric quantification of phosphorylated PLCγ1 (pPLCγ1) protein expression in mock- and SASH3-transduced P2 T cells in 2 distinct experiments (identified by different symbols). Results are expressed as pPLCγ1:glyceraldehyde-3-phosphate dehydrogenase (GAPDH) ratio and compared with what was detected in mock-transduced control cells, which were given a value of 1.0.

References

    1. Chakraborty AK, Weiss A.. Insights into the initiation of TCR signaling. Nat Immunol. 2014;15(9):798-807. - PMC - PubMed
    1. Tangye SG, Al-Herz W, Bousfiha A, et al. . Human inborn errors of immunity: 2019 update on the Classification from the International Union of Immunological Societies Expert Committee. J Clin Immunol. 2020;40(1):24-64. - PMC - PubMed
    1. Speckmann C, Doerken S, Aiuti A, et al. ; P-CID study of the Inborn Errors Working Party of the EBMT . A prospective study on the natural history of patients with profound combined immunodeficiency: An interim analysis. J Allergy Clin Immunol. 2017;139(4):1302-1310.e4. - PMC - PubMed
    1. Beer S, Scheikl T, Reis B, Hüser N, Pfeffer K, Holzmann B.. Impaired immune responses and prolonged allograft survival in Sly1 mutant mice. Mol Cell Biol. 2005;25(21):9646-9660. - PMC - PubMed
    1. Kukuk L, Dingley AJ, Granzin J, et al. . Structure of the SLy1 SAM homodimer reveals a new interface for SAM domain self-association. Sci Rep. 2019;9(1):54. - PMC - PubMed

Publication types

MeSH terms

Substances