Clinical Trial
. 2021 Sep 2;138(9):773-784.
doi: 10.1182/blood.2020010510.

14q32 rearrangements deregulating BCL11B mark a distinct subgroup of T-lymphoid and myeloid immature acute leukemia

Affiliations
Clinical Trial

14q32 rearrangements deregulating BCL11B mark a distinct subgroup of T-lymphoid and myeloid immature acute leukemia

Danika Di Giacomo et al. Blood. .

Abstract

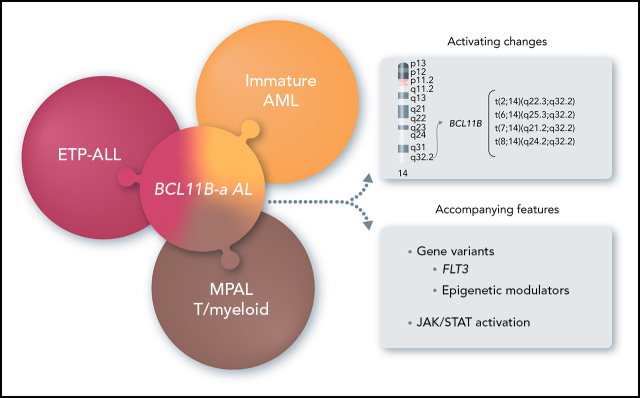
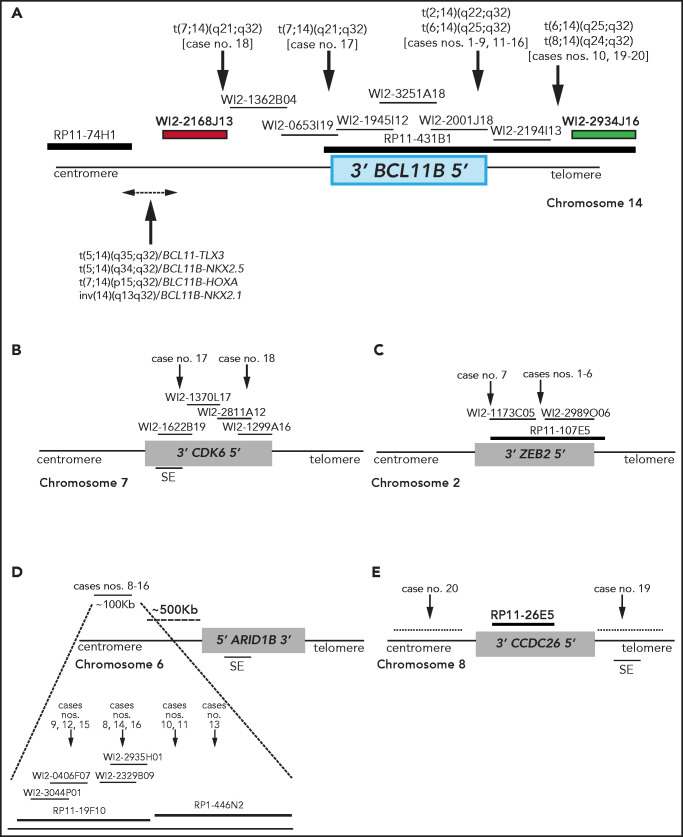
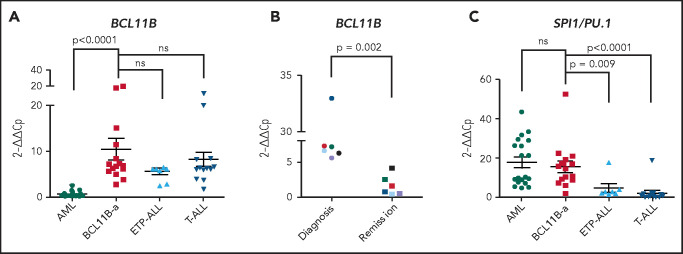
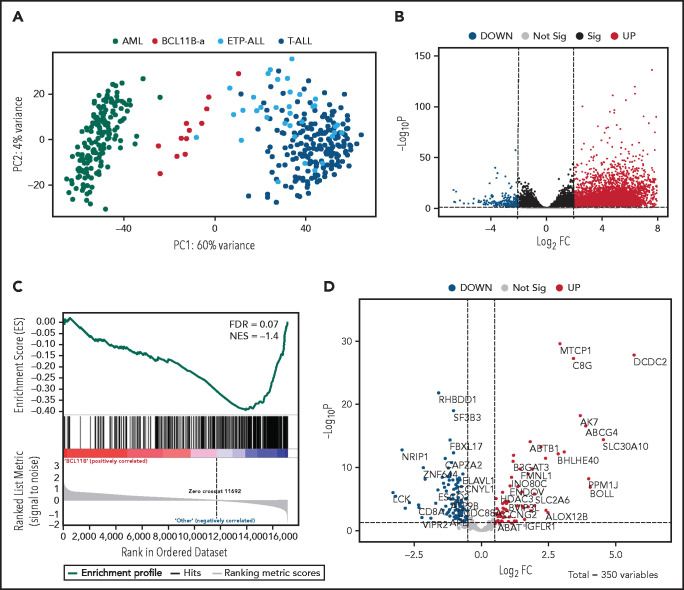
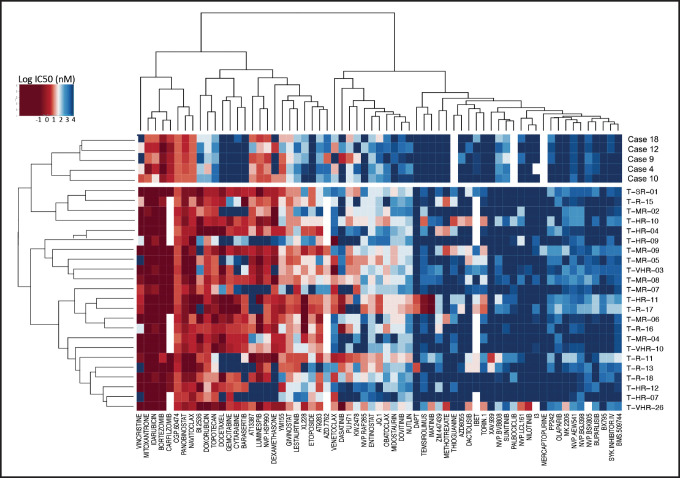
Acute leukemias (ALs) of ambiguous lineage are a heterogeneous group of high-risk leukemias characterized by coexpression of myeloid and lymphoid markers. In this study, we identified a distinct subgroup of immature acute leukemias characterized by a broadly variable phenotype, covering acute myeloid leukemia (AML, M0 or M1), T/myeloid mixed-phenotype acute leukemia (T/M MPAL), and early T-cell precursor acute lymphoblastic leukemia (ETP-ALL). Rearrangements at 14q32/BCL11B are the cytogenetic hallmark of this entity. In our screening of 915 hematological malignancies, there were 202 AML and 333 T-cell acute lymphoblastic leukemias (T-ALL: 58, ETP; 178, non-ETP; 8, T/M MPAL; 89, not otherwise specified). We identified 20 cases of immature leukemias (4% of AML and 3.6% of T-ALL), harboring 4 types of 14q32/BCL11B translocations: t(2,14)(q22.3;q32) (n = 7), t(6;14)(q25.3;q32) (n = 9), t(7;14)(q21.2;q32) (n = 2), and t(8;14)(q24.2;q32) (n = 2). The t(2;14) produced a ZEB2-BCL11B fusion transcript, whereas the other 3 rearrangements displaced transcriptionally active enhancer sequences close to BCL11B without producing fusion genes. All translocations resulted in the activation of BCL11B, a regulator of T-cell differentiation associated with transcriptional corepressor complexes in mammalian cells. The expression of BCL11B behaved as a disease biomarker that was present at diagnosis, but not in remission. Deregulation of BCL11B co-occurred with variants at FLT3 and at epigenetic modulators, most frequently the DNMT3A, TET2, and/or WT1 genes. Transcriptome analysis identified a specific expression signature, with significant downregulation of BCL11B targets, and clearly separating BCL11B AL from AML, T-ALL, and ETP-ALL. Remarkably, an ex vivo drug-sensitivity profile identified a panel of compounds with effective antileukemic activity.


Figures

None
Graphical abstract
Figure 1.
Figure 1.
Breakpoint characterization in BCL11B-a AL. (A) Break-apart FISH assay differentiating t(2;14), t(6;14), t(7;14), and t(8;14) translocations (fosmid WI2-2168J13, red and fosmid WI2-2934J16, green) from 4 known rearrangements in T-ALL. The thin black horizontal lines represent fosmids that were used to narrow the 14q32 breakpoints. Arrows indicate the mapping of the breakpoint in each case. (B-E) Mapping of breakpoints at CDK6/7q21.2 (B); ZEB2/2q22.3 (C); 6q25.3 (D); 8q24 (E). Patient case numbers refer to Table 1. The figure panels are not to scale. SE, superenhancer.
Figure 2.
Figure 2.
14q32 rearrangements result in the activation of BCL11B and SPI1/PU.1. (A) Expression of BCL11B in 15 BCL11B-a AL cases (1-4, 6-13, 17-18, and 20; Table 1) compared with in-house series of AML (n = 19), ETP-ALL (n = 8), and T-ALL (n = 15) cases. (B) One of 3 independent experiments showing longitudinal expression of BCL11B in 6 paired diagnosis-remission BCL11B-a AL cases: case 4 (black), case 6 (blue), case 8 (red), case 9 (green), case 17 (light blue), and case 18 (violet). Patient case numbers refer to Table 1. (C) Expression of SPI1/PU.1 in 15 BCL11B-a cases (1-4, 6-13, 17-18, 20; Table 1) compared with in-house series of AML (n = 19), ETP-ALL (n = 7), and T-ALL (n = 15) cases. Values are expressed as means ± standard error of the mean. Cp, crossing point; ns, not significant.
Figure 3.
Figure 3.
Distinct expression profile in BCL11B-a AL. (A) Scatter plot showing variance distribution of BCL11B-a AL, AML, ETP-ALL, and T-ALL cases emphasized by principal component analysis 1 (PC1). (B) Volcano plot showing the gene expression in BCL11B-a AL cases compared with AML, ETP-ALL, and T-ALL. Log2FC is plotted against the −Log10-adjusted P value. Black indicates genes with a significant FDR (≤0.05). Red and blue represent upregulated and downregulated differentially expressed genes, respectively (FDR ≤ 0.05, |Log2 FC| ≥2). Gray, nonsignificantly expressed genes. (C) Gene set enrichment analysis of BCL11B target genes in BCL11B-a AL cases vs other leukemic groups (AML, ETP-ALL, and T-ALL). (D) Volcano plot showing the distribution of 350 BCL11B targets in BCL11B-a AL cases compared with other leukemias. Log2FC is plotted against the −Log10-adjusted P value. Red and blue represent significant (FDR ≤0.05) upregulated and downregulated targets, respectively; NES, normalized enrichment score; FC, fold change.
Figure 4.
Figure 4.
Mutational profile of BCL11B-a AL. Oncoprint heat map showing all sequence variants detected in BCL11B-a AL cases. In addition to somatic mutations (dark green), variants in which the somatic or germline origin could not be definitively assessed (light green) are indicated. Additional gene alterations are represented by different colors. Mutational analysis was not performed in cases 15 and 19 because of lack of material. cnLOH, copy neutral loss of heterozygosity.
Figure 5.
Figure 5.
Drug response profile of BCL11B-a AL. Heat map indicating the response of BCL11B-a AL (5 cases: 4, 9, 10, 12, and 18) compared with T-ALL (23 cases) to 65 compounds and represented by 50% inhibitory concentration values (IC50). Samples (rows) are in order according to clinical classification (BCL11B-a AL and T-ALL), and compounds are reported in columns.

Comment in

References

    1. Swerdlow SH, Campo E, Harris NL, et al. . WHO Classification of Tumours of Haematopoietic and Lymphoid Tissues. 4th ed., revised. Lyon, France: World Health Organization; 2017.
    1. Alexander TB, Gu Z, Iacobucci I, et al. . The genetic basis and cell of origin of mixed phenotype acute leukaemia. Nature. 2018; 562(7727):373-379. - PMC - PubMed
    1. Takahashi K, Wang F, Morita K, et al. . Integrative genomic analysis of adult mixed phenotype acute leukemia delineates lineage associated molecular subtypes. Nat Commun. 2018;9(1):2670. - PMC - PubMed
    1. Patrick K, Wade R, Goulden N, et al. . Outcome for children and young people with Early T-cell precursor acute lymphoblastic leukaemia treated on a contemporary protocol, UKALL 2003. Br J Haematol. 2014; 166(3):421-424. - PubMed
    1. Conter V, Valsecchi MG, Buldini B, et al. . Early T-cell precursor acute lymphoblastic leukaemia in children treated in AIEOP centres with AIEOP-BFM protocols: a retrospective analysis. Lancet Haematol. 2016; 3(2):e80-e86. - PubMed

Publication types

MeSH terms