Interocular Grouping in Perceptual Rivalry Localized with fMRI
- PMID: 33876330
- PMCID: PMC8099824
- DOI: 10.1007/s10548-021-00834-4
Interocular Grouping in Perceptual Rivalry Localized with fMRI
Abstract
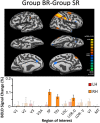
Bistable perception refers to a broad class of dynamically alternating visual illusions that result from ambiguous images. These illusions provide a powerful method to study the mechanisms that determine how visual input is integrated over space and time. Binocular rivalry occurs when subjects view different images in each eye, and a similar experience called stimulus rivalry occurs even when the left and right images are exchanged at a fast rate. Many previous studies have identified with fMRI a network of cortical regions that are recruited during binocular rivalry, relative to non-rivalrous control conditions (termed replay) that use physically changing stimuli to mimic rivalry. However, we show here for the first time that additional cortical areas are activated when subjects experience rivalry with interocular grouping. When interocular grouping occurs, activation levels broadly increase, with a slight shift towards right hemisphere lateralization. Moreover, direct comparison of binocular rivalry with and without grouping highlights strong focused activity in the intraparietal sulcus and lateral occipital areas, such as right-sided retinotopic visual areas LO1 and IP2, as well as activity in left-sided visual areas LO1, and IP0-IP2. The equivalent analyses for comparable stimulus (eye-swap) rivalry showed very similar results; the main difference is greater recruitment of the right superior parietal cortex for binocular rivalry, as previously reported. Thus, we found minimal interaction between the novel networks isolated here for interocular grouping, and those previously attributed to stimulus and binocular rivalry. We conclude that spatial integration (i.e,. image grouping/segmentation) is a key function of lateral occipital/intraparietal cortex that acts similarly on competing binocular stimulus representations, regardless of fast monocular changes.
Keywords: Binocular; Flicker-and-swap; Gestalt; Illusory contours; Lateral occipital; Monocular.
Figures


Similar articles
-
Bistable percepts in the brain: FMRI contrasts monocular pattern rivalry and binocular rivalry.PLoS One. 2011;6(5):e20367. doi: 10.1371/journal.pone.0020367. Epub 2011 May 23. PLoS One. 2011. PMID: 21629791 Free PMC article. Clinical Trial.
-
Deactivation in the posterior mid-cingulate cortex reflects perceptual transitions during binocular rivalry: Evidence from simultaneous EEG-fMRI.Neuroimage. 2017 May 15;152:1-11. doi: 10.1016/j.neuroimage.2017.02.041. Epub 2017 Feb 20. Neuroimage. 2017. PMID: 28219776 Free PMC article.
-
Stimulus flicker alters interocular grouping during binocular rivalry.Vision Res. 2007 Jan;47(1):1-7. doi: 10.1016/j.visres.2006.09.007. Epub 2006 Nov 2. Vision Res. 2007. PMID: 17083956
-
How does binocular rivalry emerge from cortical mechanisms of 3-D vision?Vision Res. 2008 Sep;48(21):2232-50. doi: 10.1016/j.visres.2008.06.024. Epub 2008 Aug 13. Vision Res. 2008. PMID: 18640145 Review.
-
Single units and conscious vision.Philos Trans R Soc Lond B Biol Sci. 1998 Nov 29;353(1377):1801-18. doi: 10.1098/rstb.1998.0333. Philos Trans R Soc Lond B Biol Sci. 1998. PMID: 9854253 Free PMC article. Review.
Cited by
-
Magnocellular-biased interocular integration during onset rivalry in normal vision and binocular imbalance.J Vis. 2025 Aug 1;25(10):8. doi: 10.1167/jov.25.10.8. J Vis. 2025. PMID: 40824263 Free PMC article.
-
Perceptual Resolution of Ambiguity: Can Tuned, Divisive Normalization Account for both Interocular Similarity Grouping and Difference Enhancement.bioRxiv [Preprint]. 2024 Jun 26:2024.04.01.587646. doi: 10.1101/2024.04.01.587646. bioRxiv. 2024. PMID: 38617235 Free PMC article. Preprint.
-
Effects of interocular grouping demands on binocular rivalry.J Vis. 2023 Sep 1;23(10):15. doi: 10.1167/jov.23.10.15. J Vis. 2023. PMID: 37733337 Free PMC article.
References
-
- Alais D, Blake R. Binocular rivalry. Cambridge, MA: MIT Press; 2005.
-
- Andersen RA (2011) Inferior parietal lobule function in spatial perception and visuomotor integration, supplement 5. Handbook of physiology, the nervous system, higher functions of the brain, Wiley Online Library. 10.1002/cphy.cp010512
Publication types
MeSH terms
LinkOut - more resources
Full Text Sources
Other Literature Sources
Medical

