. 2021 Jun;89(6):1195-1211.
doi: 10.1002/ana.26084. Epub 2021 Apr 30.

Gut Microbiome in Progressive Multiple Sclerosis

Affiliations

Gut Microbiome in Progressive Multiple Sclerosis

Laura M Cox et al. Ann Neurol. 2021 Jun.

Abstract

Objective: This study was undertaken to investigate the gut microbiome in progressive multiple sclerosis (MS) and how it relates to clinical disease.

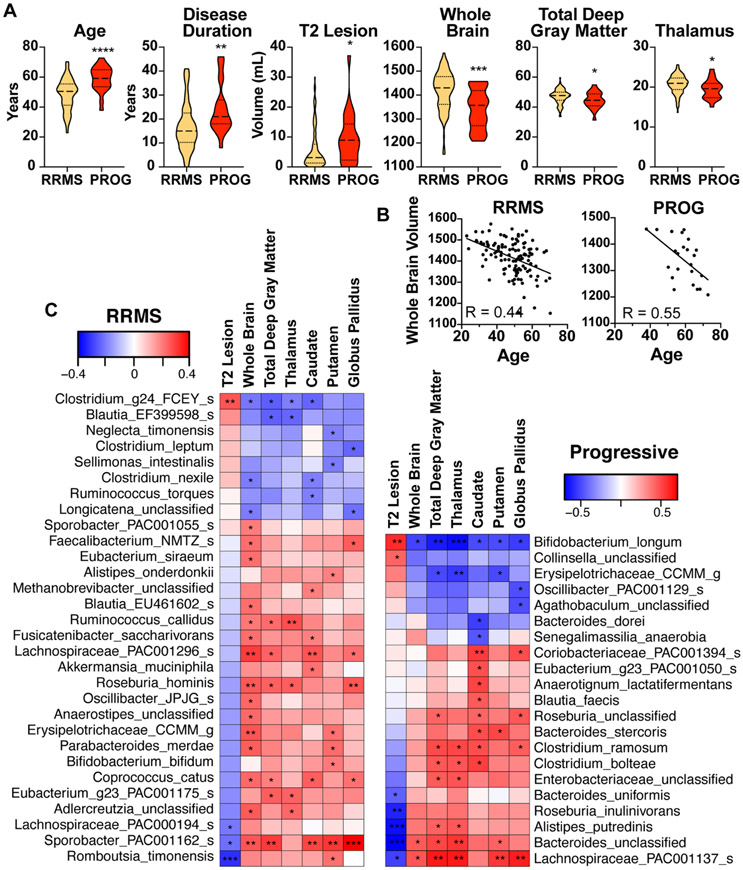
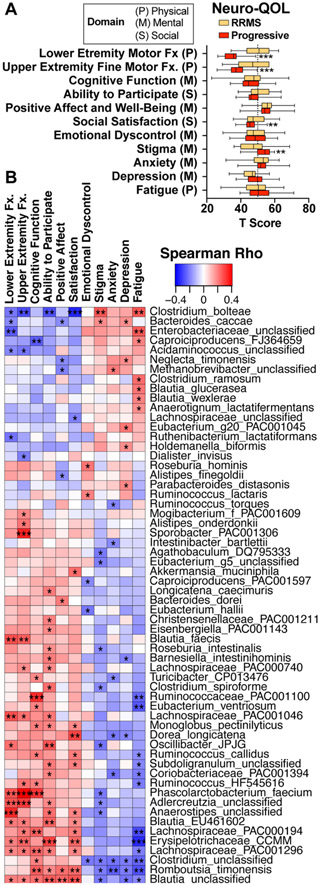
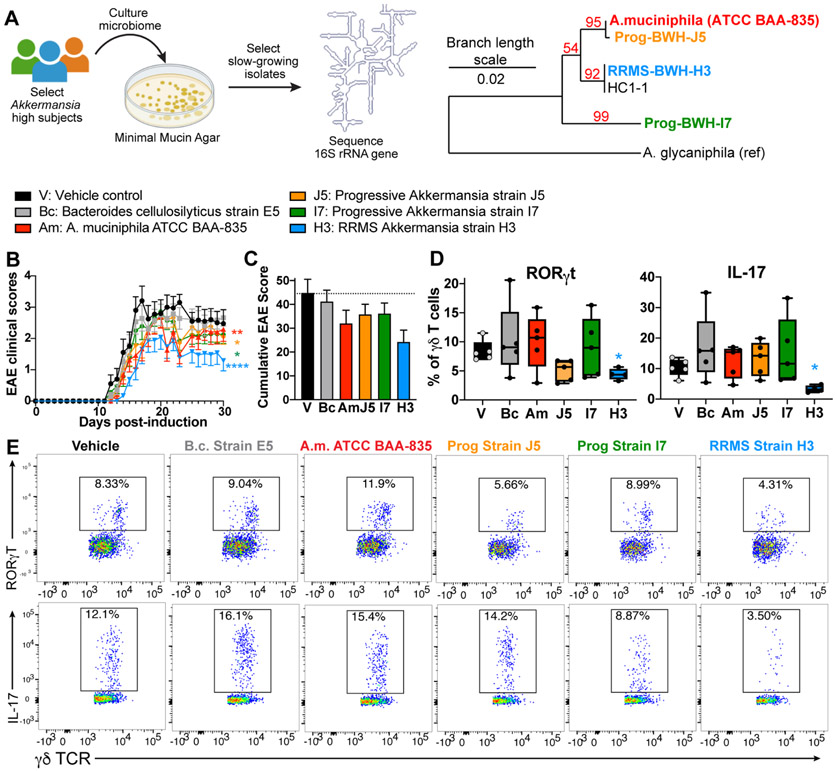
Methods: We sequenced the microbiota from healthy controls and relapsing-remitting MS (RRMS) and progressive MS patients and correlated the levels of bacteria with clinical features of disease, including Expanded Disability Status Scale (EDSS), quality of life, and brain magnetic resonance imaging lesions/atrophy. We colonized mice with MS-derived Akkermansia and induced experimental autoimmune encephalomyelitis (EAE).

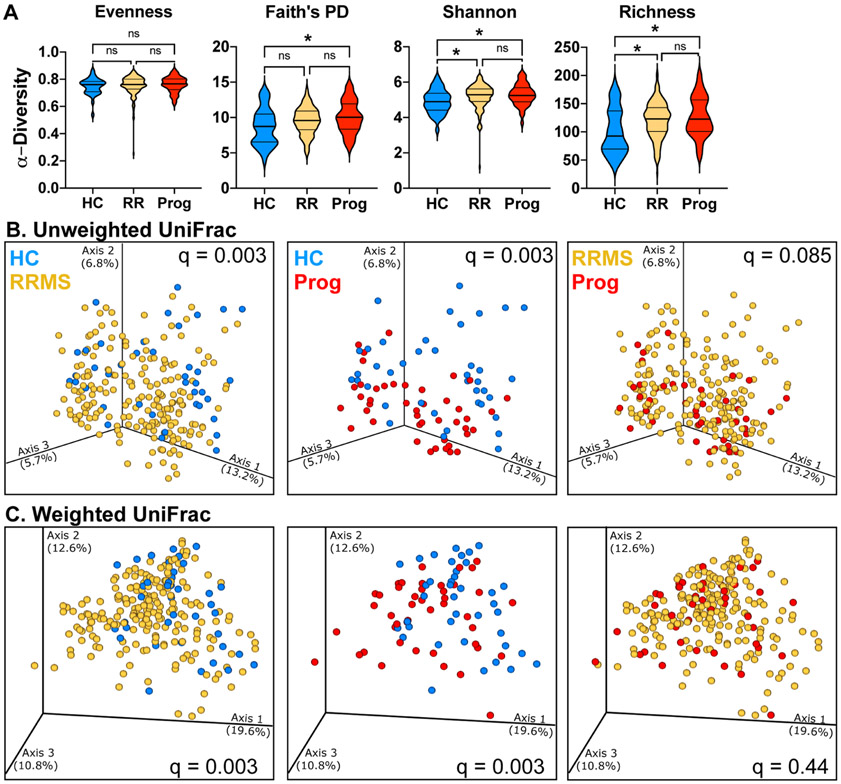
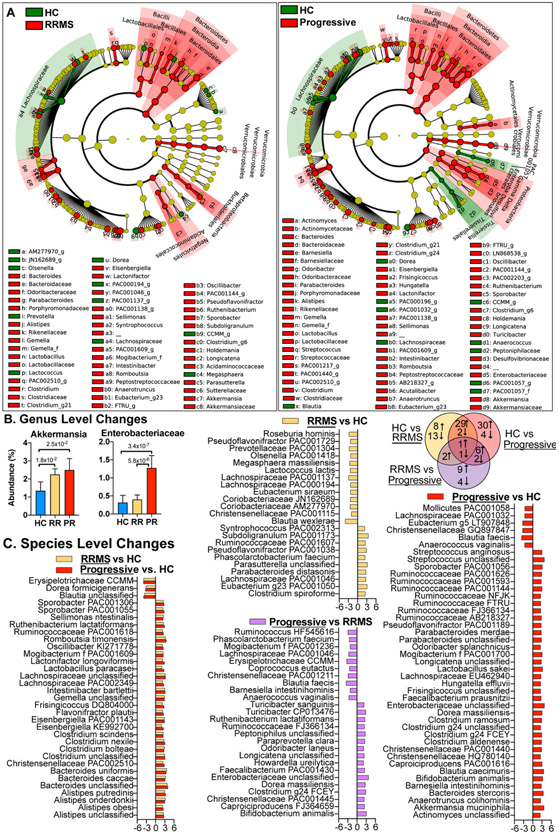
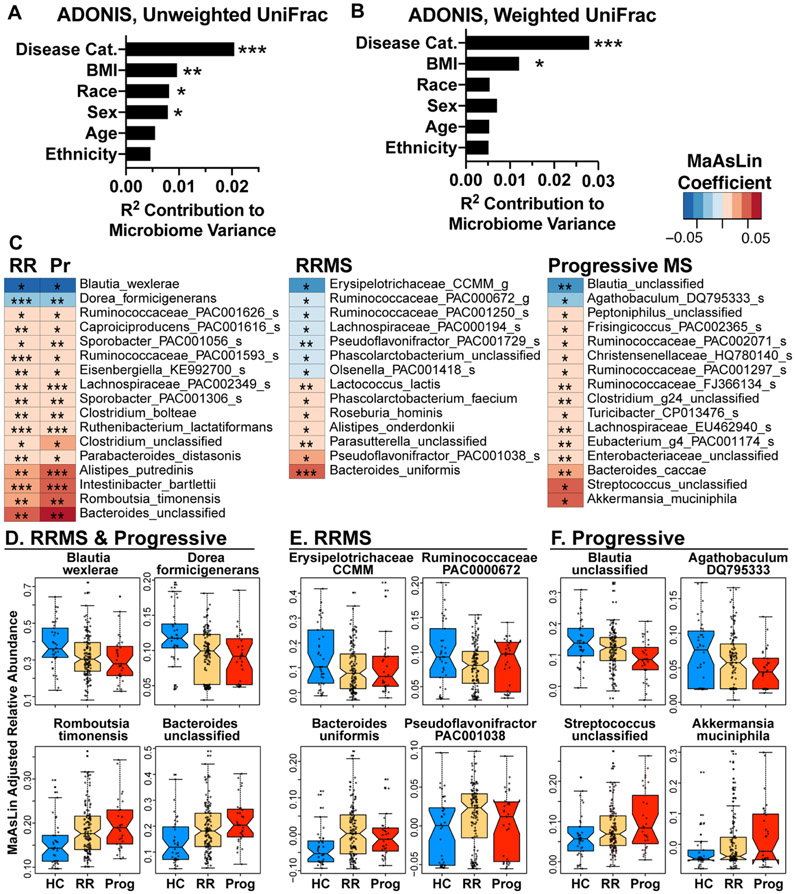
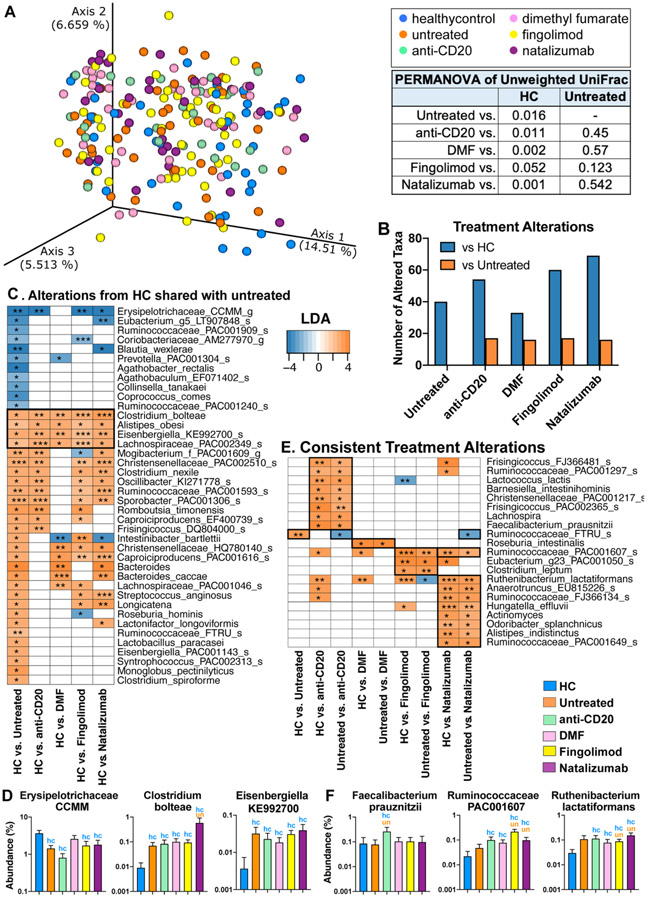
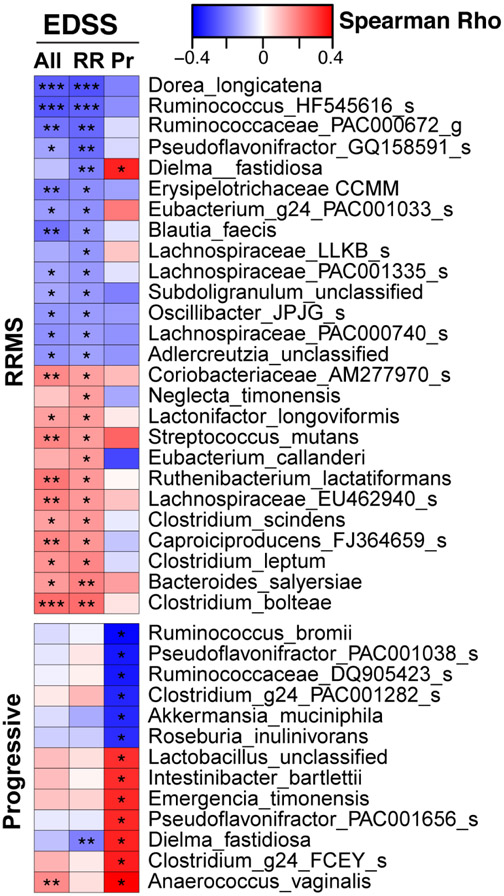
Results: Microbiota β-diversity differed between MS patients and controls but did not differ between RRMS and progressive MS or differ based on disease-modifying therapies. Disease status had the greatest effect on the microbiome β-diversity, followed by body mass index, race, and sex. In both progressive MS and RRMS, we found increased Clostridium bolteae, Ruthenibacterium lactatiformans, and Akkermansia and decreased Blautia wexlerae, Dorea formicigenerans, and Erysipelotrichaceae CCMM. Unique to progressive MS, we found elevated Enterobacteriaceae and Clostridium g24 FCEY and decreased Blautia and Agathobaculum. Several Clostridium species were associated with higher EDSS and fatigue scores. Contrary to the view that elevated Akkermansia in MS has a detrimental role, we found that Akkermansia was linked to lower disability, suggesting a beneficial role. Consistent with this, we found that Akkermansia isolated from MS patients ameliorated EAE, which was linked to a reduction in RORγt+ and IL-17-producing γδ T cells.

Interpretation: Whereas some microbiota alterations are shared in relapsing and progressive MS, we identified unique bacteria associated with progressive MS and clinical measures of disease. Furthermore, elevated Akkermansia in MS may be a compensatory beneficial response in the MS microbiome. ANN NEUROL 2021;89:1195-1211.


Conflict of interest statement

POTENTIAL CONFLICTS OF INTEREST

Nothing to report.

Figures

Figure 1.
Figure 1.. Microbiota α- and β-diversity in relapsing and progressive MS.
A) Alpha diversity metrics for Evenness, Faith’s phylogenetic diversity, Shannon diversity, and richness (number of features) were calculated at an average sampling depth of 5,000 reads per sample in healthy controls (n = 40), RRMS (n = 199), and progressive MS (n = 44). * p < 0.05 Kruskal-Wallis. B-C) Principal coordinate analysis of intestinal microbiota samples based on unweighted (B) and weighted (C) UniFrac distances show significantly different clustering between HC and RRMS, between HC and progressive MS, but not between RRMS and progressive MS, q = PERMANOVA p-values adjusted for false discovery rate. Each dot represents the microbiota from one individual. HC, healthy control (blue), RRMS (yellow), or progressive MS (red).
Figure 2.
Figure 2.. Compositional differences in the microbiota of progressive and relapsing MS.
Microbiota was sequenced in healthy controls (HC, n=40), RRMS (n = 199), and Progressive MS (n = 44) subjects. A) Differences are visualized on a cladogram, which shows all changes at the phylum level (inner dots, outer wedge label) through genus level (outer dots, labeled with small letters for abbreviation). Red (MS) or green (HC) circles indicate increased levels in corresponding groups, yellow circles indicates a taxon present but not differentially abundant. Size of the dot corresponds to the overall abundance of that taxon in the microbiome. B) The relative abundance of selected microbiota altered in progressive MS. C) LDA effect size of significantly altered bacteria at the lowest classifiable levels and Venn diagram showing the number of bacteria increased or decreased in each comparison. Positive LDA effect size = up in the underlined group.
Figure 3.
Figure 3.. Microbiota differences adjusted for host variables.
A-B) Effect of host factors on microbiome beta-diversity was measured using the ADONIS test of unweighted and weighted UniFrac distances. Analysis was restricted to subjects with complete demographic information and a recorded BMI, (n = 38 HC, n = 135 RRMS, n = 31 progressive MS) C) Microbiota altered in RR or progressive MS vs. healthy control, MaAsLin, adjusted for age, BMI, sex, race, and ethnicity. D-F) Abundance of the two most decreased taxa and two most increased taxa in both RRMS and progressive MS vs. HC (D), unique to RRMS (E), or unique to progressive MS (F). * p < 0.05, ** p < 0.01, ***p < 0.001.
Figure 4.
Figure 4.. The effect of treatment on the MS microbiota.
A) PCoA of unweighted UniFrac distances of RRMS and progressive subjects not on treatment (n = 33) or treated with anti-CD20 (n = 25), dimethyl fumarate (n = 33), fingolimod (n = 57), or natalizumab (n = 36), or healthy controls (n = 40). PERMANOVA test for clustering reveals differences between healthy controls and MS patients on treatment, but not between untreated MS patients and those on therapy. B) Number of taxa altered comparing DMT group vs. healthy controls (blue bar) or vs. untreated MS (orange bar). C) Linear discriminant analysis (LDA) effect size of bacteria altered in untreated MS vs. HC, and whether those bacteria are similarly altered in each DMT group. D) Representative bacteria consistently altered in MS, regardless of treatment status. blue hc = significantly different from healthy controls, orange un = significantly different from untreated MS patients, p < 0.05, LDA >2 LEfSe. E) Bacteria consistently altered by DMT vs. HC and DMT vs. untreated MS. F) Representative bacteria consistently altered by treatment compared to both healthy control and untreated MS patients.
Figure 5.
Figure 5.. Microbiota associated with disability.
Microbiota correlations with EDSS scores show unique relationships in RRMS (n = 198) and progressive MS (n = 43), Spearman correlations, adjusted for age. * p < 0.05, ** p < 0.01, *** p < 0.001.
Figure 6.
Figure 6.. Associations between the microbiota and MRI brain measurements in progressive MS.
A) Age, disease duration, and brain 3T MRI measurements in progressive MS (n = 23) and RRMS (n = 116) patients, t-test. B) Brain volume negatively correlated with age, linear regression, p <0.001, R = 0.44 and 0.55 for RRMS and progressive MS, respectively. C) Bacteria that correlate with lesion volume (upper section) and brain volume (lower section) in RRMS and progressive MS. Spearman correlation adjusted for age. * p < 0.05, ** p < 0.01, *** p < 0.001.
Figure 7.
Figure 7.. Microbiota associations with quality of life.
A) Quality of life measurements in 95 relapsing (RRMS) and 27 progressive patients were assessed using the NeuroQOL questionnaire across three domains: physical, mental, and social. Departure from the population norm (T score = 50) in RRMS and progressive patients. B) Microbiota correlations with quality of life, Spearman correlation adjusted for age. * p<0.05, **<0.01, ***< 0.001.
Figure 8.
Figure 8.. MS-associated Akkermansia ameliorates EAE.
A) Stool samples from MS patients with high levels of Akkermansia, corresponding to 3 different V4 16S rRNA sequences, were plated on minimal mucin agar, and slow-growing strains were isolated and identified by 16S rRNA Sanger sequencing. Phylogenetic tree constructed from near full length 16S rRNA sequences shows three phylotypes of Akkermansia isolated from HC and MS patients. B) Akkermansia isolated from RRMS and progressive MS subjects reduce EAE score in the C57/MOG model, whereas the control bacteria Bacteroides cellulosilyticus (Bc) does not, n = 10-14 mice per group. * p < 0.05, ** p < 0.01, **** p < 0.0001 Freidman’s test with Dunn’s correction for multiple comparisons. C) Cumulative EAE scores. D-E) Mice were colonized with B. cellulosilyticus, Akkermansia muciniphila Type strain, and three MS-derived Akkermansia strains, n = 5 per group. EAE was induced, and immunologic responses were measured 10 days later. D) Levels of RORγT+ γδ T cells in unstimulated splenocytes and levels of IL-17 production in PMA/ionomycin stimulated splenocytes. * p < 0.05, one-way ANOVA. E) Representative FACs plots of RORγT and IL-17 production from splenic γδ-T cells.

References

    1. Baecher-Allan C, Kaskow BJ, Weiner HL. Multiple Sclerosis: Mechanisms and Immunotherapy. Neuron. 2018;97(4):742–68. Epub 2018/02/23. doi: 10.1016/j.neuron.2018.01.021. PubMed PMID: 29470968. - DOI - PubMed
    1. Cox LM, Weiner HL. Microbiota Signaling Pathways that Influence Neurologic Disease. Neurotherapeutics. 2018;15(1):135–45. Epub 2018/01/18. doi: 10.1007/s13311-017-0598-8. PubMed PMID: 29340928; PMCID: PMC5794708. - DOI - PMC - PubMed
    1. Berer K, Mues M, Koutrolos M, Rasbi ZA, Boziki M, Johner C, Wekerle H, Krishnamoorthy G. Commensal microbiota and myelin autoantigen cooperate to trigger autoimmune demyelination. Nature. 2011;479(7374):538–41. Epub 2011/10/28. doi: 10.1038/nature10554. PubMed PMID: 22031325. - DOI - PubMed
    1. Lee YK, Menezes JS, Umesaki Y, Mazmanian SK. Proinflammatory T-cell responses to gut microbiota promote experimental autoimmune encephalomyelitis. Proc Natl Acad Sci U S A. 2011;108 Suppl 1 (Supplement 1):4615–22. Epub 2010/07/28. doi: 10.1073/pnas.1000082107. PubMed PMID: 20660719; PMCID: PMC3063590. - DOI - PMC - PubMed
    1. Ochoa-Reparaz J, Mielcarz DW, Ditrio LE, Burroughs AR, Foureau DM, Haque-Begum S, Kasper LH. Role of Gut Commensal Microflora in the Development of Experimental Autoimmune Encephalomyelitis. The Journal of Immunology. 2009;183(10):6041–50. doi: 10.4049/jimmunol.0900747. - DOI - PubMed

Publication types

MeSH terms

LinkOut - more resources