

Myeloid-resident neuropilin-1 promotes choroidal neovascularization while mitigating inflammation
- PMID: 33876574
- PMCID: PMC8103107
- DOI: 10.15252/emmm.201911754
Myeloid-resident neuropilin-1 promotes choroidal neovascularization while mitigating inflammation
Abstract
Age-related macular degeneration (AMD) in its various forms is a leading cause of blindness in industrialized countries. Here, we provide evidence that ligands for neuropilin-1 (NRP1), such as Semaphorin 3A and VEGF-A, are elevated in the vitreous of patients with AMD at times of active choroidal neovascularization (CNV). We further demonstrate that NRP1-expressing myeloid cells promote and maintain CNV. Expression of NRP1 on cells of myeloid lineage is critical for mitigating production of inflammatory factors such as IL6 and IL1β. Therapeutically trapping ligands of NRP1 with an NRP1-derived trap reduces CNV. Collectively, our findings identify a role for NRP1-expressing myeloid cells in promoting pathological angiogenesis during CNV and introduce a therapeutic approach to counter neovascular AMD.
Keywords: age-related macular degeneration; angiogenesis; inflammation; mononuclear phagocytes; neuropilin-1.
© 2021 The Authors. Published under the terms of the CC BY 4.0 license.
Conflict of interest statement
P.S. is the founder of and a consultant for SemaThera Inc. G.C. and V.B. are consultants for SemaThera Inc. F.B., N.B., and K.B. are employees of SemaThera Inc. The rest of the authors declare that they have no conflict of interest.
Figures
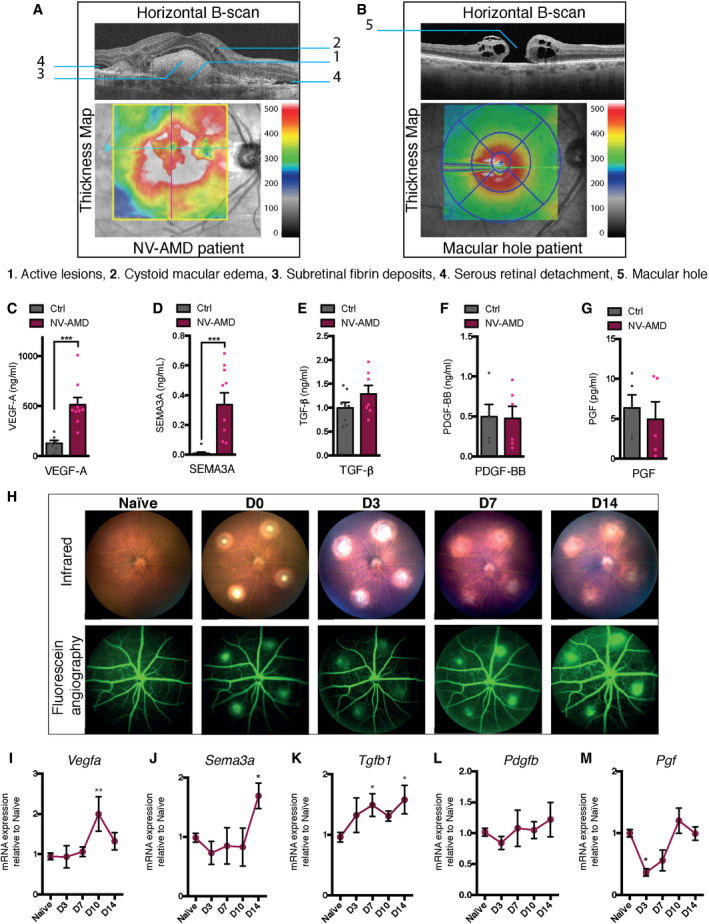
- A
Optical coherence tomography (OCT) horizontal B‐scan and thickness map of neovascular age‐related macular degeneration (NV AMD) patient with active lesions (1), cystoid macular edema (2), subretinal fibrin deposits (3), and serous retinal detachment (4).
- B
Optical coherence tomography (OCT) horizontal B‐scan and thickness map of control patient with a medium sized, stage 3, full thickness macular hole (5).
- C–G
Vitreous humor analyzed by ELISA for VEGF‐A (C); n = 7 (Ctrl), 9 (NV AMD), SEMA3A (D); n = 10 (Ctrl), 10 (NV AMD), TGFβ (E); n = 8 (Ctrl), 7 (NV AMD), PDGF‐BB (F); n = 5 (Ctrl),6 (NV AMD), PGF (G): n = 5 (Ctrl), 5 (NV AMD). Dots represent concentrations of individual patient samples.
- H
Micron IV infrared and fluorescein in vivo imaging of naïve mouse fundus and following laser‐induced CNV at D0, D3, D7, D14.
- I–M
Time course of mRNA expression of NRP1 ligands in mouse RPE‐choroid‐sclera complexes relative to naïve (no burn), 3 (D3), 7 (D7), 10 (D10), and 14 (D14) days after burn for Vegfa (I); n = 11 (No burn), 6 (D3), 7 (D7), 4 (D10 and D14), Sema3a (J); n = 17 (No burn), 6 (D3), 4 (D7), 3 (D10 and D14), Tgfb1 (K); n = 14 (No burn), 3 (D3), 7 (D7), 3 (D10), 6 (D14), Pdgfb (L); n = 9 (No burn), 5 (D3 and D7), 4 (D10 and D14), Pgf (M); n = 6 (No burn), 4 (D3), 3 (D7), 6 (D10), 3 (D14).
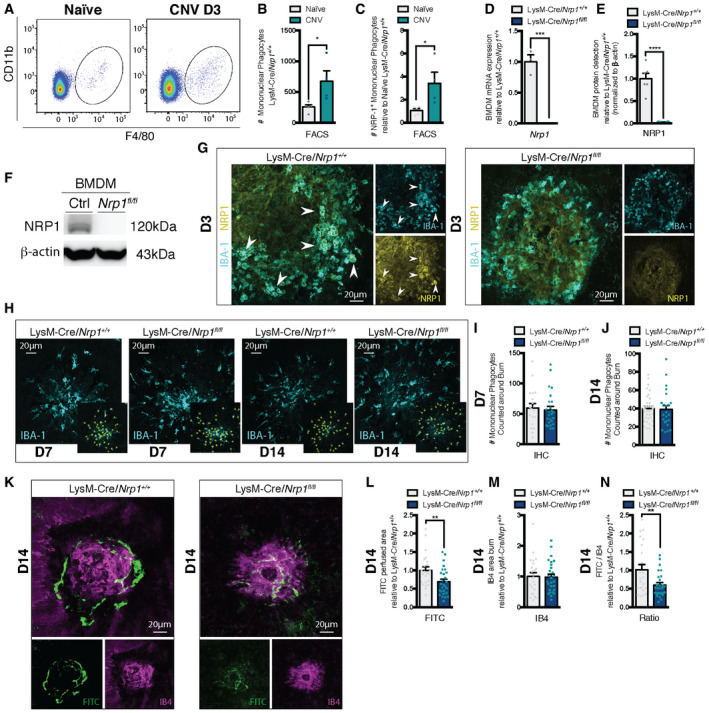
- A
Representative FACS plots of retinas and sclera‐choroid‐RPE cell complexes from naïve and burned mice 3 days (D3) after laser burn.
- B
Quantification of mononuclear phagocytes (Ly6G−, F4/80+, CD11b+) in retinas and sclera‐choroid‐RPE cell complexes at D3 relative to naïve; n = 5 (Naïve), 4 (CNV).
- C
Quantification of NRP1+ mononuclear phagocytes (Ly6G−, F4/80+, CD11b+, NRP1+) in retinas and sclera‐choroid‐RPE cell complexes at D3 relative to naïve; n = 5 (Naïve), 4 (CNV).
- D
mRNA expression of Nrp1 in BMDM relative to LysM‐Cre/Nrp1+/+; n = 3 (LysM‐Cre/Nrp1+/+), n = 4 (LysM‐Cre/Nrp1fl/fl).
- E
Quantification of NRP1 protein expression in LysM‐Cre/Nrp1+/+ and LysM‐Cre/Nrp1fl/fl BMDM; n = 6.
- F
Representative Western blot showing NRP1 expression in LysM‐Cre/Nrp1+/+ (Ctrl) and LysM‐Cre/Nrp1fl/fl (Nrp1fl/fl).
- G
Representative confocal images of NRP1 and IBA1‐stained mononuclear phagocytes on choroidal flat mounts from LysM‐Cre/Nrp1+/+ and LysM‐Cre/Nrp1fl/fl mice at D3. Arrowheads indicate NRP1‐positive mononuclear phagocytes. Scale bar: 20 μm.
- H
Representative confocal images of IBA‐1‐stained mononuclear phagocytes on choroidal flat mounts from LysM‐Cre/Nrp1+/+ and LysM‐Cre/Nrp1fl/fl mice at D7 and D14. Examples of macrophage quantification (yellow stars) are presented in side panels. Scale bar: 20 μm.
- I, J
Total number of IBA‐1‐positive mononuclear phagocytes counted around laser impact area on confocal images of choroidal flat mounts at D7 (I) and D14 (J); n = 19 burns (D7 LysM‐Cre/Nrp1+/+), n = 25 burns (D7 LysM‐Cre/Nrp1fl/fl), n = 37 burns (D7 LysM‐Cre/Nrp1+/+), n = 23 burns (D7 LysM‐Cre/Nrp1fl/fl), 3–5 mice with ~4 burns per eye.
- K
Compilation of representative compressed Z‐stack confocal images of FITC–dextran‐labeled CNV and IB4‐stained laser impact area from LysM‐Cre/Nrp1+/+ and LysM‐Cre/Nrp1fl/fl mice at D14. Scale bar: 20 μm.
- L–N
Quantification of area of FITC–dextran‐labeled CNV (L), isolectin B4 (IB4)‐stained laser impact area (M) and the ratio of FITC/IB4 per laser burn (N) relative to LysM‐Cre/Nrp1+/+ at D14; n = 23 burns (LysM‐Cre/Nrp1+/+), n = 27 burns ( LysM‐Cre/Nrp1fl/fl).
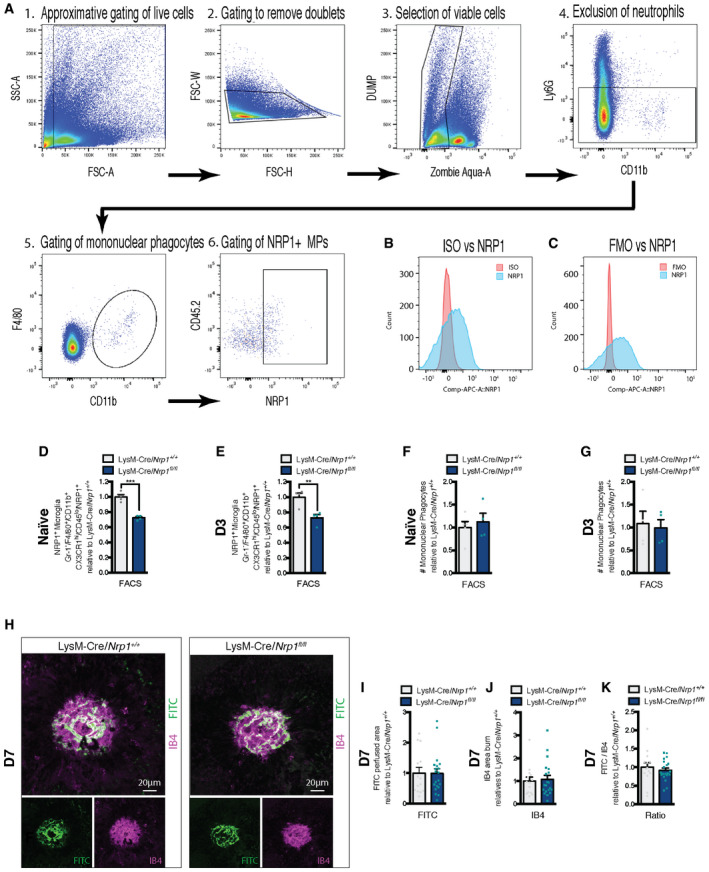
- A
Gating scheme explaining the identification of the Ly6G−, F4/80+, CD11b+, and NRP1+ mononuclear phagocytes in retinas and sclera‐choroid‐RPE cell complexes. 1. Gating of live cells, 2. Removal of doublets, 3. Selection of viable cells, 4. Exclusion of neutrophils, 5. Gating of mononuclear phagocytes, 6. Gating of NRP1+ mononuclear macrophages.
- B
FACS histogram of APC‐conjugated rat IgG2A isotype control (red) versus anti‐mNRP1 APC‐conjugated rat IgG2A (R&D systems) (blue).
- C
FACS histogram of FMO (fluorescence minus one) versus anti‐mNRP1 APC‐conjugated rat IgG2A.
- D, E
Quantification of NRP1‐positive microglia (Ly6G−, F4/80+, CD11b+, CX3CR1hi, CD45lo, NRP1+) in retinas and sclera‐choroid‐RPE cell complexes in Naïve (non‐burned) mice (D); n = 4 and at D3 (E); n = 4.
- F, G
Quantification of mononuclear phagocytes (Ly6G−, F4/80+, CD11b+) in retinas and sclera‐choroid‐RPE cell complexes in Naïve (non‐burned) mice (F); n = 5 (LysM‐Cre/Nrp1+/+), 4 (LysM‐Cre/Nrp1fl/fl) and at D3 (G); n = 4.
- H
Compilation of representative compressed Z‐stack confocal images of FITC–dextran‐labeled CNV and IB4‐stained laser impact area from LysM‐Cre/Nrp1+/+ and LysM‐Cre/Nrp1fl/fl mice at D7. Scale bar: 20 μm.
- I–K
Quantification of area of FITC–dextran‐labeled CNV (I), isolectin B4 (IB4)‐stained laser impact area (J) and the ratio of FITC/IB4 per laser burn (K) relative to LysM‐Cre/Nrp1+/+ at D7; n = 14 burns (LysM‐Cre/Nrp1+/+), n = 20 burns (LysM‐Cre/Nrp1fl/fl).
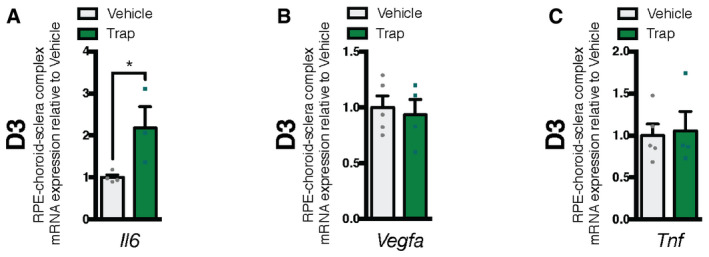
- A–C
mRNA expression of inflammation markers relative to vehicle in mouse RPE‐choroid‐sclera complexes at D3 for Il6 (A); n = 4 (vehicle), n = 4 (trap), Vegfa (B); n = 5 (vehicle), n = 4 (trap), Tnf (C); n = 5 (vehicle), n = 4 (trap).
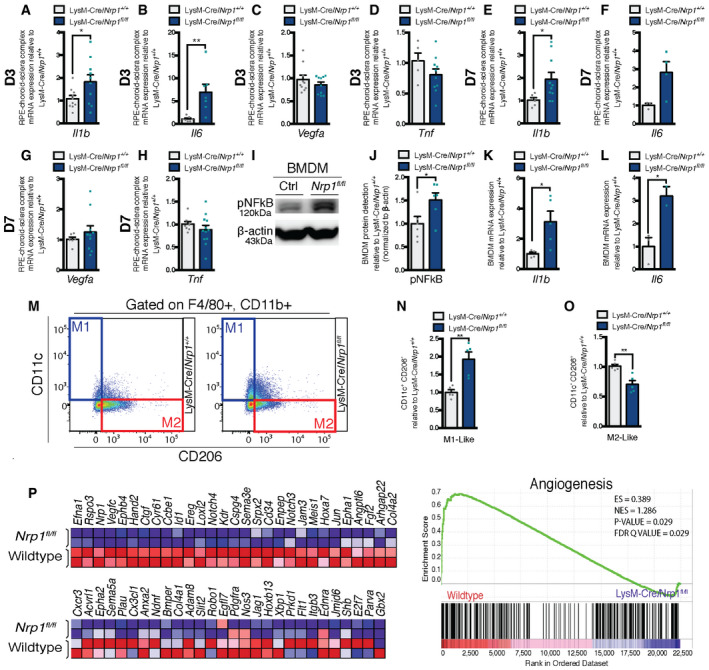
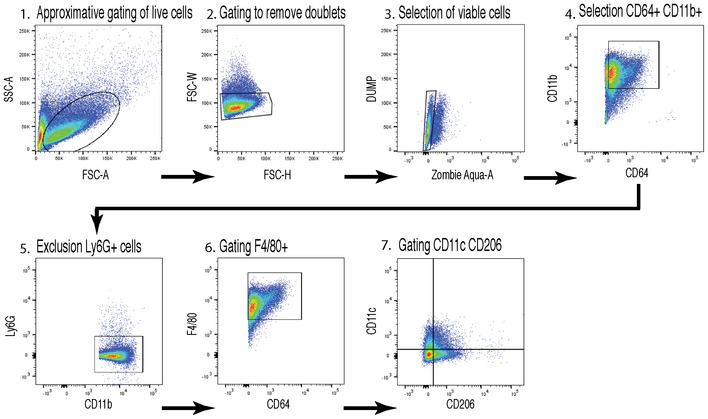
- A–D
mRNA expression of inflammation markers relative to LysM‐Cre/Nrp1+/+ in mouse RPE‐choroid‐sclera complexes at D3 for Il1b (A); n = 10 (LysM‐Cre/Nrp1+/+ and LysM‐Cre/Nrp1fl/fl), Il6 (B); n = 7 (LysM‐Cre/Nrp1+/+ and LysM‐Cre/Nrp1fl/fl), Vegfa (C); n = 10 (LysM‐Cre/Nrp1+/+ and LysM‐Cre/Nrp1fl/fl), Tnf (D); n = 5 (LysM‐Cre/Nrp1+/+), n = 10 (LysM‐Cre/Nrp1fl/fl).
- E–H
mRNA expression of inflammation markers relative to LysM‐Cre/Nrp1+/+ in mouse RPE‐choroid‐sclera complexes at D7 for Il1b (E); n = 6 (LysM‐Cre/Nrp1+/+), n = 10 (LysM‐Cre/Nrp1fl/fl), Il6 (F); n = 3 (LysM‐Cre/Nrp1+/+), n = 4 (LysM‐Cre/Nrp1fl/fl), Vegfa (G); n = 6 (LysM‐Cre/Nrp1+/+), n = 10 (LysM‐Cre/Nrp1fl/fl), Tnf (H); n = 8 (LysM‐Cre/Nrp1+/+), n = 12 (LysM‐Cre/Nrp1fl/fl).
- I
Representative Western blot showing pNF‐κB expression in LysM‐Cre/Nrp1+/+ (Ctrl) and LysM‐Cre/Nrp1fl/fl (Nrp1fl/fl).
- J
Quantification of pNF‐κB expression in LysM‐Cre/Nrp1+/+ and LysM‐Cre/Nrp1fl/fl BMDM; n = 6.
- K, L
mRNA expression relative to LysM‐Cre/Nrp1+/+ of inflammation markers in mouse BMDMs for Il1b (K); n = 4 (LysM‐Cre/Nrp1+/+), n = 5 (LysM‐Cre/Nrp1fl/fl) and Il6 (L); n = 3 (LysM‐Cre/Nrp1+/+), n = 2 (LysM‐Cre/Nrp1fl/fl).
- M
Representative FACS plots of M1 and M2‐Like macrophages in LysM‐Cre/Nrp1+/+ and LysM‐Cre/Nrp1fl/fl BMDMs.
- N, O
Quantification of M1‐Like macrophages (F4/80+, CD11b+, CD11c+, CD206−)(N), M2‐Like macrophages (F4/80+, CD11b+, CD11c−, CD206+) (O) in LysM‐Cre/Nrp1+/+ and LysM‐Cre/Nrp1fl/fl BMDMs relative to LysM‐Cre/Nrp1+/+; n = 5.
- P
Heatmap (left) and enrichment plot (right) of GO Angiogenesis gene set enrichment analysis (GSEA) of wild‐type and LysM‐Cre/Nrp1fl/fl peritoneal macrophages; n = 2. NES, normalized enrichment score; FDR, false discovery rate.
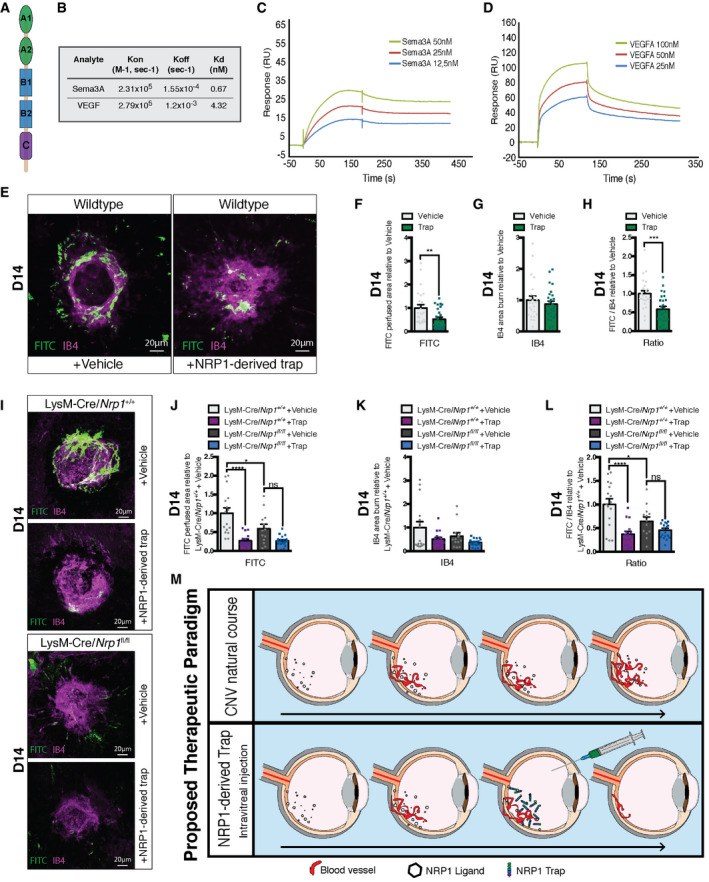
- A
Schematic representation of a soluble receptor Neuropilin‐1, consisting of five domains: two CUB motifs (A1, A2), two coagulation factor domains (B1, B2), and the MAM domain (C).
- B
Rate constant and binding affinities of Sema3A and VEGF to immobilized trap obtained using a one‐site Langmuir binding model.
- C, D
Representative SPR sensorgrams for various concentrations of Sema3A (C) and VEGF (D) binding to immobilized Trap.
- E
Compilation of representative compressed Z‐stack confocal images of FITC–dextran‐labeled CNV and isolectin B4 (IB4)‐stained laser impact area from vehicle and NRP1‐derived trap treated wild‐type mice. Scale bar: 20 μm.
- F–H
Quantification of area of FITC–dextran‐labeled CNV (F), IB4‐stained laser impact area (G) and the ratio of FITC/IB4 per laser burn (H) relative to vehicle at D14; n = 24 burns (vehicle), n = 26 burns (NRP1‐derived trap).
- I
Compilation of representative compressed Z‐stack confocal images of FITC–dextran‐labeled CNV and IB4‐stained laser impact area from vehicle and NRP1‐derived trap‐treated LysM‐Cre/Nrp1+/+ and LysM‐Cre/Nrp1fl/fl mice at D14. Scale bar: 20 μm.
- J–L
Quantification of area of FITC–dextran‐labeled CNV (J), isolectin B4 (IB4)‐stained laser impact area (K), and the ratio of FITC/IB4 per laser burn (L) relative to LysM‐Cre/Nrp1+/+ + vehicle in vehicle and NRP1‐derived trap‐treated LysM‐Cre/Nrp1+/+ and LysM‐Cre/Nrp1fl/fl mice at D14; n = 16 burns (LysM‐Cre/Nrp1+/+ + vehicle), n = 16 burns (LysM‐Cre/Nrp1+/+ + trap), n = 13 burns (LysM‐Cre/Nrp1fl/fl + vehicle), n = 19 burns (LysM‐Cre/Nrp1fl/fl + trap).
- M
Proposed therapeutic paradigm. From a therapeutic perspective, intravitreal injection of NRP1‐derived traps reduces pathological angiogenesis associated with CNV.
References
-
- Antipenko A, Himanen JP, van Leyen K, Nardi‐Dei V, Lesniak J, Barton WA, Rajashankar KR, Lu M, Hoemme C, Puschel AW et al (2003) Structure of the semaphorin‐3A receptor binding module. Neuron 39: 589–598 - PubMed
Publication types
MeSH terms
Substances
Grants and funding
LinkOut - more resources
Full Text Sources
Other Literature Sources
Molecular Biology Databases
Miscellaneous
