

Comparison of Predictive Models and Impact Assessment of Lockdown for COVID-19 over the United States
- PMID: 33876598
- PMCID: PMC8242119
- DOI: 10.2991/jegh.k.210215.001
Comparison of Predictive Models and Impact Assessment of Lockdown for COVID-19 over the United States
Abstract
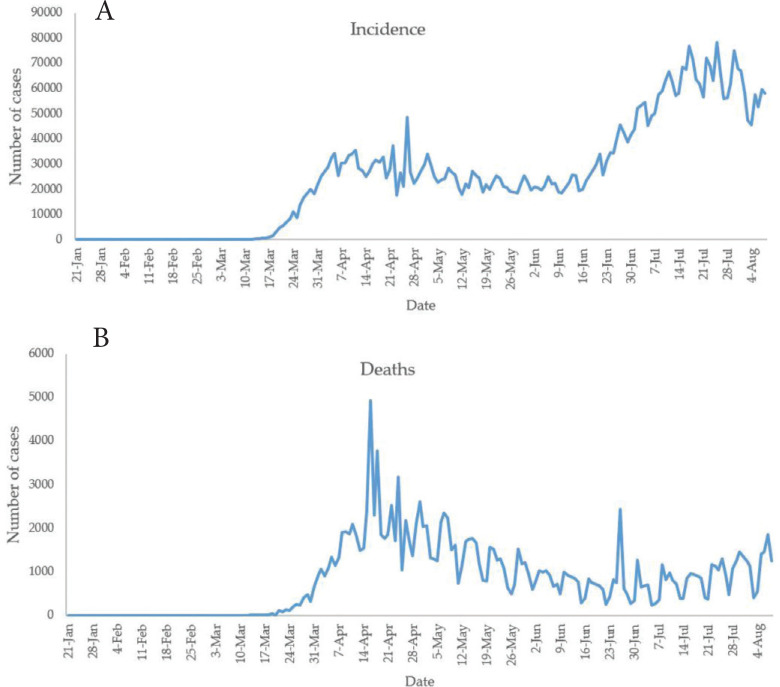
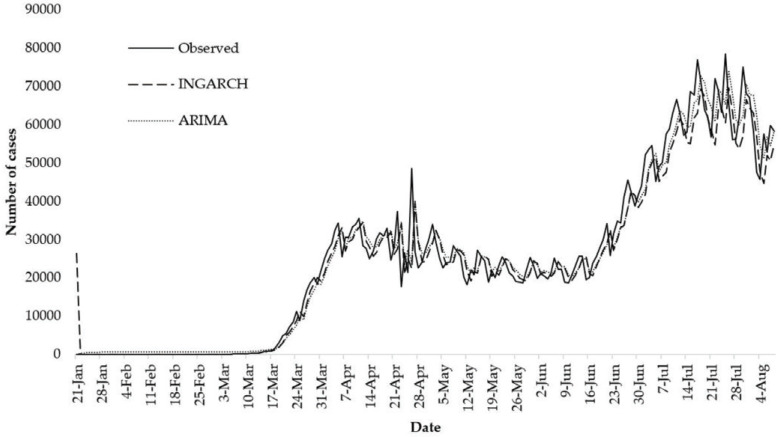
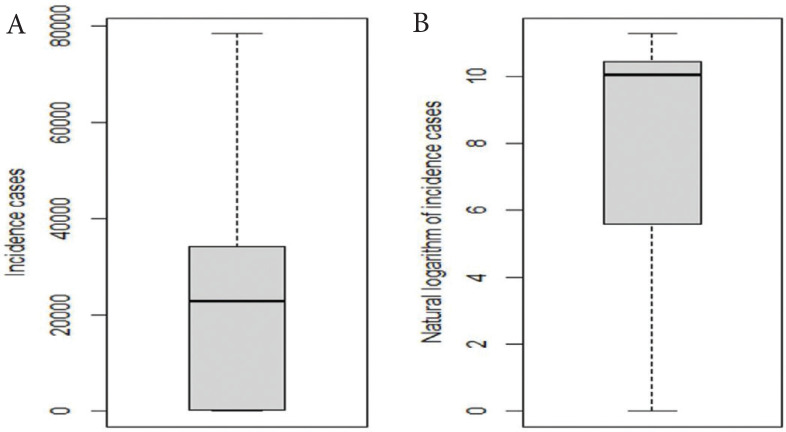
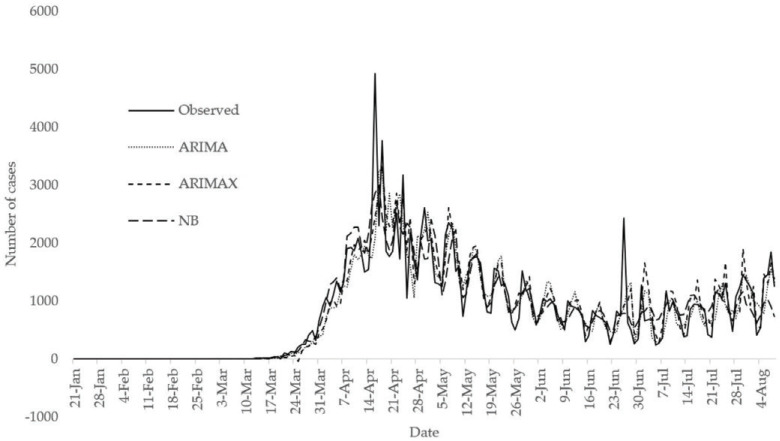
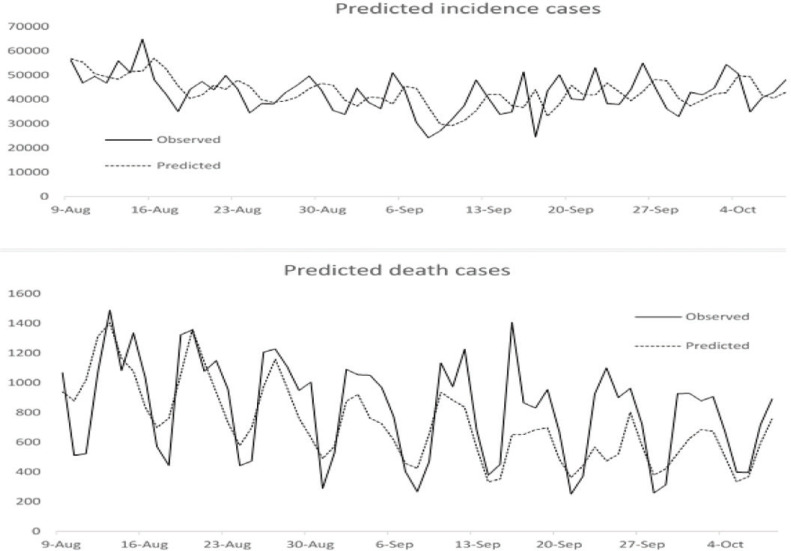
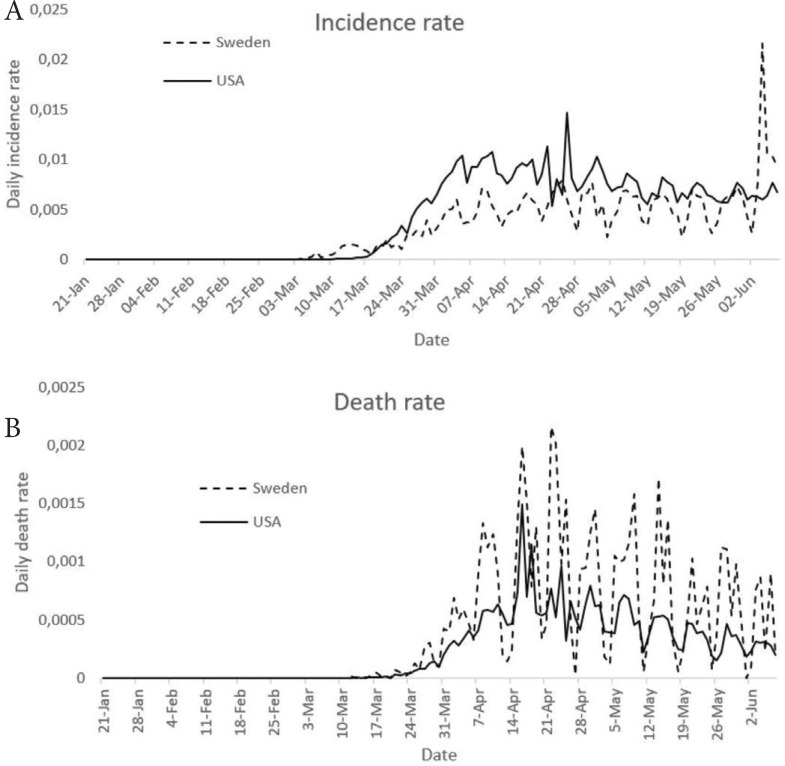
The novel Coronavirus Disease 2019 (COVID-19) remains a worldwide threat to community health, social stability, and economic development. Since the first case was recorded on December 29, 2019, in Wuhan of China, the disease has rapidly extended to other nations of the world to claim many lives, especially in the USA, the United Kingdom, and Western Europe. To stay ahead of the curve consequent of the continued increase in case and mortality, predictive tools are needed to guide adequate response. Therefore, this study aims to determine the best predictive models and investigate the impact of lockdown policy on the USA' COVID-19 incidence and mortality. This study focuses on the statistical modelling of the USA daily COVID-19 incidence and mortality cases based on some intuitive properties of the data such as overdispersion and autoregressive conditional heteroscedasticity. The impact of the lockdown policy on cases and mortality was assessed by comparing the USA incidence case with that of Sweden where there is no strict lockdown. Stochastic models based on negative binomial autoregressive conditional heteroscedasticity [NB INGARCH (p,q)], the negative binomial regression, the autoregressive integrated moving average model with exogenous variables (ARIMAX) and without exogenous variables (ARIMA) models of several orders are presented, to identify the best fitting model for the USA daily incidence cases. The performance of the optimal NB INGARCH model on daily incidence cases was compared with the optimal ARIMA model in terms of their Akaike Information Criteria (AIC). Also, the NB model, ARIMA model and without exogenous variables are formulated for USA daily COVID-19 death cases. It was observed that the incidence and mortality cases show statistically significant increasing trends over the study period. The USA daily COVID-19 incidence is autocorrelated, linear and contains a structural break but exhibits autoregressive conditional heteroscedasticity. Observed data are compared with the fitted data from the optimal models. The results further indicate that the NB INGARCH fits the observed incidence better than ARIMA while the NB models perform better than the optimal ARIMA and ARIMAX models for death counts in terms of AIC and root mean square error (RMSE). The results show a statistically significant relationship between the lockdown policy in the USA and incidence and death counts. This suggests the efficacy of the lockdown policy in the USA.
Keywords: ARIMA; COVID-19; INGARCH; USA; lockdown policy; negative binomial.
© 2021 The Authors. Published by Atlantis Press International B.V.
Conflict of interest statement
The authors declare they have no conflicts of interest.
Figures
Similar articles
-
Prediction of the COVID-19 Pandemic for the Top 15 Affected Countries: Advanced Autoregressive Integrated Moving Average (ARIMA) Model.JMIR Public Health Surveill. 2020 May 13;6(2):e19115. doi: 10.2196/19115. JMIR Public Health Surveill. 2020. PMID: 32391801 Free PMC article.
-
Prognosticating the Spread of Covid-19 Pandemic Based on Optimal Arima Estimators.Endocr Metab Immune Disord Drug Targets. 2021;21(4):586-591. doi: 10.2174/1871530320666201029143122. Endocr Metab Immune Disord Drug Targets. 2021. PMID: 33121426
-
Comparison of ARIMA and LSTM in Forecasting the Incidence of HFMD Combined and Uncombined with Exogenous Meteorological Variables in Ningbo, China.Int J Environ Res Public Health. 2021 Jun 7;18(11):6174. doi: 10.3390/ijerph18116174. Int J Environ Res Public Health. 2021. PMID: 34200378 Free PMC article.
-
Predictive Models for Forecasting Public Health Scenarios: Practical Experiences Applied during the First Wave of the COVID-19 Pandemic.Int J Environ Res Public Health. 2022 May 3;19(9):5546. doi: 10.3390/ijerph19095546. Int J Environ Res Public Health. 2022. PMID: 35564940 Free PMC article.
-
Autoregressive models in environmental forecasting time series: a theoretical and application review.Environ Sci Pollut Res Int. 2023 Feb;30(8):19617-19641. doi: 10.1007/s11356-023-25148-9. Epub 2023 Jan 17. Environ Sci Pollut Res Int. 2023. PMID: 36648728 Free PMC article. Review.
Cited by
-
A weapon to fight against pervasive Omicron: systematic actions transiting to pre-COVID normal.Front Public Health. 2023 Sep 5;11:1204275. doi: 10.3389/fpubh.2023.1204275. eCollection 2023. Front Public Health. 2023. PMID: 37744521 Free PMC article.
References
-
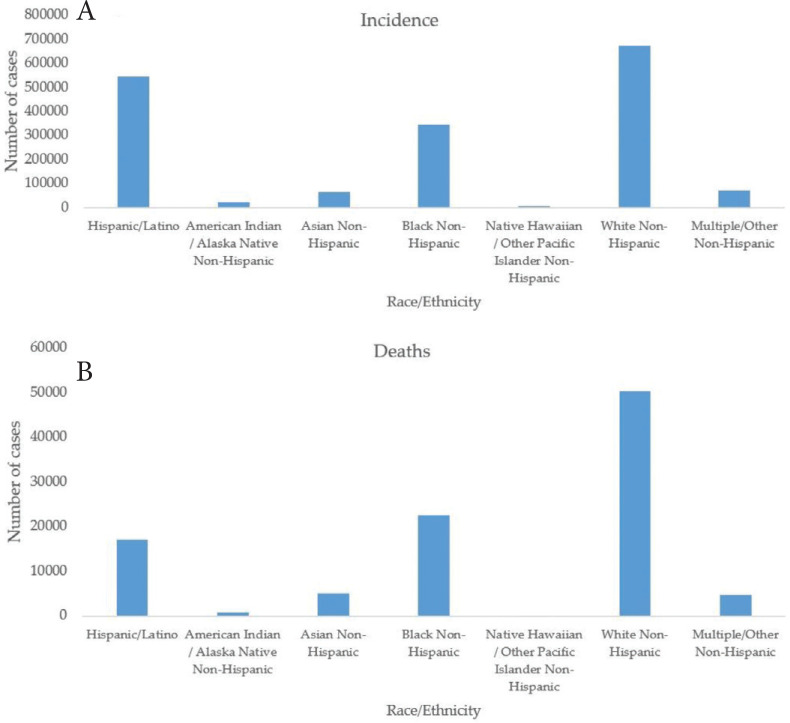
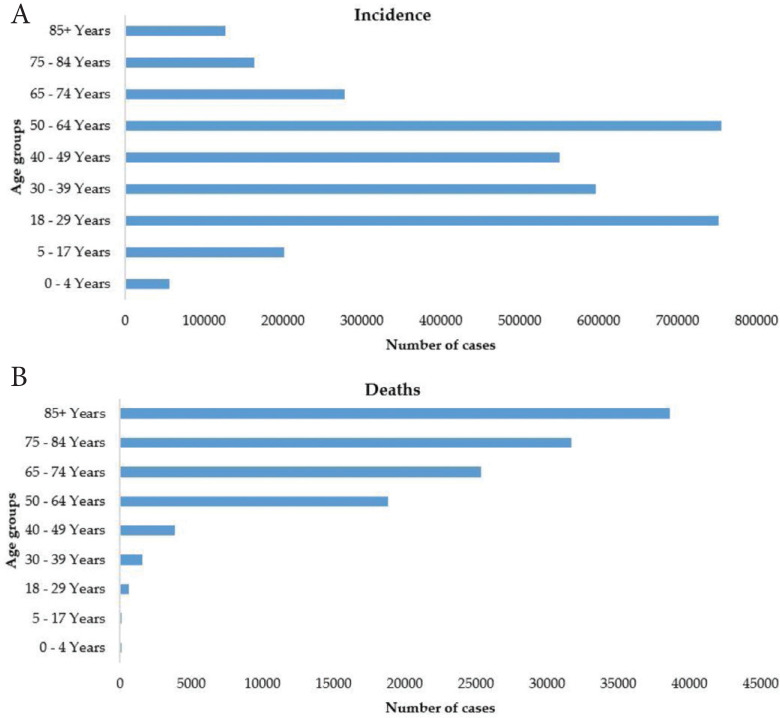
- CDC Report Centers for Disease Control and Prevention: Risk for COVID-19 Infection, Hospitalization, and Death By Race/Ethnicity. https://www.cdc.gov/coronavirus/2019-ncov/covid-data/investigations-disc... (retrieved on August 8, 2020).
-
- World Health Organization Statement on the Second Meeting of the International Health Regulations (2005) Emergency Committee regarding the outbreak of novel coronavirus (2019-nCoV) 2020 Available from: https://www.who.int/news-room/detail/30-01-2020-statement-on-the-second-... (retrieved on August 23, 2020).
Publication types
MeSH terms
LinkOut - more resources
Full Text Sources
Other Literature Sources
Medical