Comparative Study
. 2021 Apr 20:10:e61138.
doi: 10.7554/eLife.61138.

The biphasic and age-dependent impact of klotho on hallmarks of aging and skeletal muscle function

Affiliations
Comparative Study

The biphasic and age-dependent impact of klotho on hallmarks of aging and skeletal muscle function

Zachary Clemens et al. Elife. .

Abstract

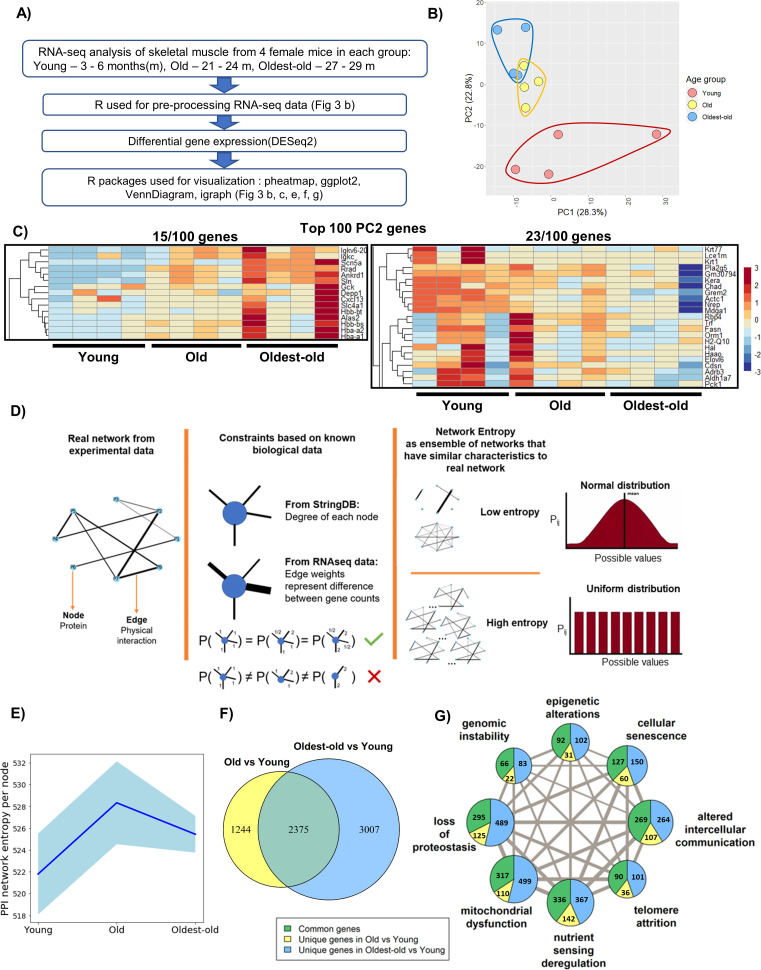
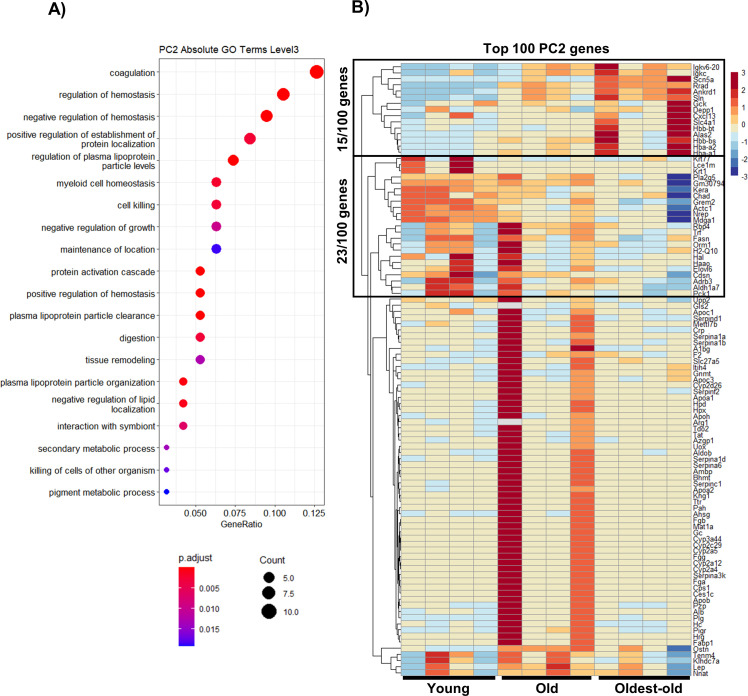
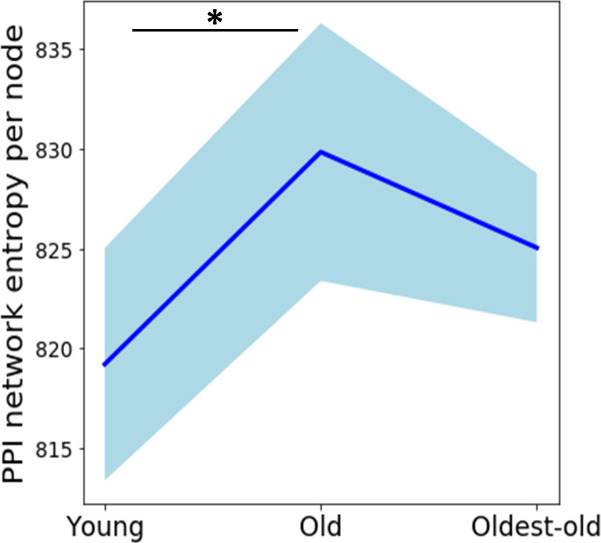
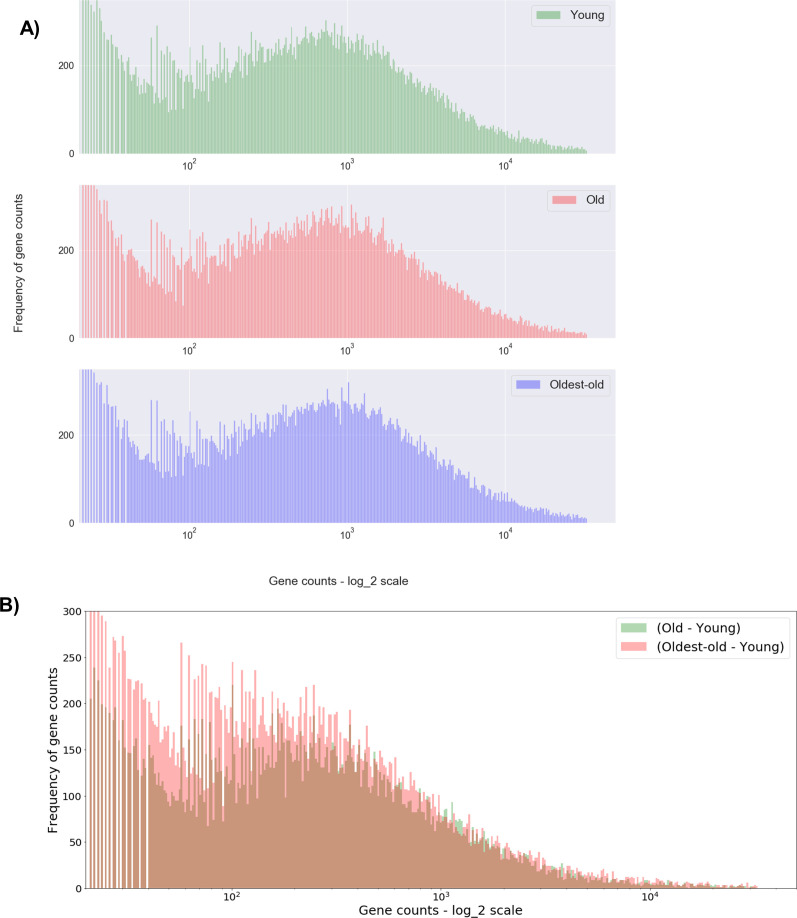
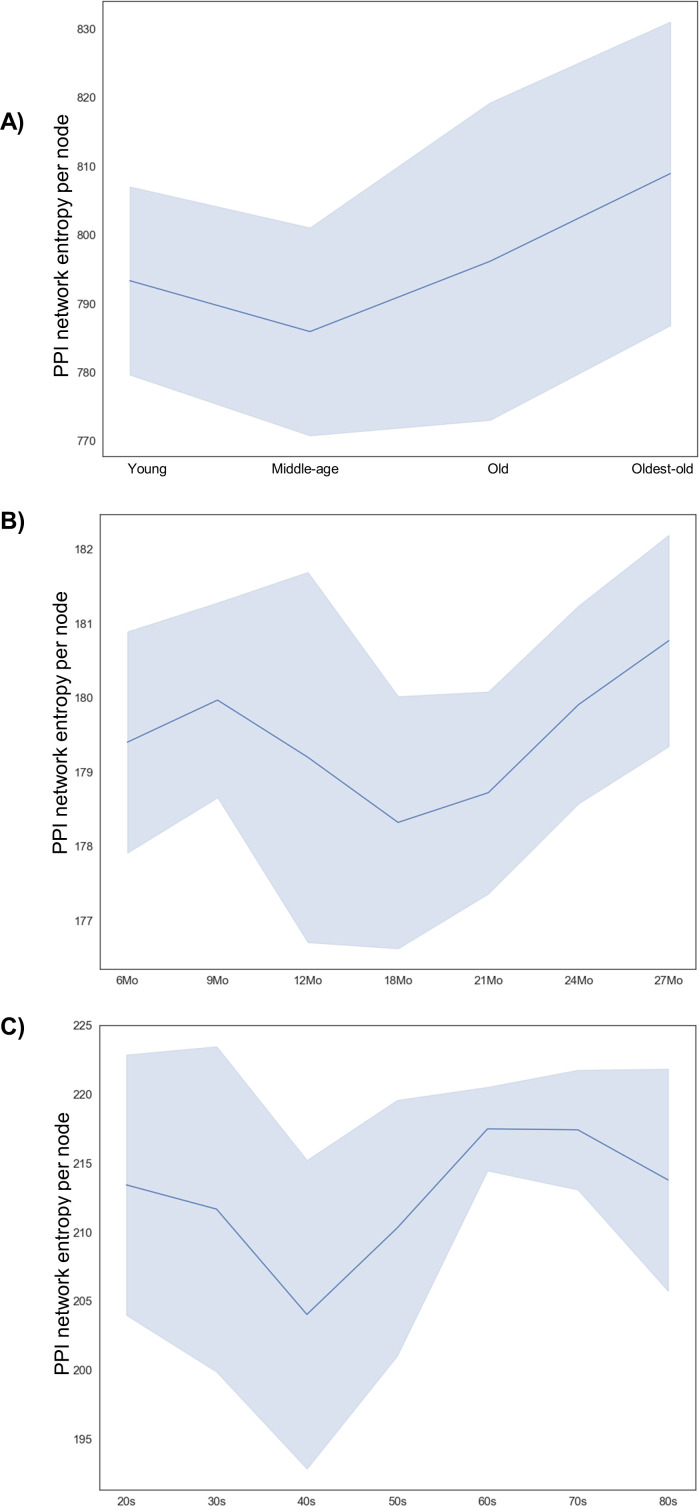
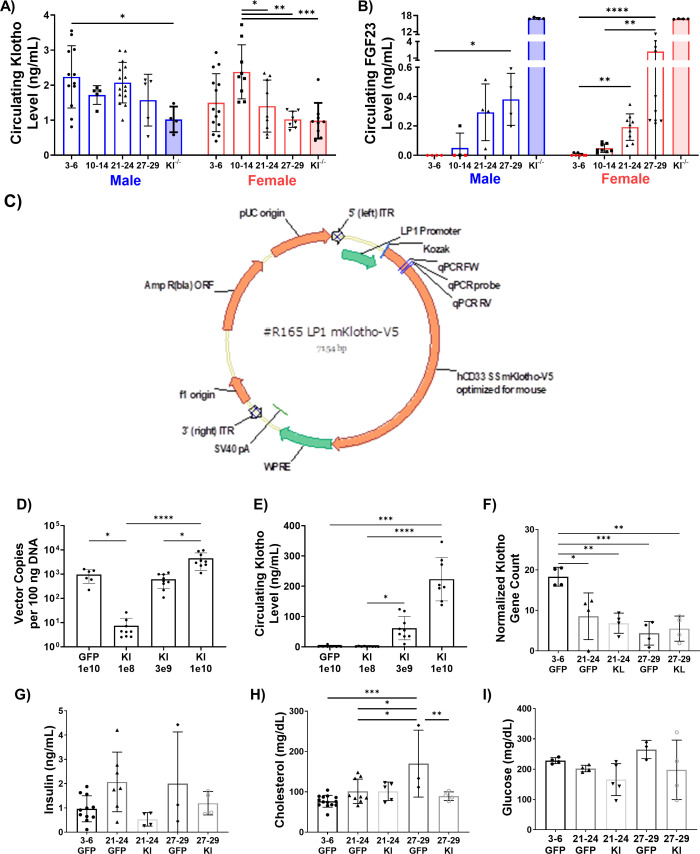
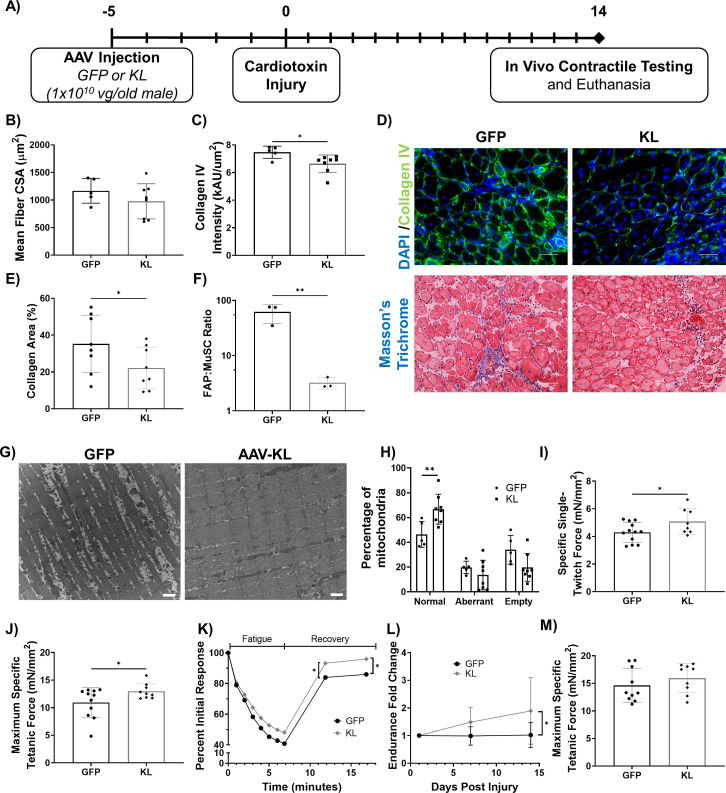
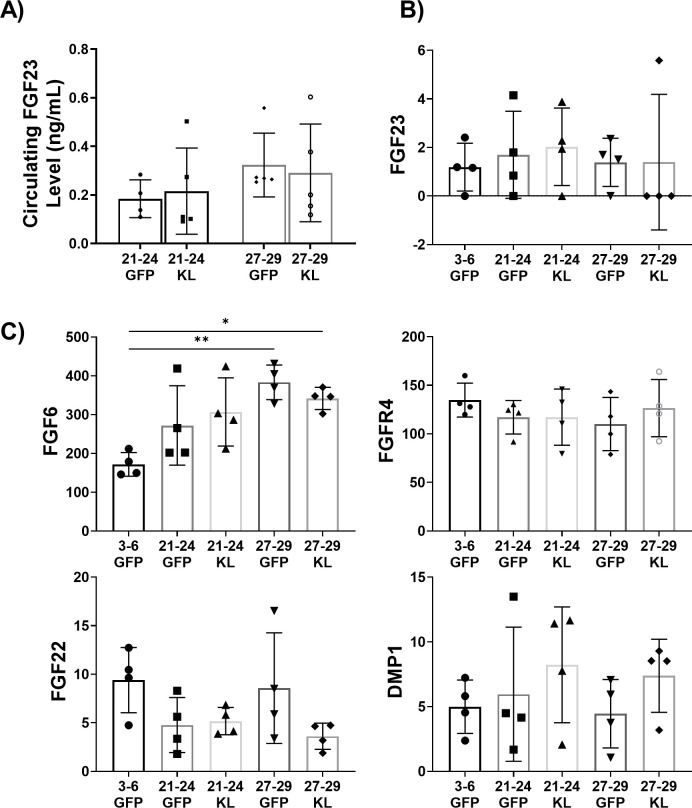
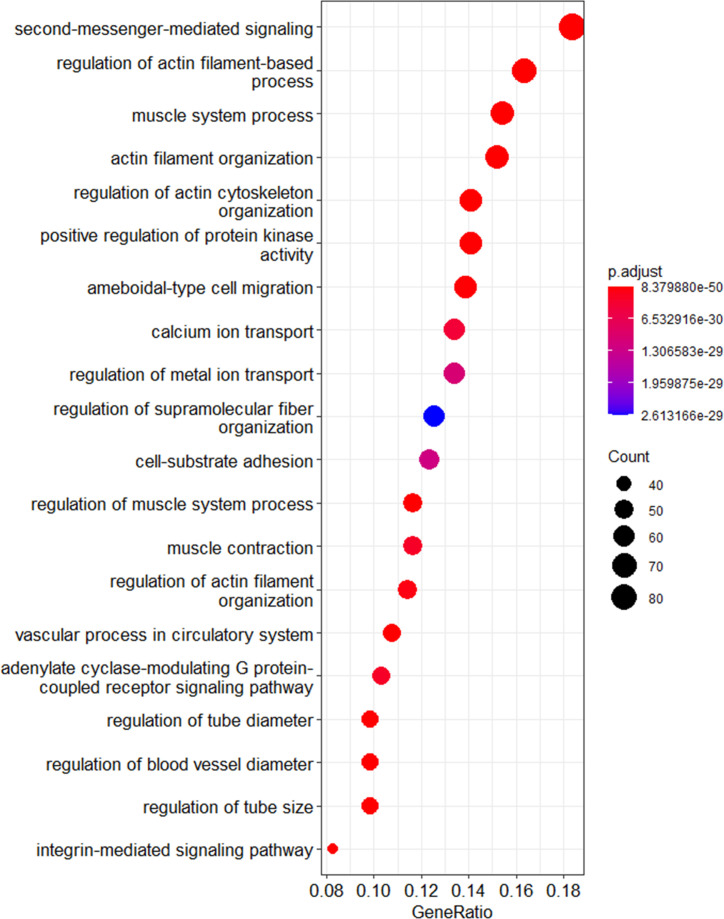
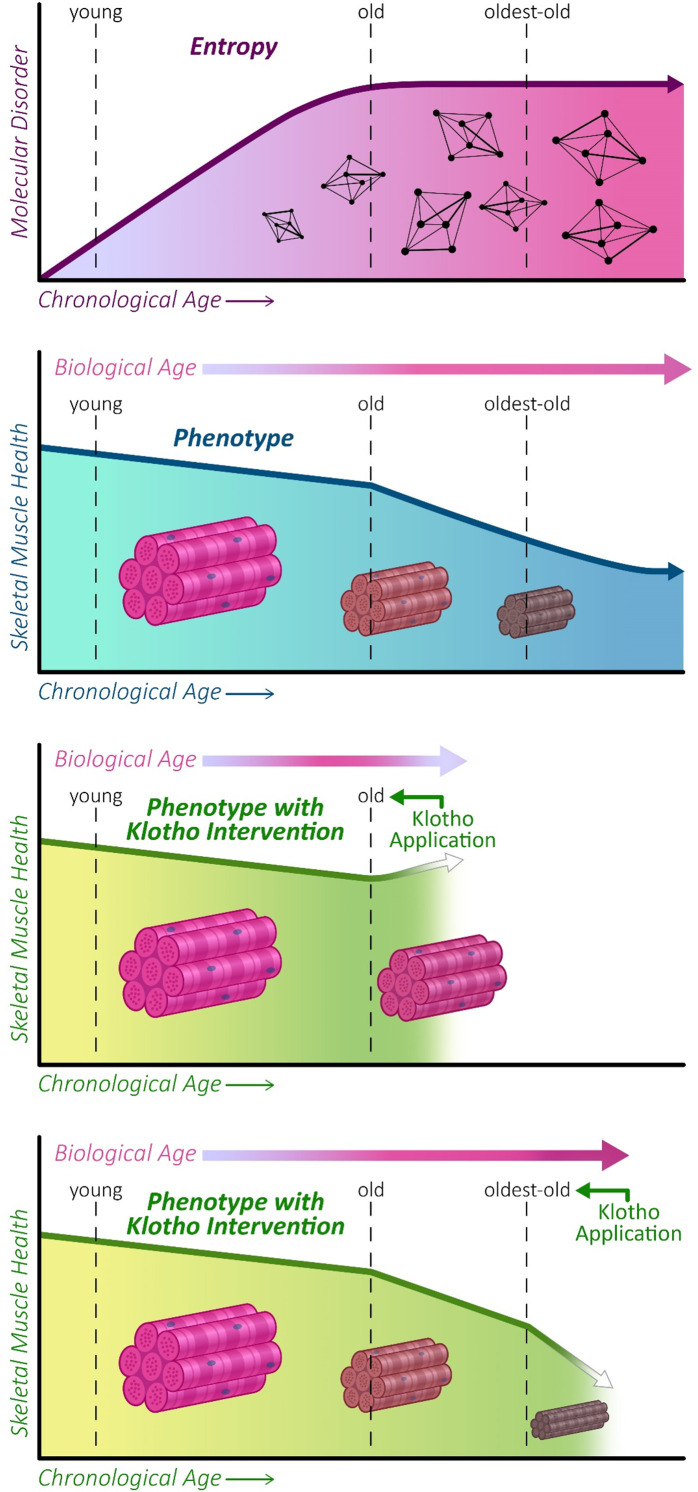
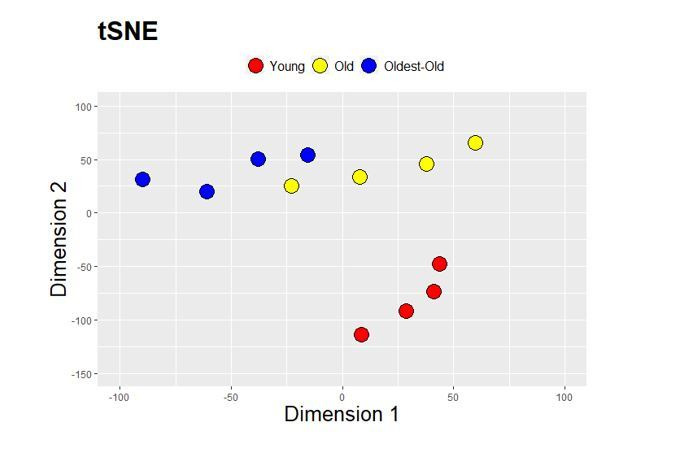
Aging is accompanied by disrupted information flow, resulting from accumulation of molecular mistakes. These mistakes ultimately give rise to debilitating disorders including skeletal muscle wasting, or sarcopenia. To derive a global metric of growing 'disorderliness' of aging muscle, we employed a statistical physics approach to estimate the state parameter, entropy, as a function of genes associated with hallmarks of aging. Escalating network entropy reached an inflection point at old age, while structural and functional alterations progressed into oldest-old age. To probe the potential for restoration of molecular 'order' and reversal of the sarcopenic phenotype, we systemically overexpressed the longevity protein, Klotho, via AAV. Klotho overexpression modulated genes representing all hallmarks of aging in old and oldest-old mice, but pathway enrichment revealed directions of changes were, for many genes, age-dependent. Functional improvements were also age-dependent. Klotho improved strength in old mice, but failed to induce benefits beyond the entropic tipping point.

Keywords: adeno-associated virus; computational biology; hallmarks of aging; klotho; mouse; muscle stem cells; regenerative medicine; sarcopenia; skeletal muscle; stem cells; systems biology.


Conflict of interest statement

ZC, SS, AP, AS, SS, HM, NL, JC, PD, AB, FA No competing interests declared, JH, SK is an employee of Boehringer INgelheim Pharmaceutical Company, MF is an employee of Boehringer Ingelheim Pharmaceutical Company

Figures

Figure 1.
Figure 1.. Declines in muscle structure are subtle until advanced age.
(A) Tibialis anterior (TA) muscle weight as a percentage of whole-body weight in young (3–6 months), middle-aged (10-14 months), old (21-24 months), and oldest-old (27-29 months) male (N = 57) and female mice (N = 78, one-way ANOVAs). (B) Average fiber cross-sectional area of uninjured male (N = 27) and female (N = 24) mouse TAs across age groups (one-way ANOVAs). (C) Representative images of TA sections stained for laminin (gray), type IIA (purple), type IIX (black/unstained), and type IIB (red) fibers (top, main scale bars = 500 μm, inset scale bars = 250 μm ); Masson’s trichrome staining (middle, 50 µm); and lipidtox staining (bottom, lipidtox = red, laminin = green, scale bars = 50 µm). (D) Percentage of IIA and IIX fibers in the whole TA cross-section of male (N = 27) and female (N = 24) mice (one-way ANOVAs). (E) Collagen area of TA sections across ages and sexes (male N = 17, female N = 19) quantified by Masson’s Trichrome staining (one-way ANOVAs). (F) Intermuscular lipid accumulation in the TA across ages and sexes (male N = 16, female N = 15) quantified by lipidtox staining (one-way ANOVA). (G) Intramuscular lipid accumulation in the TA across ages and sexes (male N = 16, female N = 15) quantified by lipidtox staining (one-way ANOVA). All data presented as mean ± SD (*p<0.05, **p<0.01, ***p<0.001, ****p<0.0001).
Figure 1—figure supplement 1.
Figure 1—figure supplement 1.. Characterization of sarcopenic changes in male mice.
(A) Physiological TA cross-sectional area (CSA) estimated from length and mass measurements in young (3–6 months), middle-aged (10-14 months), old (21-24 months), and oldest-old (27-29 months) male (N = 26) and female (N = 26) C57BL/6J mice across ages and sexes (one-way ANOVAs). (B) Total number of TA muscle fibers in whole TA sections across ages and sexes (male N = 27, female N = 24). (C) Representative images of male uninjured TA muscles showing fiber type staining for type IIA (purple), type IIX (black/unstained), type IIB (red), and laminin (gray, main scale bars = 500 μm, inset scale bars = 250 μm), and Masson’s trichrome staining. (D) Percentage of type IIB muscle fibers in whole TA muscle sections (male N = 27, female N = 24, one-way ANOVA). (E) Type IIB fiber CSA (male N = 27, female N = 24, one-way ANOVA). (F) Type IIA fiber CSA (male N = 27, female N = 24, one-way ANOVA). (G) Type IIX fiber CSA (male N = 27, female N = 24, one-way ANOVA). All data presented as mean ± SD (*p<0.05, **p<0.01, ***p<0.001, ****p<0.0001).
Figure 1—figure supplement 2.
Figure 1—figure supplement 2.. Denervation gene expression in mice across age groups for Musk (N = 28), Ncam1 (N = 27), and Runx1 (N = 29).
Data collected from the Tabula Muris Senis database. Blue dots represent male data. Red dots represent female data (one-way ANOVAs). All data presented as mean ± SD (*p<0.05, **p<0.01).
Figure 2.
Figure 2.. Male and female mice display a progressive loss of muscle function over time.
(A) Whole-body endurance of young (3–6 months), middle-aged (10-14 months), old (21-24 months), and oldest-old (27-29 months) male (N = 67) and female (N = 77) mice measured by the four-limb hang test (one-way ANOVA). 'g'= gravity and 's'=seconds. (B) Peak specific tetanic force production in male (N = 25) and female (N = 24) TA muscles (one-way ANOVAs). (C) Force frequency curves for TA stimulation in male mice (N = 25). (D) Force frequency curves for TA stimulation for female (N = 24) mice. (E) Half relaxation time of the TA muscle following single twitch stimulation across ages and sexes (male N = 25, female N = 24, Kruskal-Wallis tests). (F) Time to maximum force following single twitch stimulation of the TA muscle (male N = 25, female N = 24, Kruskal-Wallis tests). All data presented as mean ± SD (*p<0.05, **p<0.01, ****p<0.0001).
Figure 3.
Figure 3.. Network entropy increases from young to old mice, after which time it plateaus.
(A) RNA-seq analysis workflow. (B) Principle component analysis (PCA) showing overall gene expression patterns in young (3–6 months), old (21-24 months), and oldest-old (27-29 months) mice (N = 12). (C) Heatmap showing genes associated with aging progression derived from the 100 genes with the highest PC2 loadings. The two highlighted sections show 15/100 genes that have an increasing trend and 23/100 genes that have a decreasing trend. (D) Schematic description of network entropy computation and interpretation. PPI networks were generated based on RNA-seq data. We capture the degree sequence and the edge weights from the network obtained from experimental data in the form of constraints. The ensemble of networks that follow these constraints have similar network features. If the probability distribution is skewed, then it has a low network entropy and, if not, then it is has a high network entropy. (E) Protein-protein interaction (PPI) network entropy computed from transcriptomic data indicates an increase in molecular disorder of hallmarks of aging genes. A non-parametric Kruskal Wallis test (p=0.0741) and Dunn’s post-hoc test were performed. Entropy of young to old changed with p=0.07. Blue shaded portion indicates standard deviation (n = 4). (F) Venn Diagram showing the number of differentially expressed (DE) genes between groups old vs. young, and oldest-old vs. young mice. (G) Network plot denotes the total number of DE genes per hallmark and the corresponding proportion of DE genes that are unique to old and oldest-old, when compared to young counterparts for each hallmark of aging. Edge weights denote the number of genes that are common between the two hallmarks the edge connects. The node sizes are proportional to the number of genes that fall into each hallmark.
Figure 3—figure supplement 1.
Figure 3—figure supplement 1.. Transcriptomic changes in the context of hallmarks of aging genes.
(A) Gene Ontology enrichment of top 100 genes PC2 loadings that characterize aging progression. The majority of these level 3 GO terms fall under altered intercellular communication and nutrient-sensing deregulation. (B) Full heatmap showing genes associated with aging progression derived from the top 100 genes with the highest PC2 loadings.
Figure 3—figure supplement 2.
Figure 3—figure supplement 2.. Network entropy with all genes.
Network entropy trend with all genes considered in the PPI network. A non-parametric Kruskal Wallis test (p=0.056) with Dunn’s post-hoc test was performed. Blue shaded portion indicates standard deviation (n = 4).
Figure 3—figure supplement 3.
Figure 3—figure supplement 3.. Histogram of all gene counts across young, old, and oldest-old age groups.
(A) Histogram of all gene counts (concatenated values from four animals from each age group). ​(B) Histogram that shows the difference between age groups, with the green (Old - Young) histogram right-shifted compared to red (Oldest-old – Young).
Figure 3—figure supplement 4.
Figure 3—figure supplement 4.. Validation of network entropy trends in other samples and species.
(A) ​PPI network entropy obtained from all genes in male mice with ages ranging from young (3–6 months), middle-age (12–15 months), old (21–24 months), and oldest-old (27 months). The blue shaded region denotes standard deviation (n = 6, 7, 6, and 4, respectively). One 21-month-old male sample was excluded since the number of nodes was 33% lower than the mean of rest of the samples. (B) ​PPI network entropy obtained from all genes in male rats with ages ranging from young to old (6, 9, 12, 18, 21, 24, and 27 months). The blue shaded region denotes standard deviation (n = 7, 7, 8, 7, 7, 8, and 8, respectively ). (C) PPI network entropy obtained from all genes in human males with ages ranging from young to middle-aged to old to oldest-old, grouped as decades, namely, 20–29 years, 30–39 years, and so on to >80 years old. The blue shaded region denotes standard deviation (n = 4, 7, 4, 5, 4, 7, and 4, respectively).
Figure 4.
Figure 4.. Development and validation of an AAV approach for systemic delivery of Klotho.
(A) Changes in circulating Klotho levels measured via ELISA in young (3–6 months), middle-aged (10-14 months), old (21-24 months), and oldest-old (27-29 months) male (N = 41), and female (N = 47) mice (one-way ANOVAs). (B) Changes in circulating FGF23 levels in male (N = 20) and female (N = 39) mice. Red symbols represent undetectable levels and were set to zero (Kruskal-Wallis tests, KO values were excluded from statistical analysis). (C) Schematic of the AAV-Klotho plasmid design. (D) Liver expression of AAV vector genomes quantified via qPCR (N = 33, Kruskal-Wallis test). (E) Circulating Klotho levels measured via MSD-ELISA in young female (N = 33) mice injected with AAV-Klotho at varying doses (Kruskal-Wallis test). (F) Gene count normalized to library size for Klotho in the gastrocnemius muscle of female mice treated with GFP and AAV-Kl (N = 20, one-way ANOVA). (G,H,I) Serum concentration levels for insulin (N = 29), cholesterol (N = 35), and glucose (N = 20) in GFP- and Kl-treated female mice (one-way ANOVA). All data presented as mean ± SD (*p<0.05, **p<0.01, ***p<0.001, ****p<0.0001).
Figure 4—figure supplement 1.
Figure 4—figure supplement 1.. Quantification of circulating lipid metabolites in mice receiving AAV-Kl treatment versus controls.
Circulating phospholipids (N = 20), NEFA (N = 20), and triglycerides (N = 20) in young (3–6 months), old (21-24 months), and oldest-old (27-29 months) female mice receiving AAV-GFP or AAV-Kl​.
Figure 5.
Figure 5.. Gene delivery of Klotho enhances functional muscle regeneration following an acute injury.
(A) Experimental design using old (21–24 months) male mice. (B) Quantification of TA average myofiber cross-sectional area (N = 13). (C) Collagen IV expression in the TA muscle of GFP- versus KL-treated mice (one-tailed Mann-Whitney test, N = 13). (D) Top: Representative images of injured TA muscles stained for collagen IV (green) and DAPI (blue, scale bars = 50 µm). Bottom: Masson’s Trichrome staining of the TA (scale bars = 50 µm). (E) Collagen area percentage in the TA quantified from Masson’s Trichrome staining (one-tailed student’s t-test, N = 16). (F) FAPs to MuSCs ratio in injured TA muscles, as determined by flow cytometry (N = 6, one-tailed student’s t-test). (G) Representative TEM images showing mitochondria in the TA muscle fibers of AAV-GFP vs. KL-treated mice. Aberrant and empty mitochondria show abnormal shape and high proportion of white space respectively (scale bars = 1μm). (H) Quantification of the quality of mitochondria (two-way ANOVA, N = 13). (I) TA specific twitch force produced 14 days post-injury (dpi) (one-tailed Student’s t-test, N = 20). (J) TA maximum specific tetanic force 14 dpi (one-tailed Student’s t-test, N = 20). (K) Change in force production of the TA over time as mice underwent a fatigue protocol consisting of repeated TA stimulation for a total of 7 min, followed by recovery over two 5-min intervals (two-way ANOVA, N = 19). (L) Fold change in whole body endurance compared to one day post injury hang impulse score (Mixed-effects analysis, N = 16). (M) TA peak tetanic specific force for mice 7 days after an eccentric injury treadmill protocol (N = 19). All data presented as mean ± SD (*p<0.05, **p<0.01).
Figure 5—figure supplement 1.
Figure 5—figure supplement 1.. Validation of the eccentric exercise injury model.
(A) Experimental design for the eccentric exercise injury model using old (21–24 months) male mice. (B) Summary of parameters for the acclimation period and injury protocol. (C) Assessment of adherence to the exercise protocol showing similar performance between mice receiving AAV-GFP and AAV-Kl (N = 24). Red symbols represent underperforming animals that were removed from further analysis (N = 2 per group). (D) Representative images in the TA showing the extent of injury induced by the exercise protocol, scale bars = 100 microns. (E) Percent of fibers with central nuclei in control vs. mice completing the treadmill protocol (N = 19, green = GFP group, blue = KL group, student’s one-tailed t-test). All data presented as mean ± SD (*p<0.05).
Figure 6.
Figure 6.. AAV-Klotho enhances muscle function in old, but not oldest-old, mice.
(A) Experimental design and timeline using old (21–24 months) and oldest-old (27-29 months) female mice. (B) Animal inclusion flow chart. Mortality describes mice that died over the course of the experiment. Morbidity describes mice in whom pathology was found at the time of euthanasia . These mice were subsequently excluded from analyses. (C) Representative images showing TA myofiber area (Laminin; green), lipid (red), and DAPI (blue) of the TA 14 dpi in old and oldest-old female mice treated with GFP or Kl. Scale bars = 50 µm. (D) TA wet weight (as a percent of total body weight) of old female mice treated with AAV-GFP or AAV-Kl (N = 10). (E) Quantification of TA muscle-fiber cross-sectional area (CSA) for old female mice (N = 10). (F) Percentage of type IIA and IIX muscle fibers in whole TA cross-sections of old female mice (N = 10). (G) Inter- and intramuscular lipid intensity in TA cross-sections of old female TAs (two-way ANOVA, N = 10). (H) Old female TA maximum specific tetanic force production (one-tailed Student’s t-test, N = 12). (I) Hang-test performance 14 days after injection of AAV-Kl or AAV-GFP, calculated relative to baseline performance (one-tailed Student’s t-test, N = 15). (J) TA wet weight (as a percent of total body weight) of oldest-old female mice treated with AAV-GFP or AAV-Kl (N = 16). (K) Quantification of TA muscle-fiber CSA for oldest-old female mice (N = 12). (L) Percentage of type IIA and IIX muscle fibers in whole TA cross-sections of oldest-old female mice (N = 12). (M) Inter- and intramuscular lipid intensity in TA cross-sections of oldest-old female TAs (two-way ANOVA, N = 8). (N) Oldest-old female TA maximum specific tetanic force production (N = 15). (I) Hang-test performance 14 days after injection, calculated relative to baseline performance (N = 14). All data presented as mean ± SD (*p<0.05, **p<0.01).
Figure 6—figure supplement 1.
Figure 6—figure supplement 1.. AAV-Administration in uninjured female Mice.
(A) The ratio of whole-body endurance of old (21–24 months) female mice 14 days after receiving GFP or AAV-Kl at three different doses (3 × 10⁸ vg/mouse (low dose), 1 × 10⁹ vg/mouse (mid dose), and 3 × 10⁹ vg/mouse (high dose), N = 17, one-way ANOVA). (B) Total number of muscle fibers in the TA cross-sections of old and oldest-oldest (27–29 months) female mice treated with GFP or AAV-Kl (old N = 10, oldest-old N = 12). (C) Transcript reads of denervation-related genes in old mice (N = 8). (D) Transcript reads of denervation-related genes in oldest-old mice (N = 8). Data presented as mean ± SD error bars (**p<0.01).
Figure 7.
Figure 7.. The effect of AAV-Kl administration on genes associated with hallmarks of aging is age-dependent.
(A) Venn Diagram showing the number of differentially expressed (DE) genes between groups treated with AAV-Kl (n = 4) vs AAV-GFP (n = 4) mice. (B) Network plot with each node as a pie chart that denotes the total number of DE genes in that hallmark, and the wedges denote the proportion of DE genes between groups treated with AAV-Kl vs AAV-GFP for each hallmark of aging. The edge weights denote the number of genes that are common between the two connected hallmarks. The node sizes are proportional to the number of genes that fall into each hallmark. (C) Barplots showing GO terms associated with old vs old klotho (green), and oldest-old vs oldest-old klotho (yellow) DE genes. (D) Bar plot showing the top 20 KEGG pathways that change oppositely between old and oldest-old groups after AAV-Kl treatment ranked by largest absolute difference in total accumulation. Total accumulation is a measure of gene perturbation.
Figure 7—figure supplement 1.
Figure 7—figure supplement 1.. Investigation of the Klotho-FGF23 interaction in uninjured female mice with AAV-Kl treatment.
(A) Circulating FGF23 in the serum of old (21–24 months, N = 9) and oldest-old (27-29 months N = 10) female mice treated with GFP or AAV-Kl. (B) Gene count normalized to library size for FGF23 in the gastroc of old and oldest-old female mice treated with GFP or AAV-Kl compared to young (3–6 months) female mice treated with GFP (N = 20). (C) Gene count normalized to library size for primary interactors of FGF23 (N = 20, one-way ANOVA). All data presented as mean ± SD (*p<0.05, **p<0.01).
Figure 7—figure supplement 2.
Figure 7—figure supplement 2.. Dot plot of GO terms showing age-dependency of calcium ion transport and signaling with Klotho intervention.
These are GO terms associated with top three pathways differently perturbed between old and oldest-old mice with AAV-Kl intervention. The size of the circle represents the number of genes that are associated with each of the GO term.
Figure 8.
Figure 8.. Graphical abstract.
Entropy increases with increasing age before plateauing at old age (21–24 months) in mice (top panel). This is concomitant with a decline in skeletal muscle function, which continues to progress into oldest-old age (second panel). We show that AAV-Kl administration can rescue muscle functional declines when administered to old mice (third panel), but this effect is lost when AAV-Klotho is delivered to oldest-old (27–29 months) mice (bottom panel).
Author response image 1.

Similar articles

Cited by

References

    1. Aare S, Spendiff S, Vuda M, Elkrief D, Perez A, Wu Q, Mayaki D, Hussain SN, Hettwer S, Hepple RT. Failed reinnervation in aging skeletal muscle. Skeletal Muscle. 2016;6:1–13. doi: 10.1186/s13395-016-0101-y. - DOI - PMC - PubMed
    1. Argilés JM, Busquets S, Stemmler B, López-Soriano FJ. Cachexia and Sarcopenia: mechanisms and potential targets for intervention. Current Opinion in Pharmacology. 2015;22:100–106. doi: 10.1016/j.coph.2015.04.003. - DOI - PubMed
    1. Armand AS, Launay T, Gaspera BD, Charbonnier F, Gallien CL, Chanoine C. Effects of eccentric treadmill running on mouse soleus: degeneration/regeneration studied with Myf-5 and MyoD probes. Acta Physiologica Scandinavica. 2003;179:75–84. doi: 10.1046/j.1365-201X.2003.01187.x. - DOI - PubMed
    1. Augusto V, Padovani CR, Campos GER. Skeletal muscle fiber types in C57BL6J mice. Journal of Morphological Sciences. 2017;21:01
    1. Barns M, Gondro C, Tellam RL, Radley-Crabb HG, Grounds MD, Shavlakadze T. Molecular analyses provide insight into mechanisms underlying Sarcopenia and myofibre denervation in old skeletal muscles of mice. The International Journal of Biochemistry & Cell Biology. 2014;53:174–185. doi: 10.1016/j.biocel.2014.04.025. - DOI - PubMed

Publication types

MeSH terms

Associated data