

Role of ERβ in adipocyte metabolic response to wheel running following ovariectomy
- PMID: 33877054
- PMCID: PMC8713017
- DOI: 10.1530/JOE-21-0009
Role of ERβ in adipocyte metabolic response to wheel running following ovariectomy
Abstract
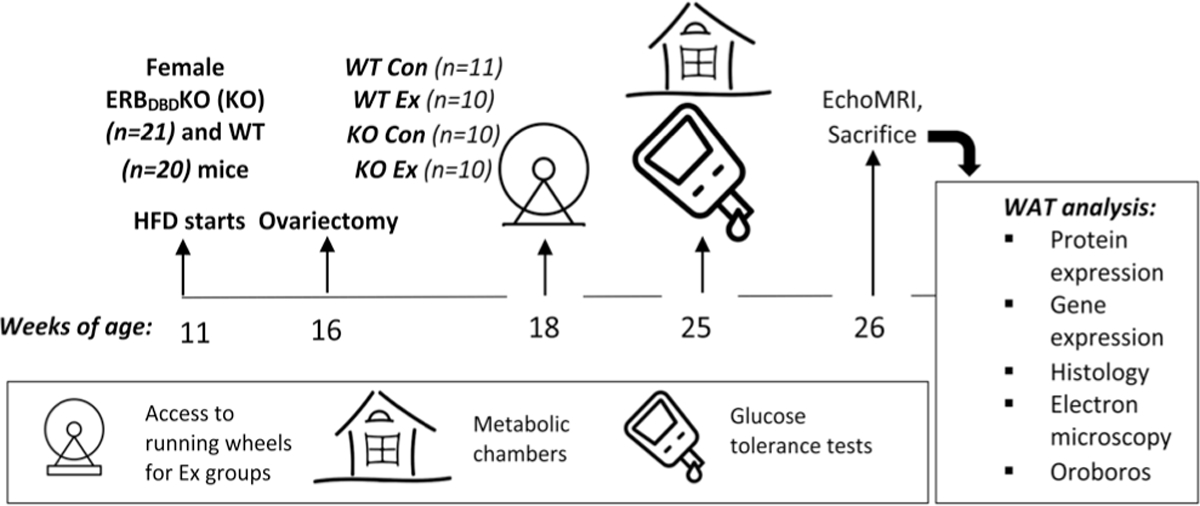
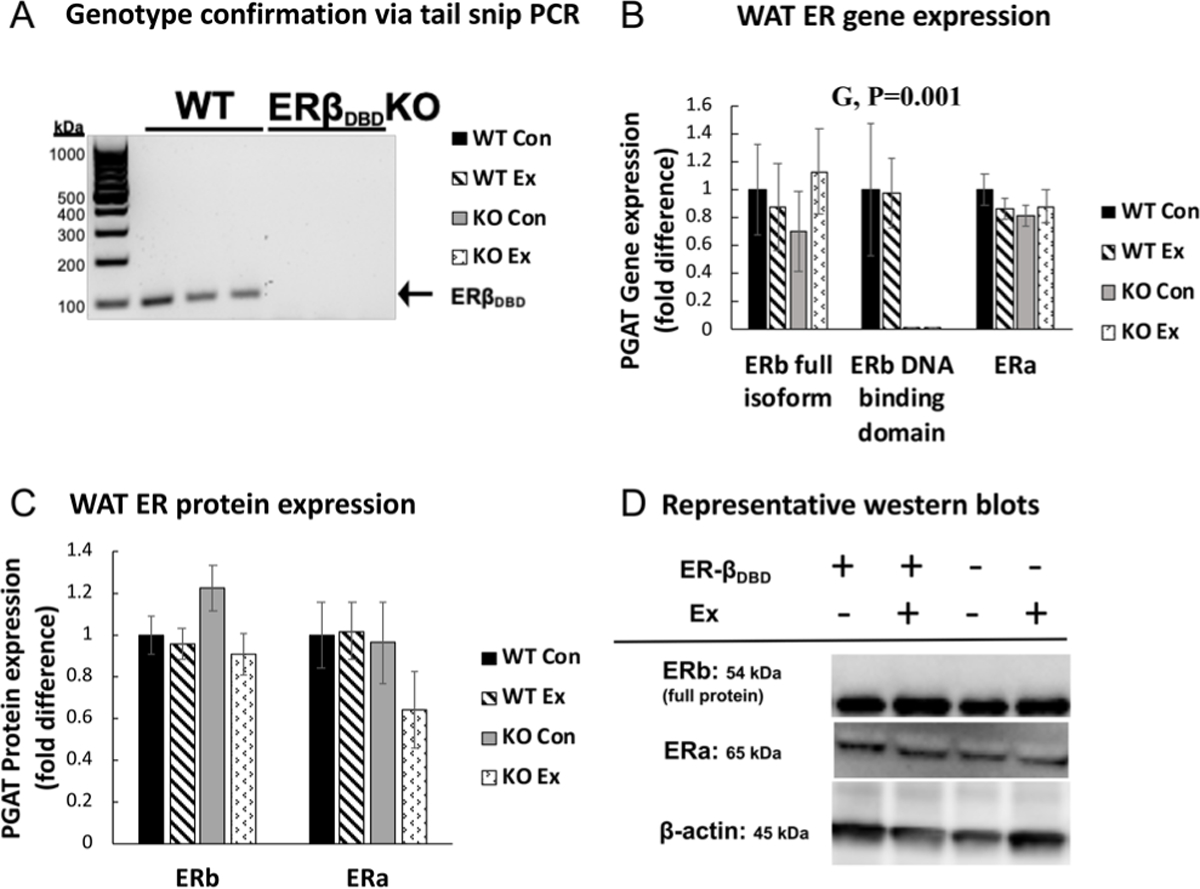
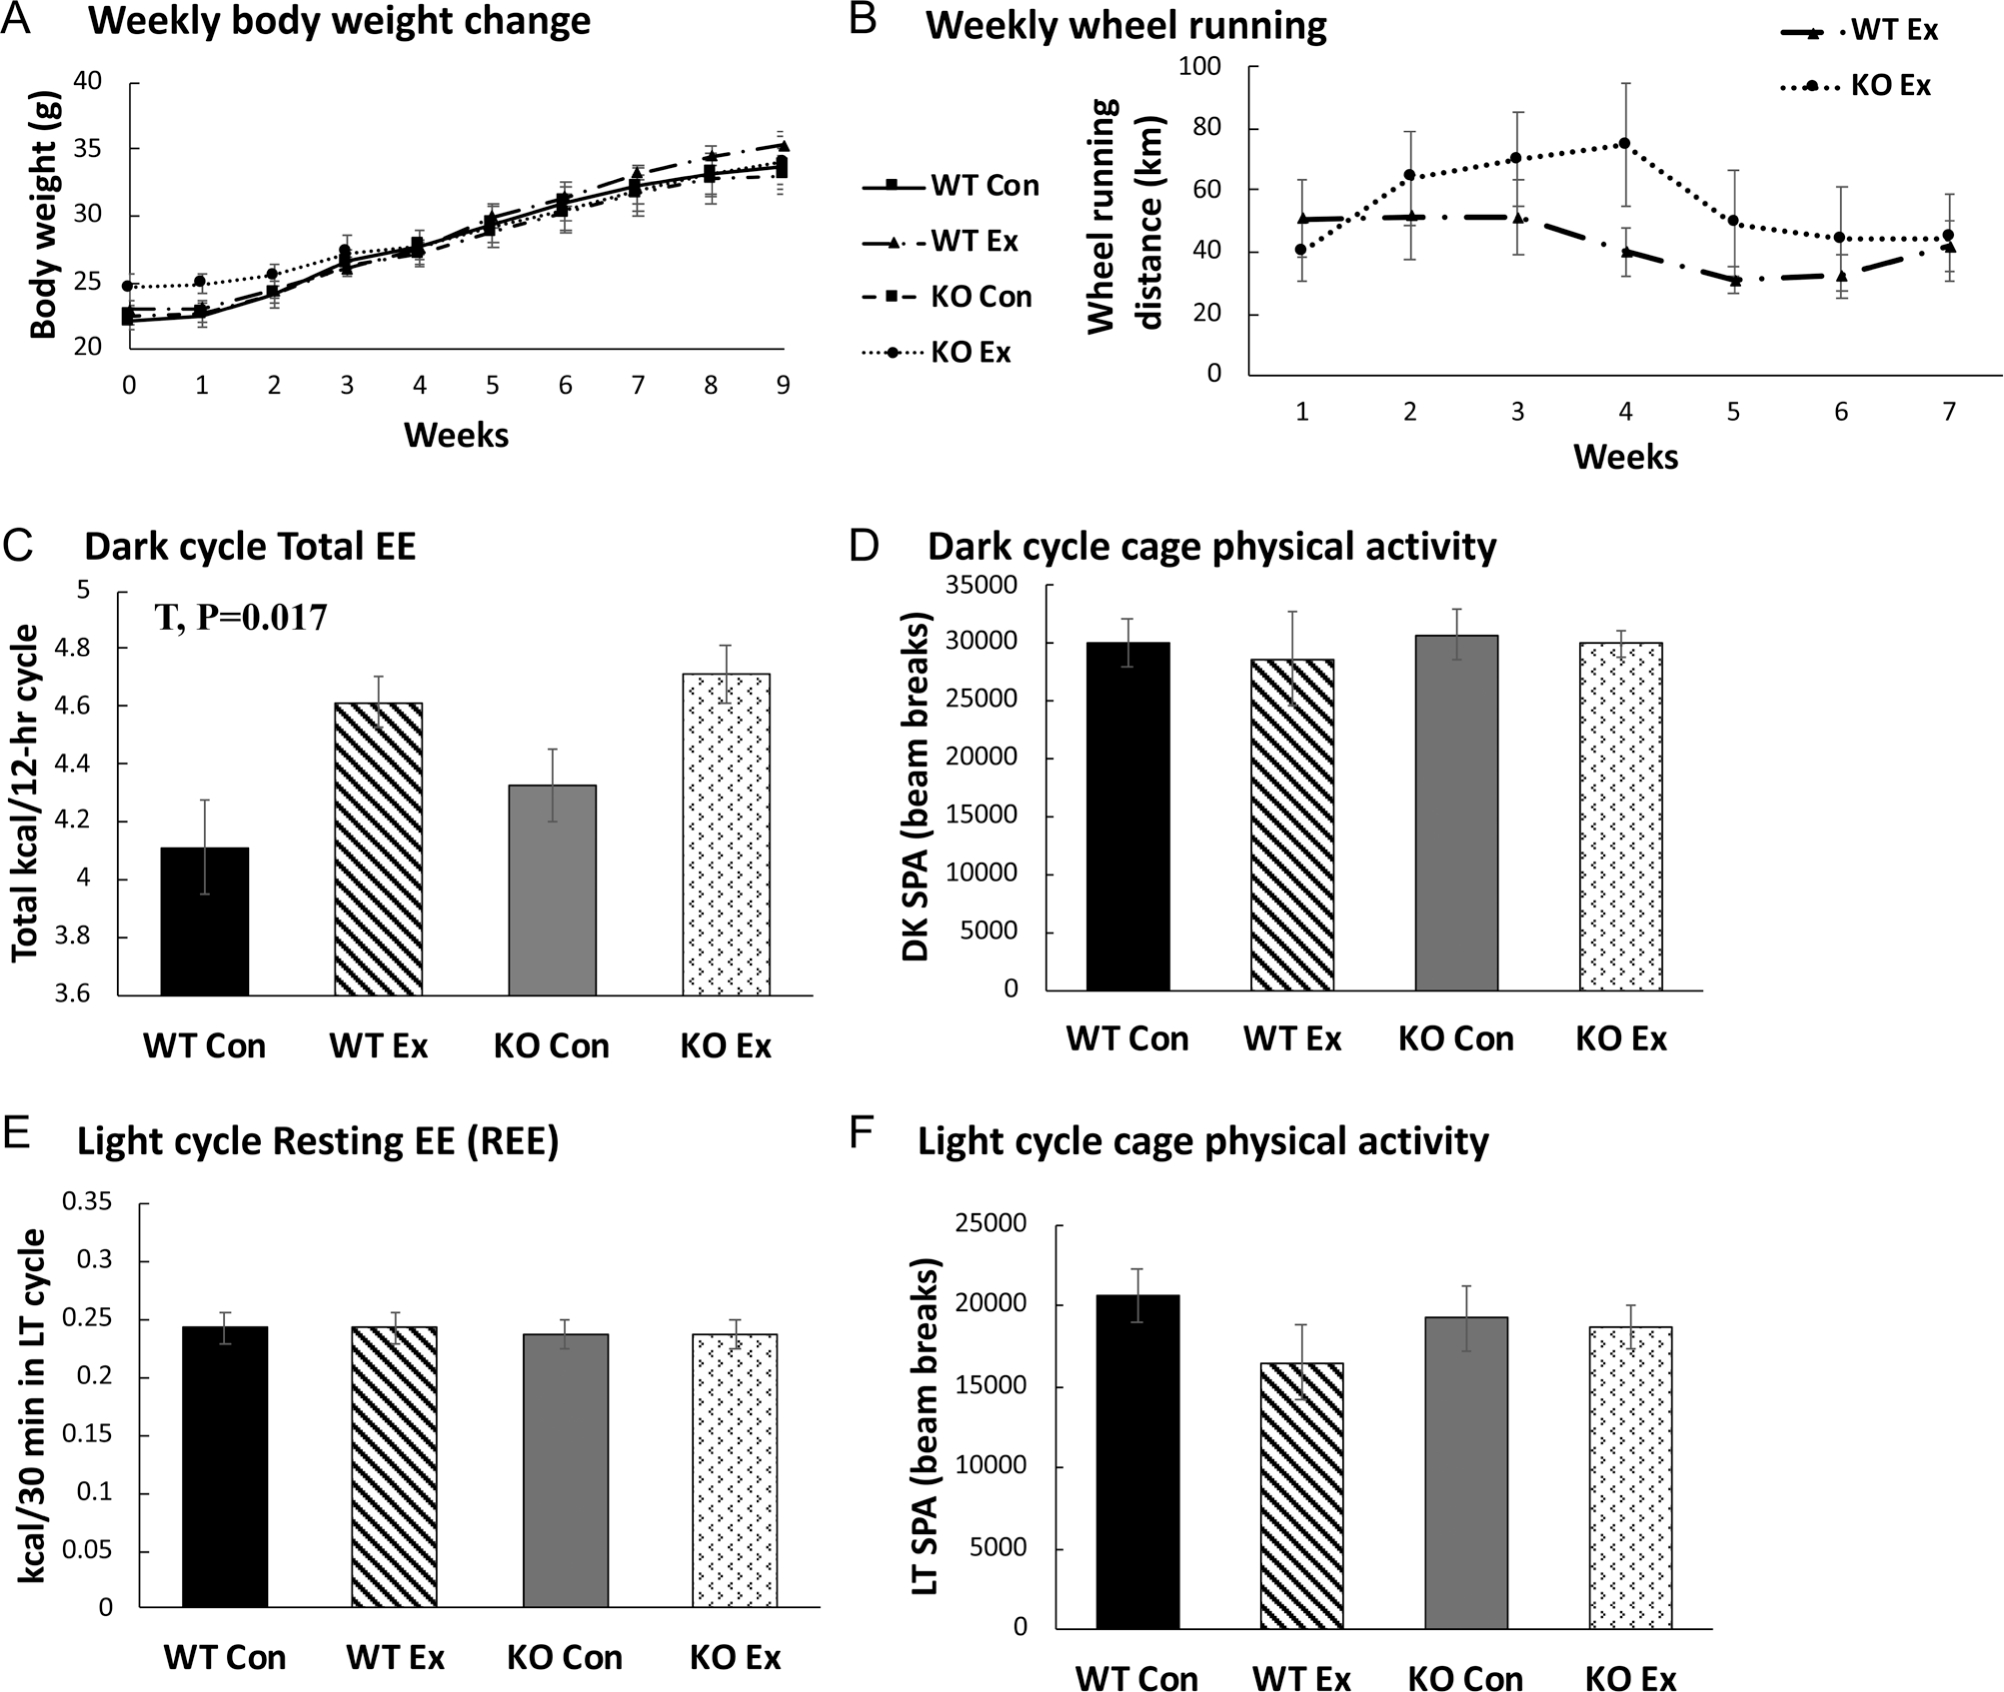
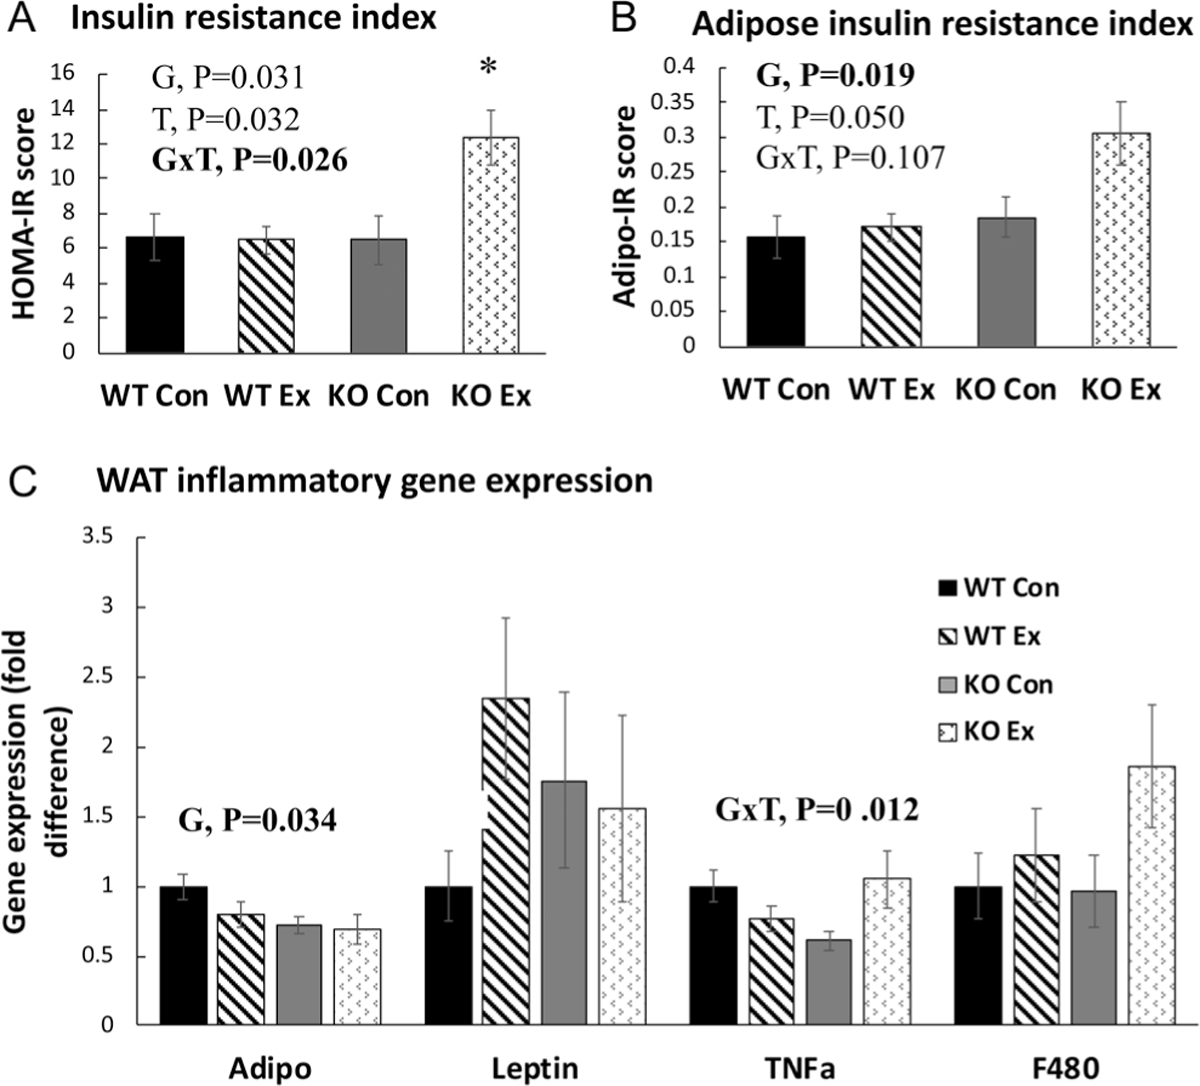
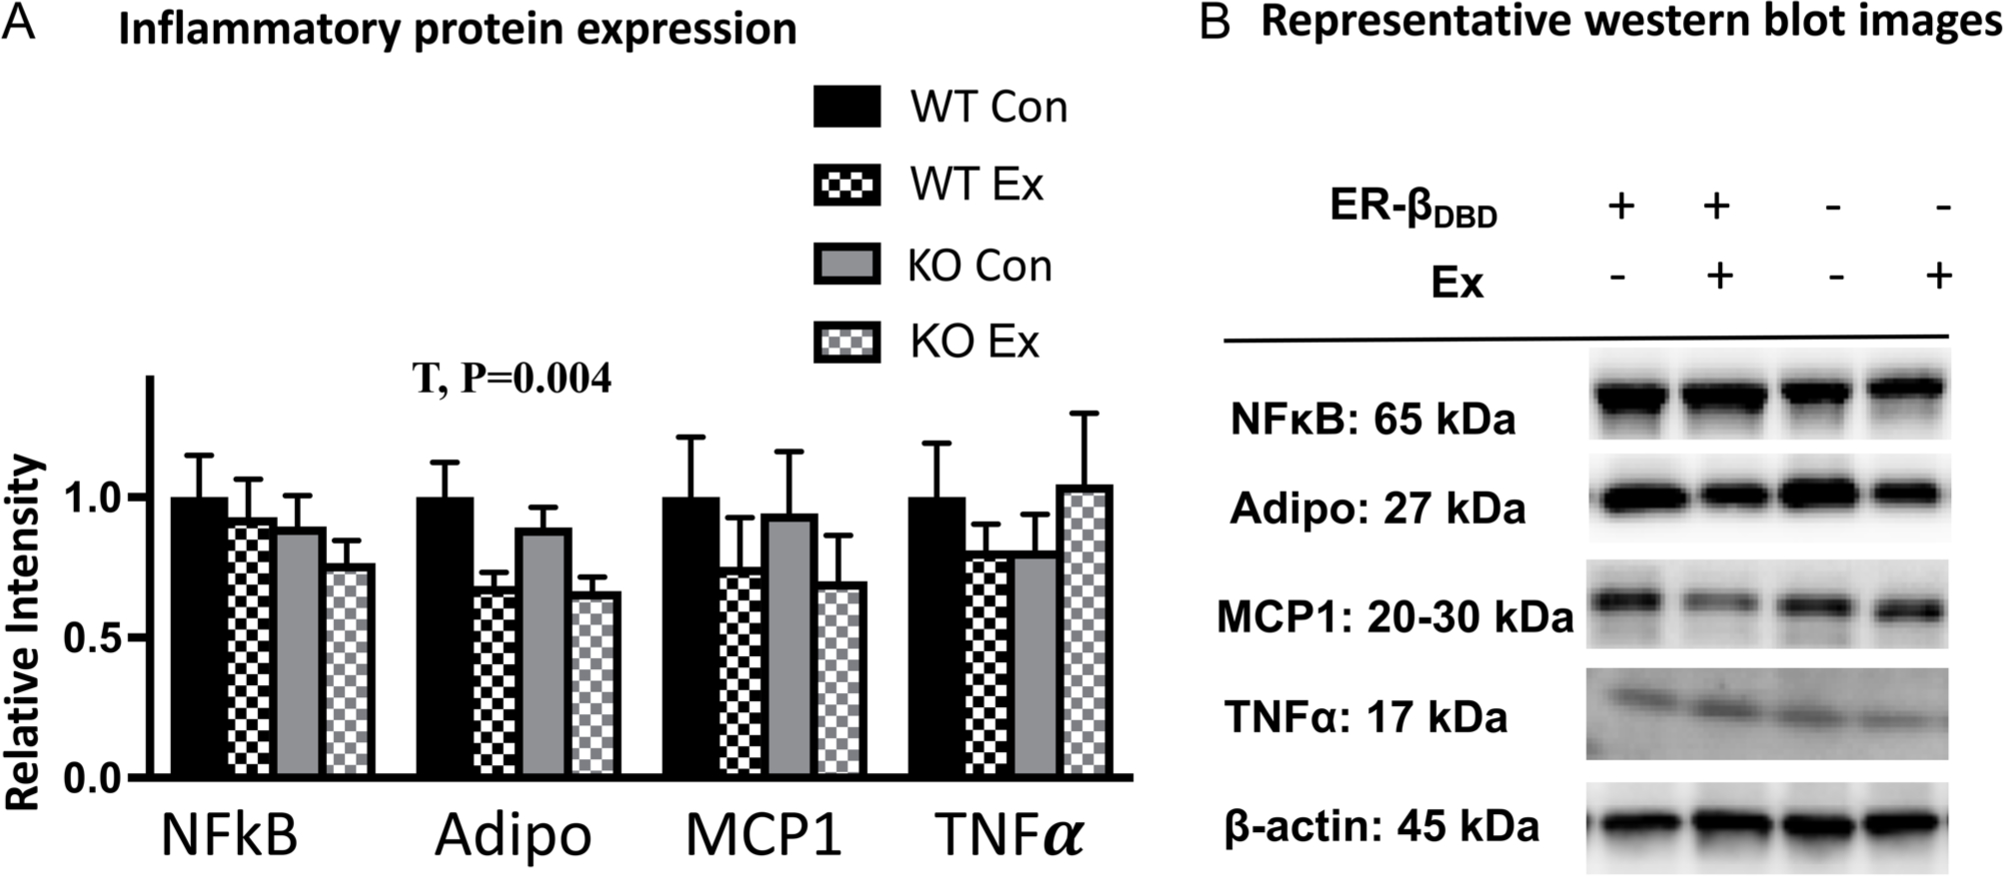
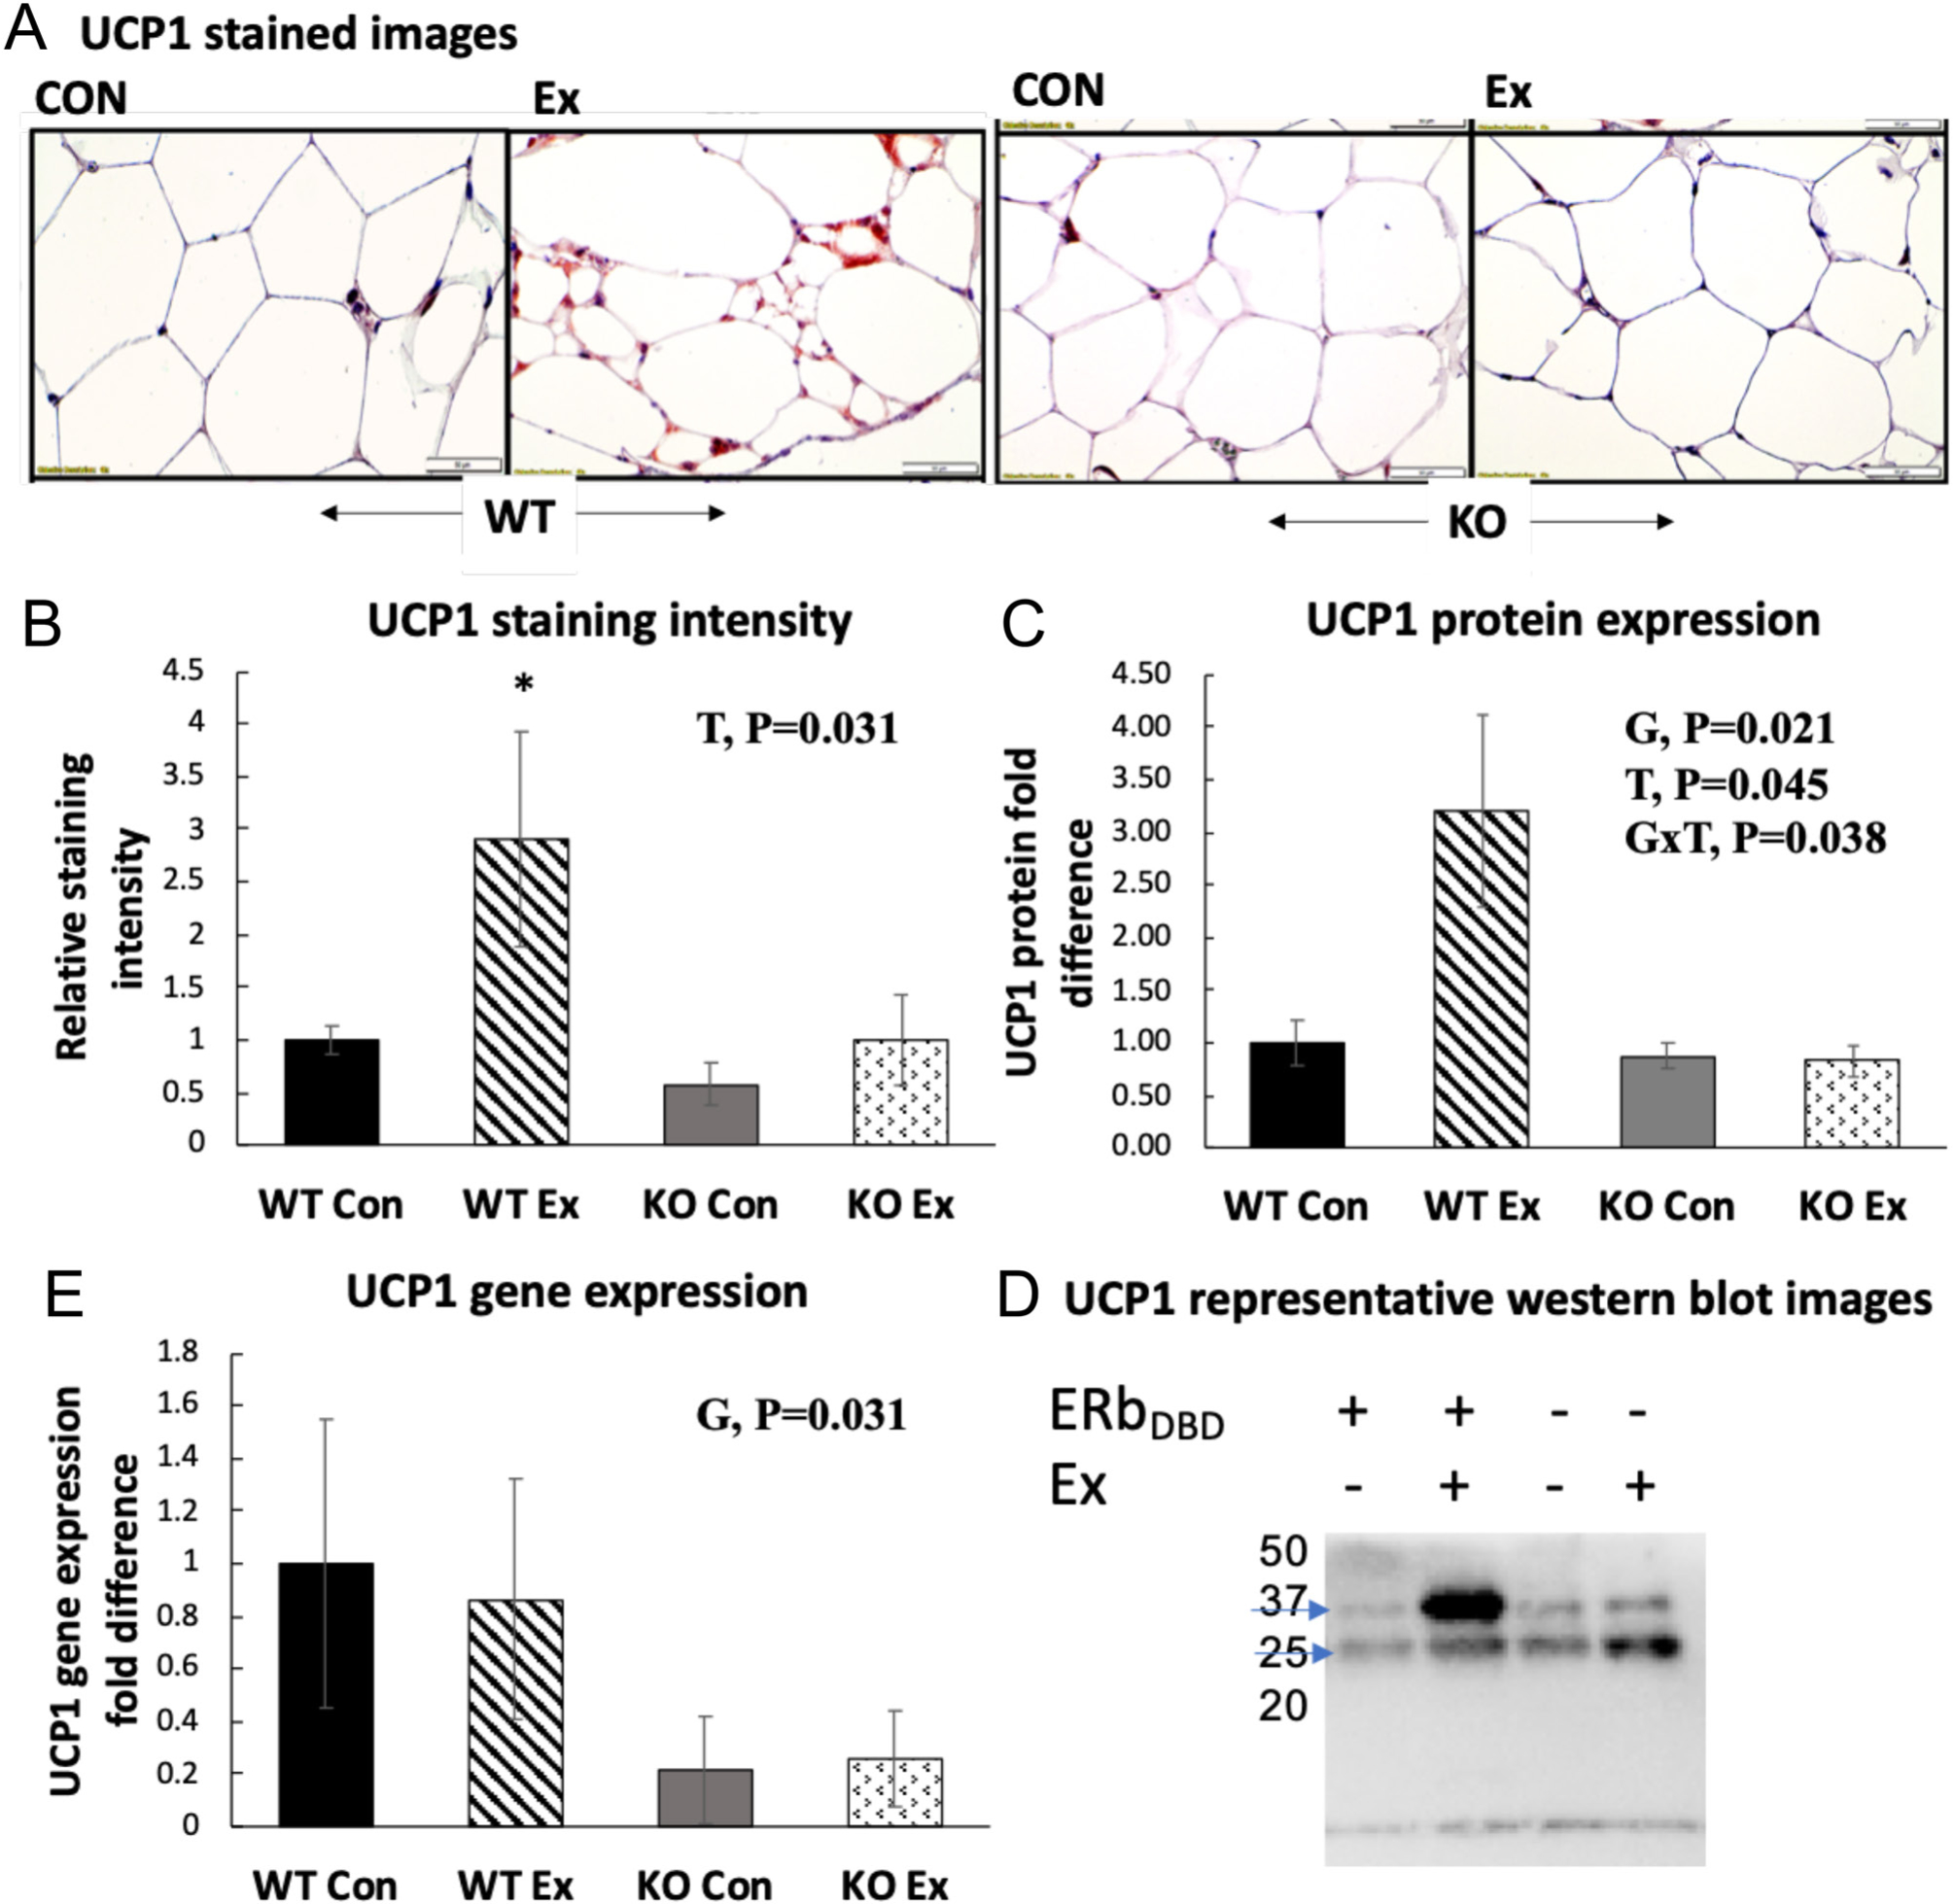
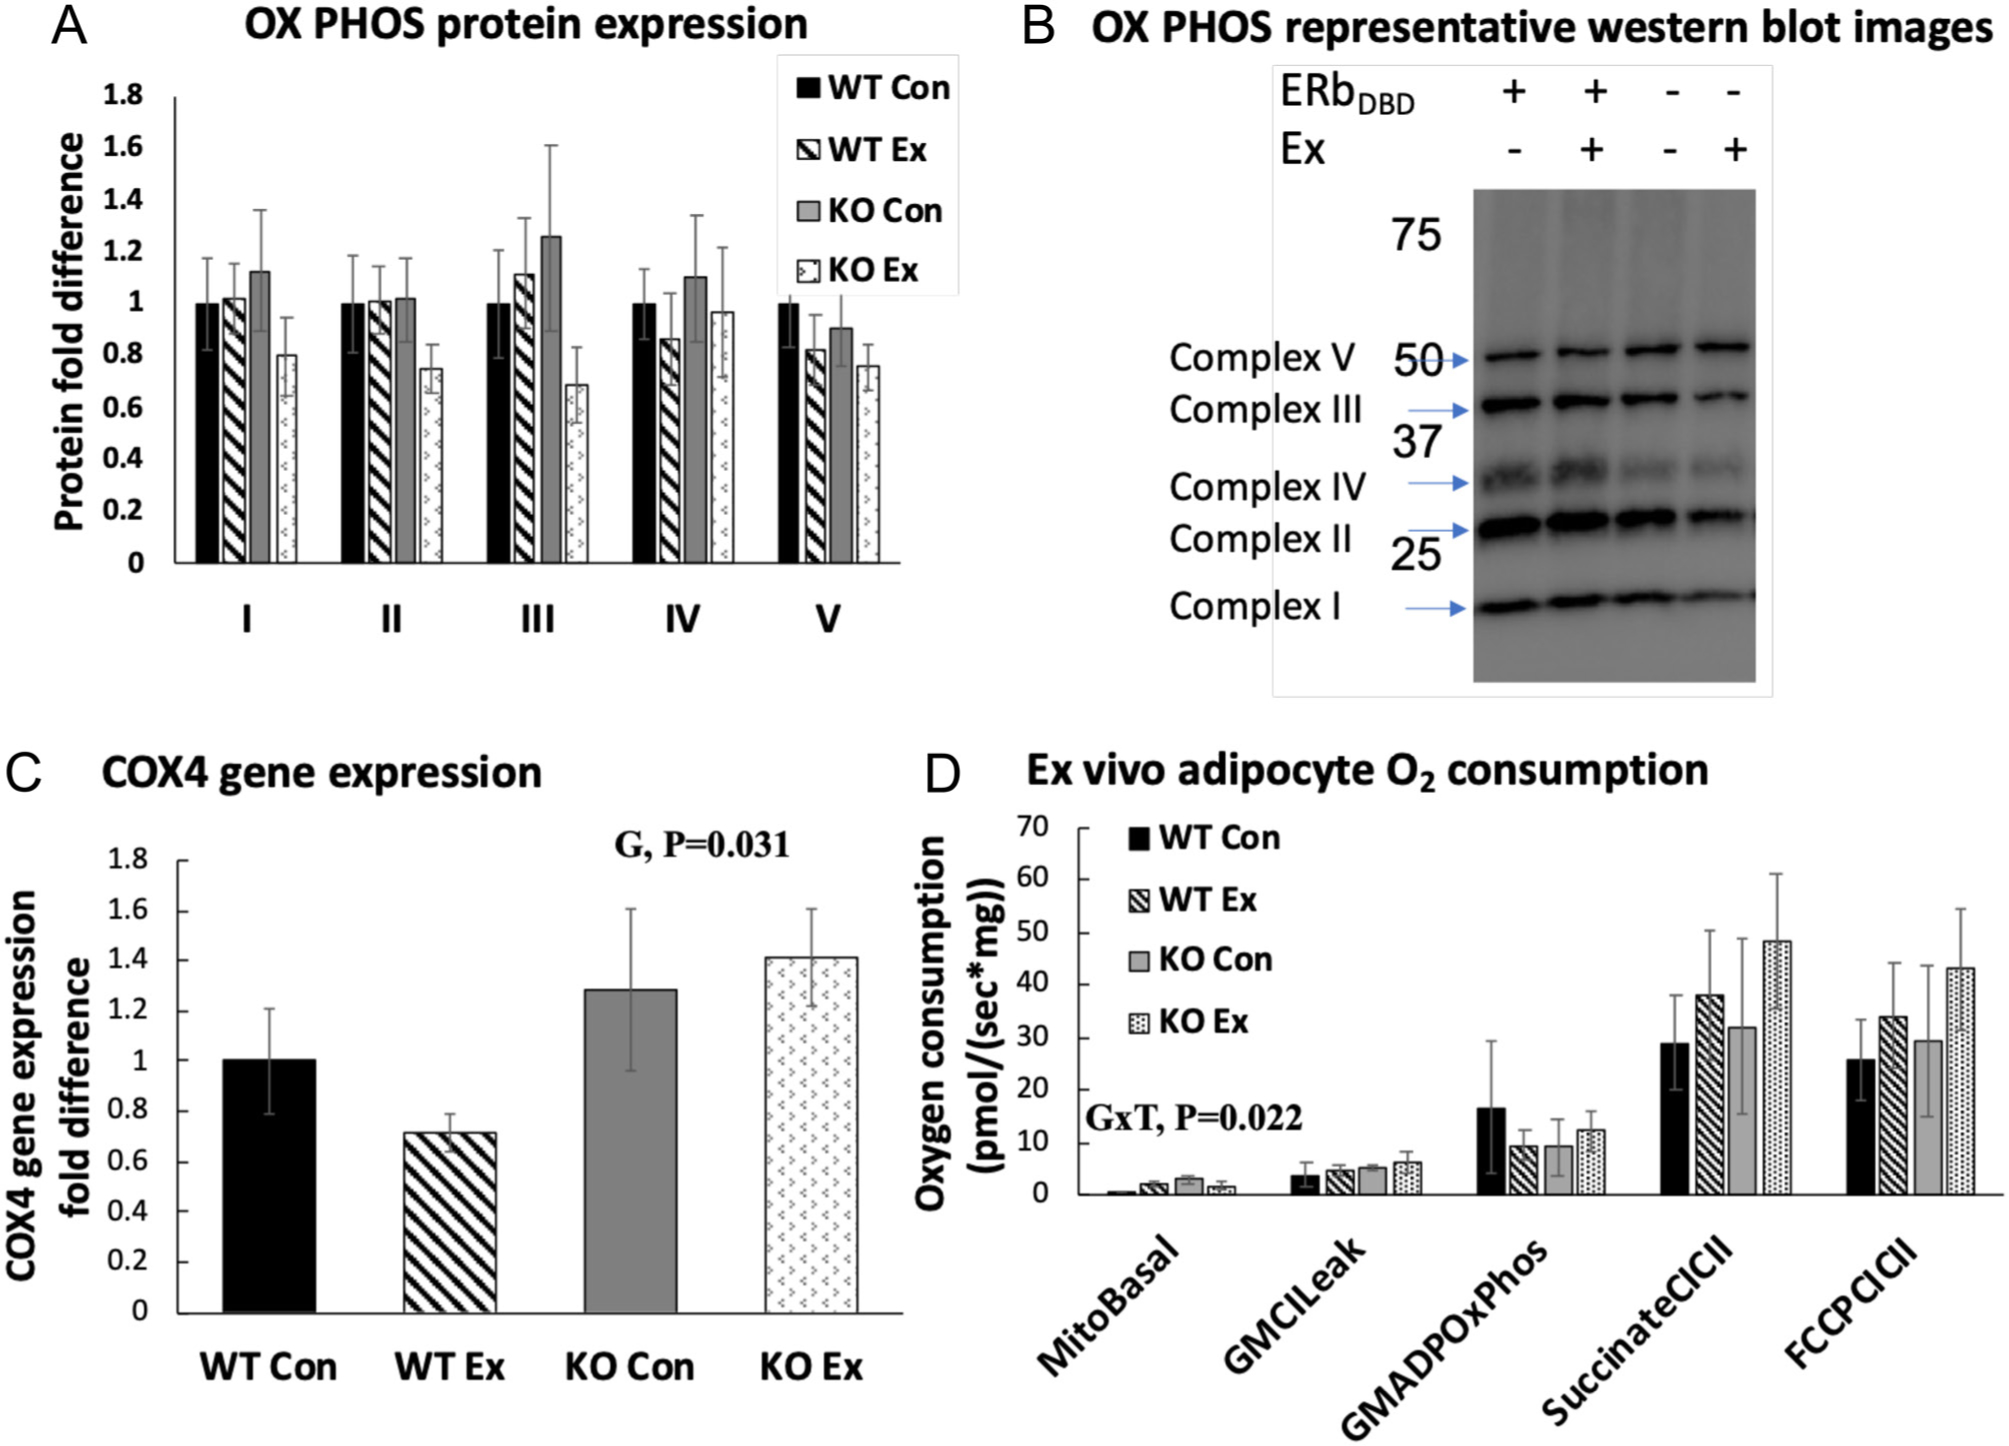
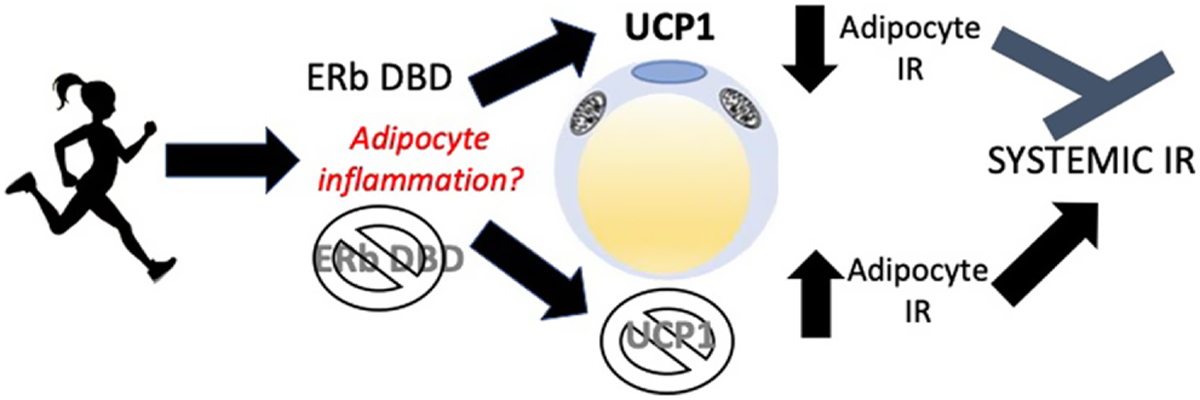
Estrogen receptor β (ERb), one of the two major estrogen receptors, acts via genomic and non-genomic signaling pathways to affect many metabolic functions, including mitochondrial biogenesis and respiration. This study assessed the effect of ERb classical genomic activity on adipocyte-specific and -systemic metabolic responses to wheel running exercise in a rodent model of menopause. Female mice lacking the ERb DNA-binding domain (ERbDBDKO, n = 20) and WT (n = 21) littermate controls were fed a high-fat diet (HFD), ovariectomized (OVX), and randomized to control (no running wheel) and exercise (running wheel access) groups and were followed for 8 weeks. Wheel running did not confer protection against metabolic dysfunction associated with HFD+OVX in either ERbDBDKO or WT mice, despite increased energy expenditure. Unexpectedly, in the ERbDBDKO group, wheel running increased fasting insulin and surrogate measures of insulin resistance, and modestly increased adipose tissue inflammatory gene expression (P ≤ 0.05). These changes were not accompanied by significant changes in adipocyte mitochondrial respiration. It was demonstrated for the first time that female WT OVX mice do experience exercise-induced browning of white adipose tissue, indicated by a robust increase in uncoupling protein 1 (UCP1) (P ≤ 0.05). However, KO mice were completely resistant to this effect, indicating that full ERb genomic activity is required for exercise-induced browning. The inability to upregulate UCP1 with exercise following OVX may have resulted in the increased insulin resistance observed in KO mice, a hypothesis requiring further investigation.
Keywords: DNA-binding domain; adipose tissue; estrogen receptor beta; ovariectomy.
Conflict of interest statement
Declaration of interest
The authors declare that there is no conflict of interest that could be perceived as prejudicing the impartiality of the reported research.
Figures
Similar articles
-
Effects of ERβ and ERα on OVX-induced changes in adiposity and insulin resistance.J Endocrinol. 2020 Apr;245(1):165-178. doi: 10.1530/JOE-19-0321. J Endocrinol. 2020. PMID: 32053493 Free PMC article.
-
Voluntary wheel running improves adipose tissue immunometabolism in ovariectomized low-fit rats.Adipocyte. 2018 Jan 2;7(1):20-34. doi: 10.1080/21623945.2017.1402991. Epub 2017 Dec 11. Adipocyte. 2018. PMID: 29226756 Free PMC article.
-
Suppression of estrogen receptor beta classical genomic activity enhances systemic and adipose-specific response to chronic beta-3 adrenergic receptor (β3AR) stimulation.Front Physiol. 2022 Sep 16;13:920675. doi: 10.3389/fphys.2022.920675. eCollection 2022. Front Physiol. 2022. PMID: 36213237 Free PMC article.
-
Modulation of Energy Expenditure by Estrogens and Exercise in Women.Exerc Sport Sci Rev. 2018 Oct;46(4):232-239. doi: 10.1249/JES.0000000000000160. Exerc Sport Sci Rev. 2018. PMID: 30001272 Free PMC article. Review.
-
Adipocyte Metabolism and Health after the Menopause: The Role of Exercise.Nutrients. 2023 Jan 14;15(2):444. doi: 10.3390/nu15020444. Nutrients. 2023. PMID: 36678314 Free PMC article. Review.
Cited by
-
Knockdown of Esr1 from DRD1-Rich Brain Regions Affects Adipose Tissue Metabolism: Potential Crosstalk between Nucleus Accumbens and Adipose Tissue.Int J Mol Sci. 2024 Jun 1;25(11):6130. doi: 10.3390/ijms25116130. Int J Mol Sci. 2024. PMID: 38892320 Free PMC article.
-
Exercise-induced mitochondrial protection in skeletal muscle of ovariectomized mice: A myogenic E2 synthesis-independent mechanism.Redox Biol. 2025 Sep;85:103735. doi: 10.1016/j.redox.2025.103735. Epub 2025 Jun 21. Redox Biol. 2025. PMID: 40578025 Free PMC article.
-
Role of estrogen in the regulation of central and peripheral energy homeostasis: from a menopausal perspective.Ther Adv Endocrinol Metab. 2023 Sep 15;14:20420188231199359. doi: 10.1177/20420188231199359. eCollection 2023. Ther Adv Endocrinol Metab. 2023. PMID: 37719789 Free PMC article. Review.
-
The confounding effects of sub-thermoneutral housing temperatures on aerobic exercise-induced adaptations in mouse subcutaneous white adipose tissue.Biol Lett. 2021 Jun;17(6):20210171. doi: 10.1098/rsbl.2021.0171. Epub 2021 Jun 30. Biol Lett. 2021. PMID: 34186002 Free PMC article.
-
N-myc Downstream-Regulated Gene 2 (Ndrg2): A Critical Mediator of Estrogen-Induced Neuroprotection Against Cerebral Ischemic Injury.Mol Neurobiol. 2022 Aug;59(8):4793-4804. doi: 10.1007/s12035-022-02877-5. Epub 2022 May 27. Mol Neurobiol. 2022. PMID: 35622273
References
-
- Aldiss P, Lewis JE, Lupini I, Boocock DJ, Miles AK, Ebling FJP, Budge H & Symonds ME 2019. Exercise does not induce browning of WAT at thermoneutrality and induces an oxidative, myogenic signature in BAT. bioRxiv 649061. (10.1101/649061) - DOI
-
- Aldiss P, Lewis JE, Lupini I, Bloor I, Chavoshinejad R, Boocock DJ, Miles AK, Ebling FJP, Budge H & Symonds ME 2020. Exercise training in obese rats does not induce browning at thermoneutrality and induces a muscle-like signature in brown adipose tissue. Frontiers in Endocrinology 11 97. (10.3389/fendo.2020.00097) - DOI - PMC - PubMed
-
- Clookey SL, Welly RJ, Shay D, Woodford ML, Fritsche KL, Rector RS, Padilla J, Lubahn DB & Vieira-Potter VJ 2019. Beta 3 adrenergic receptor activation rescues metabolic dysfunction in female estrogen receptor alpha-null mice. Frontiers in Physiology 10 9. (10.3389/fphys.2019.00009) - DOI - PMC - PubMed
Publication types
MeSH terms
Substances
Grants and funding
LinkOut - more resources
Full Text Sources
Other Literature Sources
Research Materials
