. 2021 Apr 27;5(8):2087-2100.
doi: 10.1182/bloodadvances.2020002666.

Inhibiting autophagy targets human leukemic stem cells and hypoxic AML blasts by disrupting mitochondrial homeostasis

Affiliations

Inhibiting autophagy targets human leukemic stem cells and hypoxic AML blasts by disrupting mitochondrial homeostasis

Kaitlyn M Dykstra et al. Blood Adv. .

Abstract

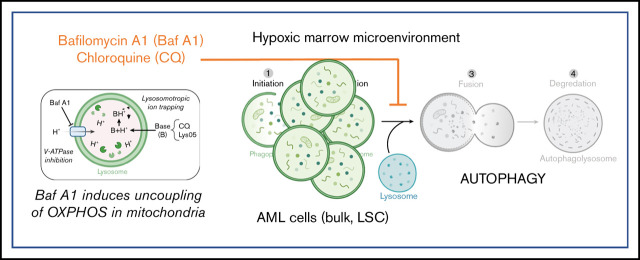
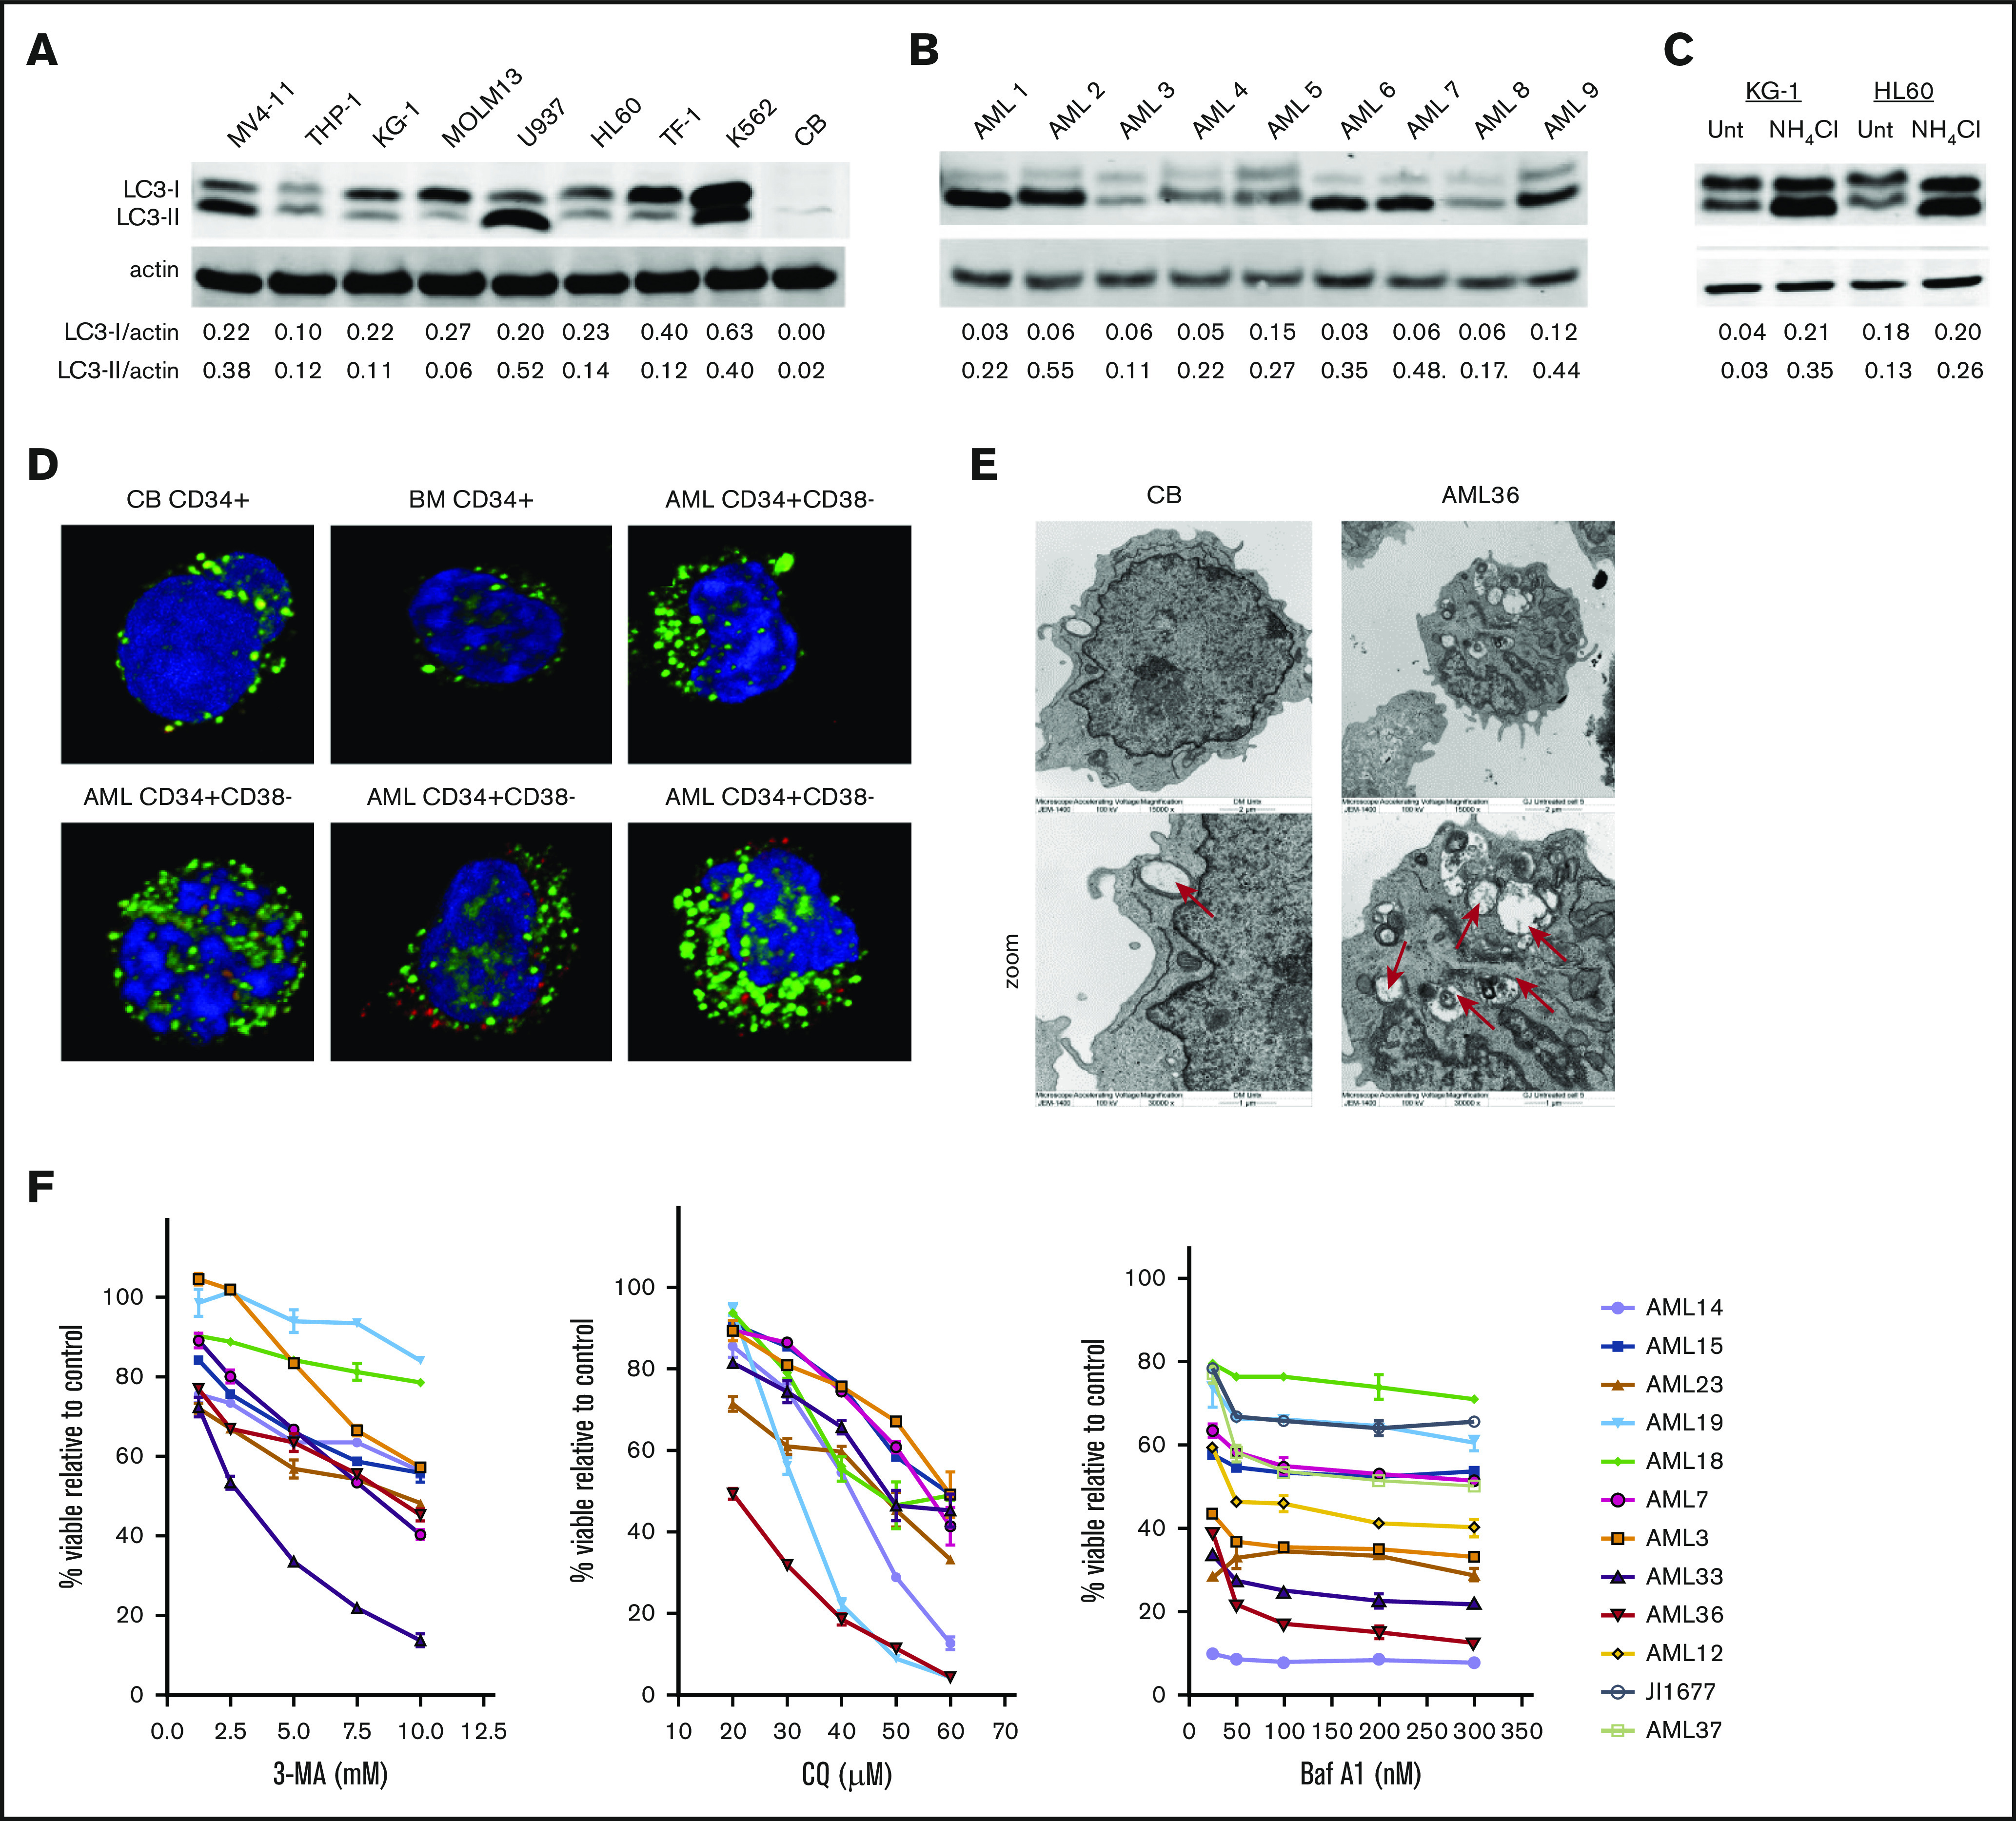
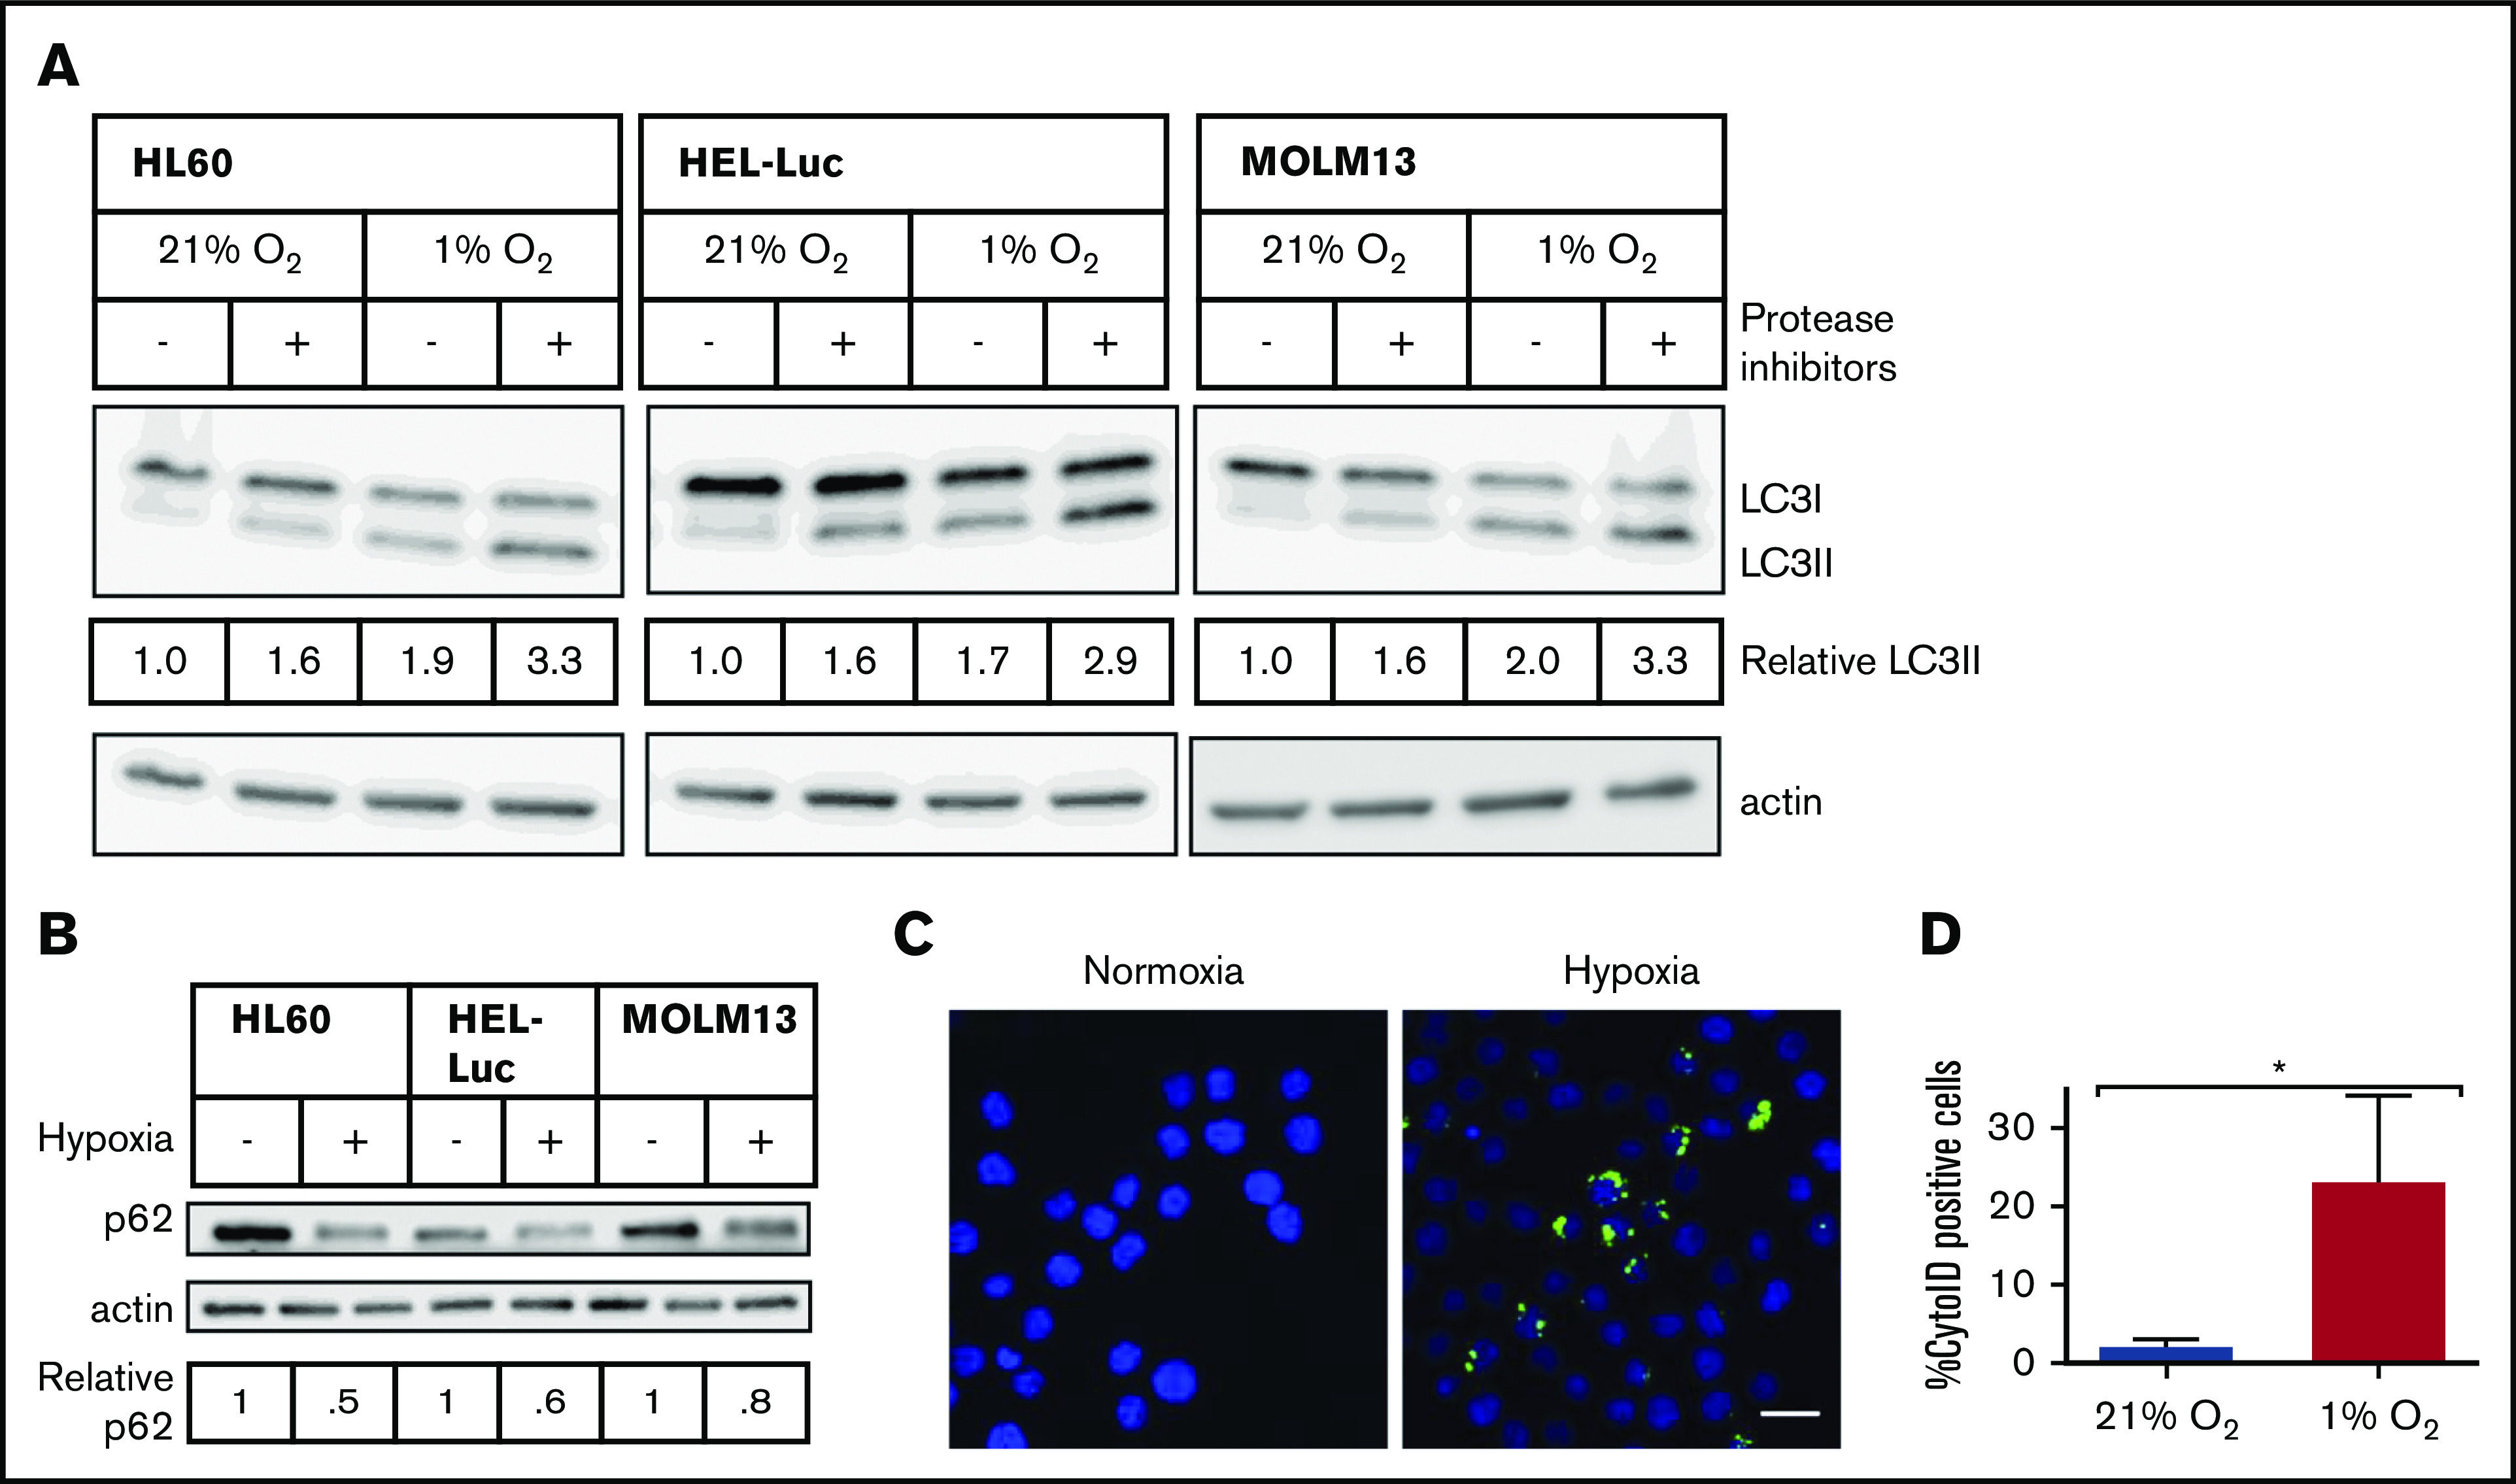
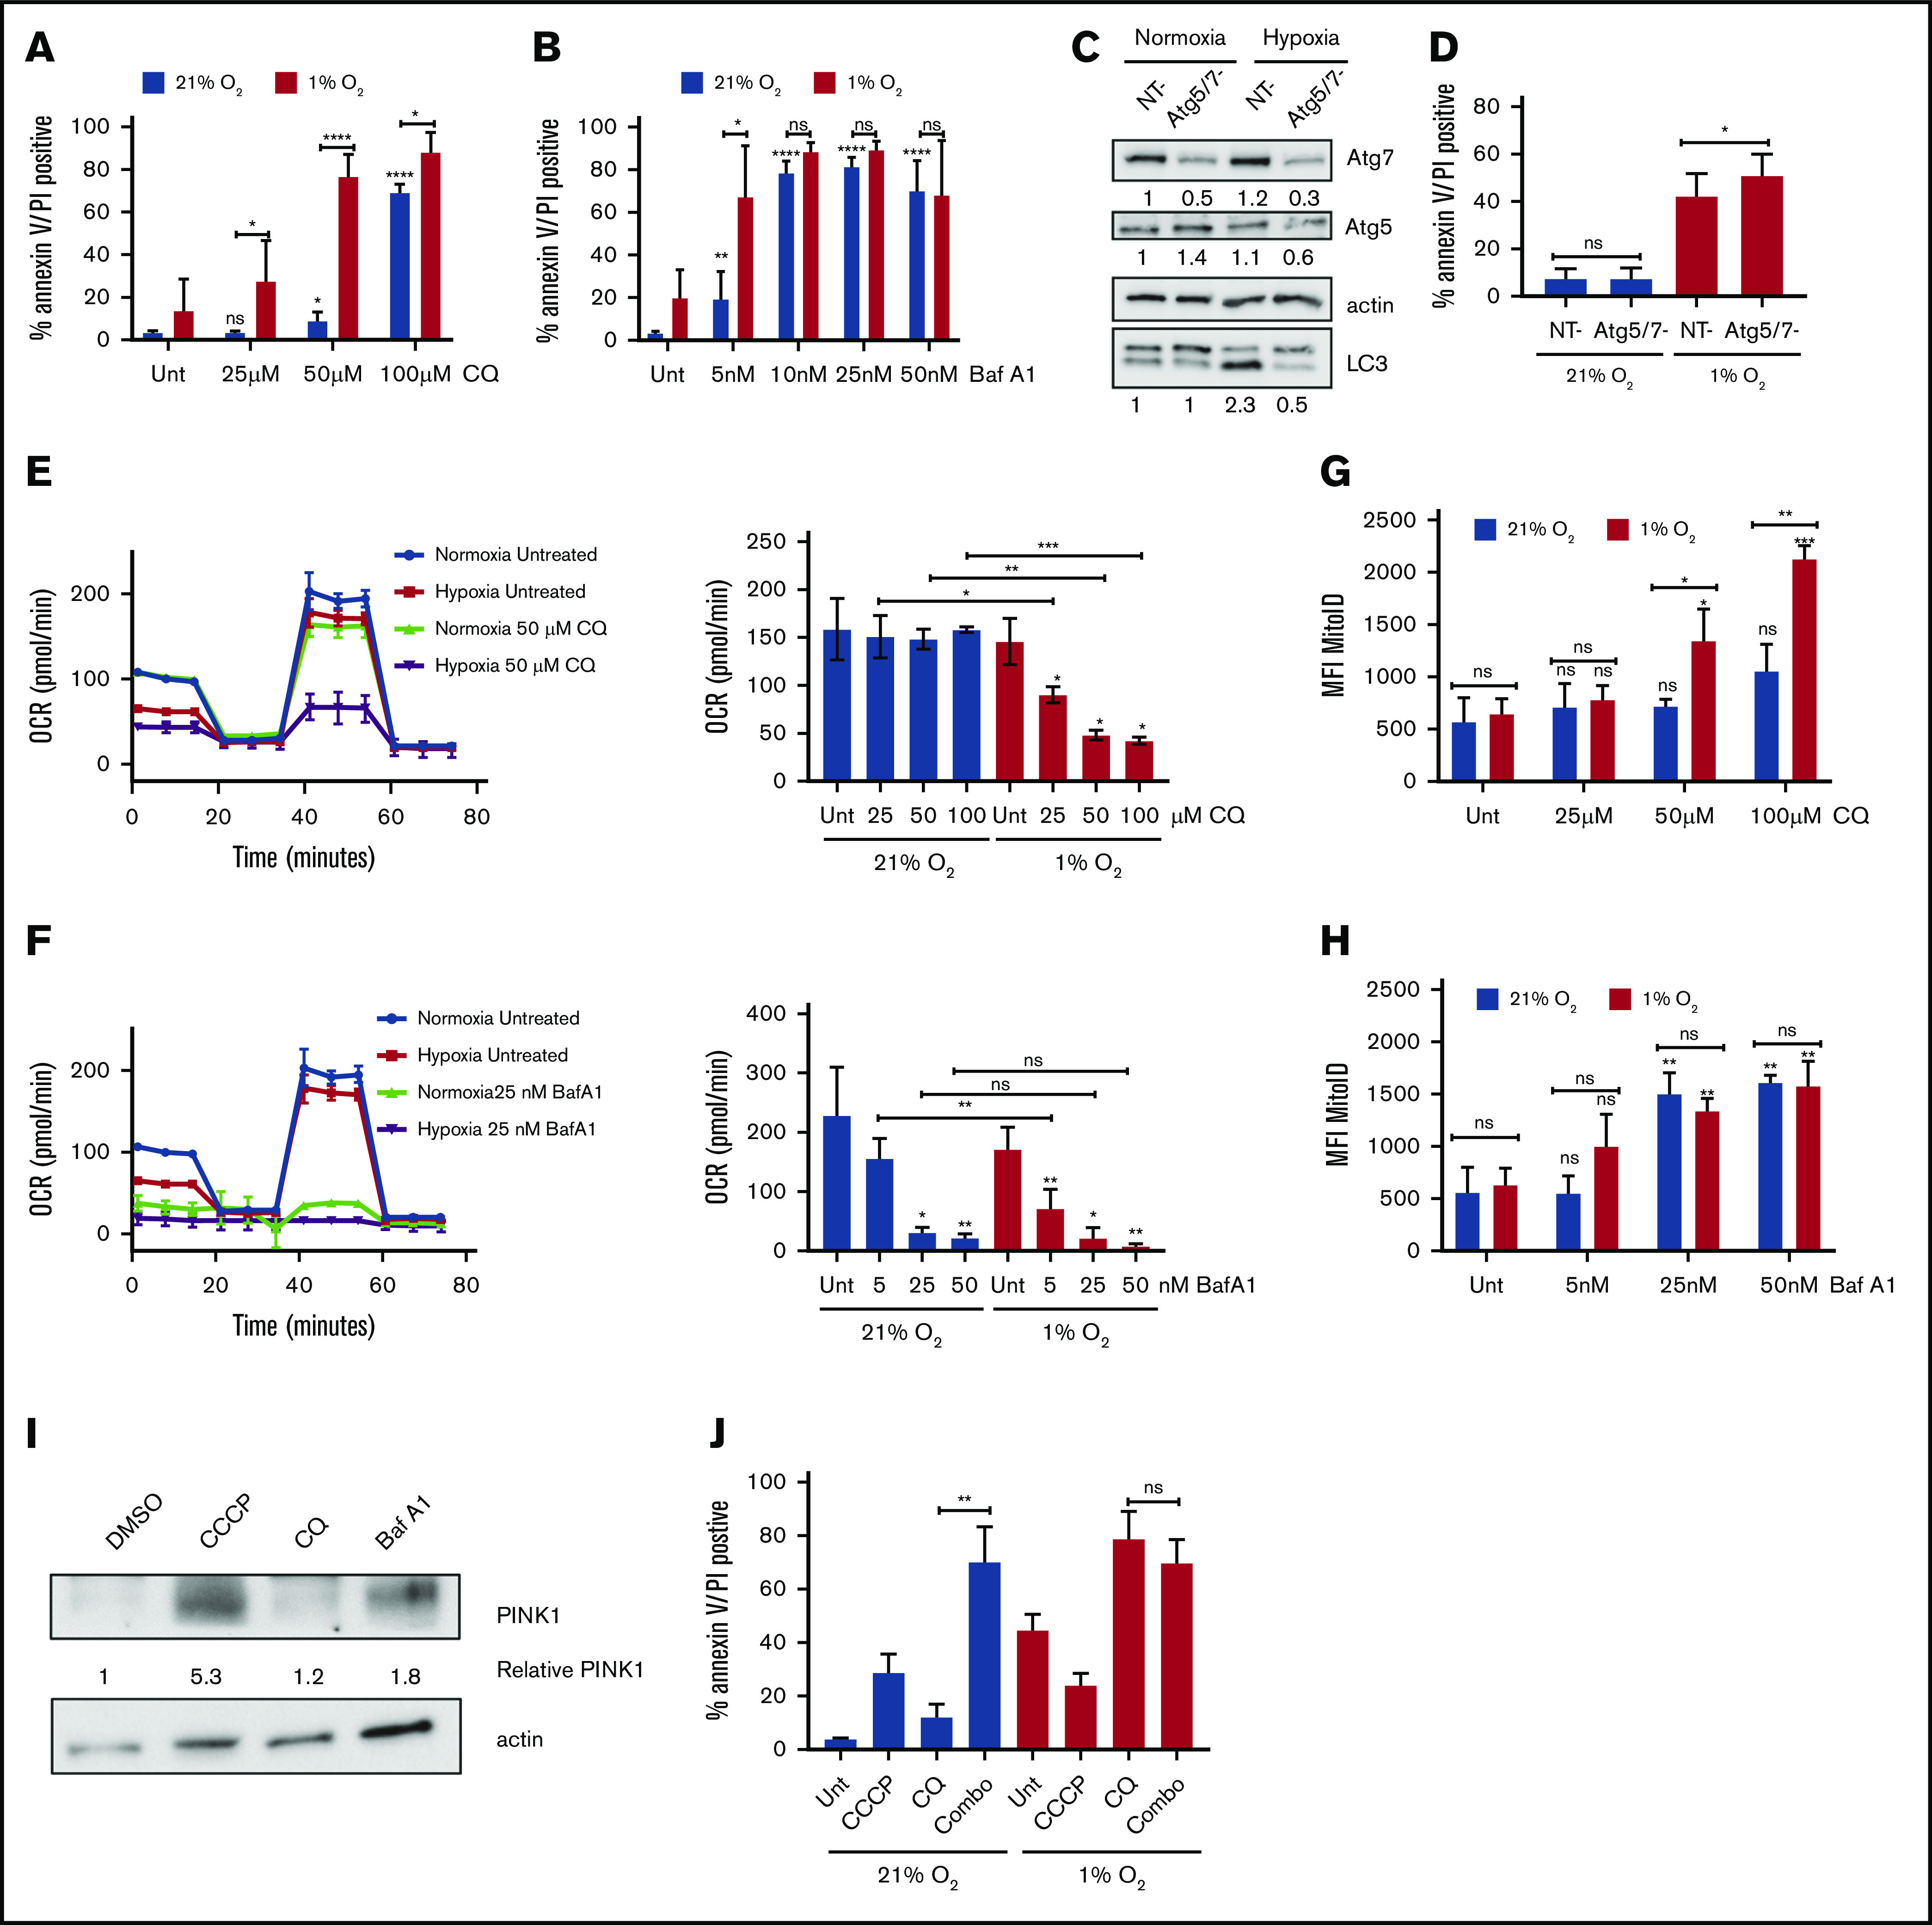
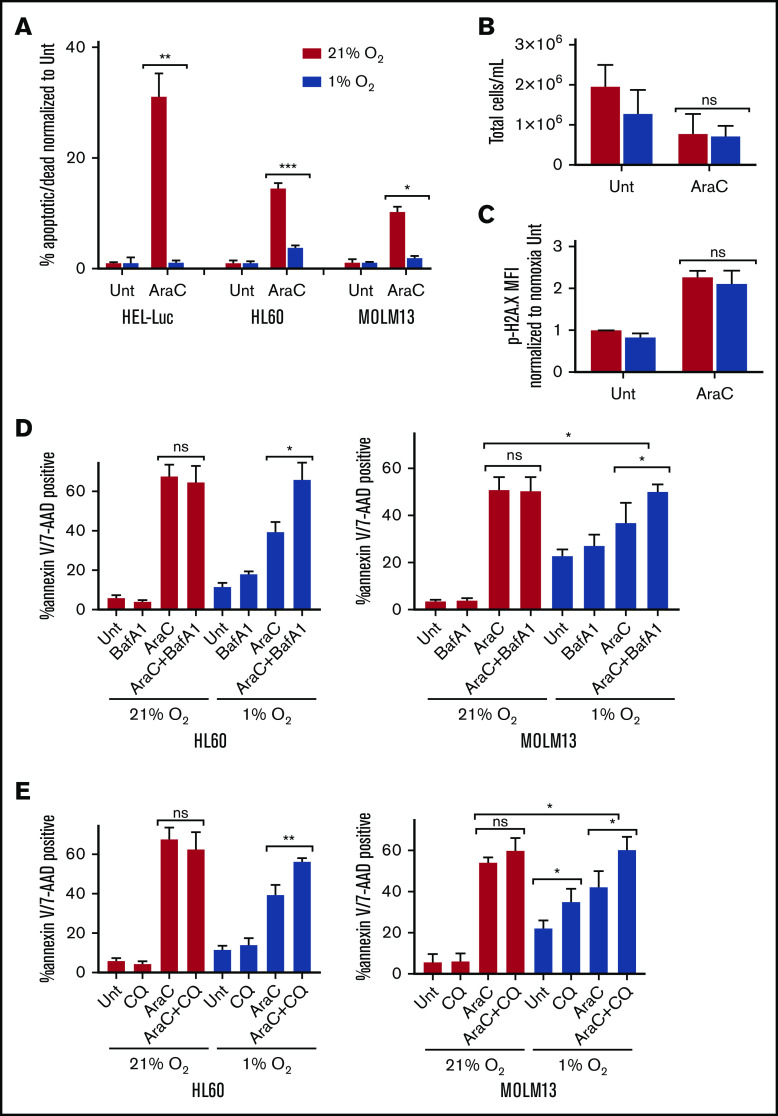
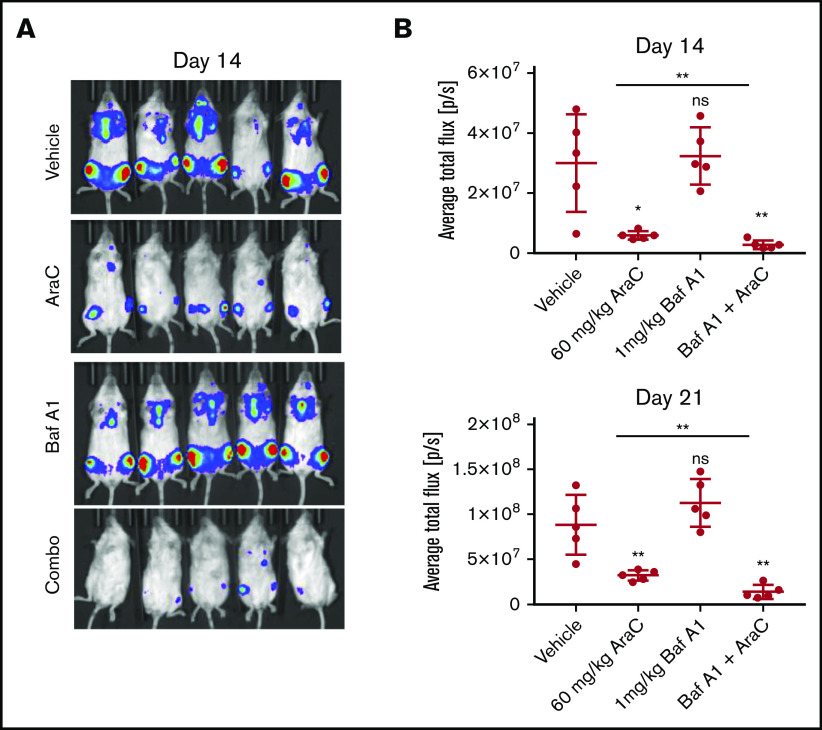
Leukemia stem cells (LSCs) and therapy-resistant acute myeloid leukemia (AML) blasts contribute to the reinitiation of leukemia after remission, necessitating therapeutic interventions that target these populations. Autophagy is a prosurvival process that allows for cells to adapt to a variety of stressors. Blocking autophagy pharmacologically by using mechanistically distinct inhibitors induced apoptosis and prevented colony formation in primary human AML cells. The most effective inhibitor, bafilomycin A1 (Baf A1), also prevented the in vivo maintenance of AML LSCs in NSG mice. To understand why Baf A1 exerted the most dramatic effects on LSC survival, we evaluated mitochondrial function. Baf A1 reduced mitochondrial respiration and stabilized PTEN-induced kinase-1 (PINK-1), which initiates autophagy of mitochondria (mitophagy). Interestingly, with the autophagy inhibitor chloroquine, levels of enhanced cell death and reduced mitochondrial respiration phenocopied the effects of Baf A1 only when cultured in hypoxic conditions that mimic the marrow microenvironment (1% O2). This indicates that increased efficacy of autophagy inhibitors in inducing AML cell death can be achieved by concurrently inducing mitochondrial damage and mitophagy (pharmacologically or by hypoxic induction) and blocking mitochondrial degradation. In addition, prolonged exposure of AML cells to hypoxia induced autophagic flux and reduced chemosensitivity to cytarabine (Ara-C), which was reversed by autophagy inhibition. The combination of Ara-C with Baf A1 also decreased tumor burden in vivo. These findings demonstrate that autophagy is critical for mitochondrial homeostasis and survival of AML cells in hypoxia and support the development of autophagy inhibitors as novel therapeutic agents for AML.


Conflict of interest statement

Conflict-of-interest disclosure: The authors declare no competing financial interests.

Figures

None
Graphical abstract
Figure 1.
Figure 1.
AML cells have high levels of constitutive autophagy, compared with normal CD34+cells and are sensitive to autophagy inhibition. Immunoblot analysis of the indicated AML cell lines (A) and patient samples (B) of LC3 and actin (loading control) showed different levels of basal autophagy. Quantification of LC3-I and -II levels was performed with Image J software. (C) The KG-1 and HL60 cell lines were incubated with NH4Cl overnight (>12 hours), and the lysates were analyzed for LC3 and actin (loading control). Increased LC3-II after treatment indicates active autophagic flux. (D) CD34+ cells from CB, BM, or patients with AML were stained with antibodies against LC3 (green) as a marker of autophagosomes or LAMP-2 (red) as a marker of lysosomes with DAPI (blue) as a nuclear stain. (E) Electron micrograph images show more autophagosomes in AML cells, compared with nonmalignant CB cells. Original magnification ×15 000, ×30 000 zoom. (F) Samples from AML patients were treated with increasing concentrations of autophagy inhibitors CQ, 3-MA, or Baf A1. Cell viability was measured with YOPRO-1 and 7-AAD and is displayed as the percentage of viable cells, compared with the untreated controls.
Figure 2.
Figure 2.
Baf A1 preferentially targets functionally defined LSCs and leads to the accumulation of damaged mitochondria. (A) Primary cells from patients with AML were grown in methylcellulose with the indicated drug (7.5 µM PTL, 2.5 µM Ara-C, 40 µM CQ, 50 nM Baf A1, and 10 mM 3-MA). Data are shown as the number of CFUs, compared with those in untreated cells. After the primary plating was quantified, the cells were collected for a secondary replating (technical replicates). Error bars represent ± standard error of the mean (SEM). Statistical analysis compared each treatment mean with that of Baf A1. (B) NSG mice were inoculated with samples from 2 patients with AML (AML 1 and AML 2) and treated with DMSO or Baf A1 (1 mg/kg) intraperitoneally 2 times per week for 4 weeks (5 mice per group). The BM was then harvested from the mouse recipients of the primary transplant, measured for AML burden by flow cytometry for human and mouse CD45, and injected via the tail vein into the second set of NSG mice. The AML burden of the secondary transplant was measured after 6 to 8 weeks. (C) Electron micrographs of healthy donor CB or AML18 samples after overnight treatment with Baf A1 (25 nM). AML cells demonstrated an increase in the number of mitochondria. Original magnification ×15 000. (D) CD34+-enriched samples from patients with AML were treated with 25 nM Baf A1 for 48 hours, then stained for mitochondria using MitoID (2 technical replicates). Data are shown as mean fluorescence intensity (MFI) of MitoID. (E-G) AML samples or MOLM-13 cells were treated with Baf A1 or CQ for 48 hours. Viability of all samples was >85%, by trypan blue exclusion. (E) Representative MitoStress Test profile determined with a Seahorse XF analyzer. (F) MitoID MFI (≥3 biological replicates; 3 technical replicates). (G) Average maximal respiration (≥3 biological replicates; 3 technical replicates). Error bars represent ± standard deviation. *P < .05; ** P < .01; *** P < .001. ns, not significant.
Figure 3.
Figure 3.
Hypoxia induces autophagic flux in AML cell lines. AML cell lines were incubated in normoxia or hypoxia for 48 hours, with or without lysosomal protease inhibitors (10 µg/mL pepstatin A and E-64d) added for the final 6 hours. (A) Immunoblot analysis of LC3 and actin (loading control) is shown. LC3-II levels were determined by densitometric analysis and normalized to actin. Values are relative to untreated cells in 21% O2. (B) Immunoblot analysis of p62 and actin (loading control). Blots are representative of 2 independent experiments. (C) HEL-Luc cells were stained with Cyto-ID, fixed, mounted in Vectashield+DAPI, and imaged on a Leica TCS SP2 spectral confocal microscope with a 63× objective (blue, nucleus/DAPI; green, autophagosomes/Cyto-ID). Bar represents 10 µm. (D) Microscopic images were quantified by ImageJ to determine the percentage of Cyto-ID+ cells (3 biological replicates, ≥100 cells counted per replicate). Error bars represent ± standard deviation. *P < .05.
Figure 4.
Figure 4.
Sensitivity to autophagy inhibitors in hypoxia correlates with the extent of inhibition of mitochondrial respiration. (A-B) MOLM-13 AML cell lines were treated with the indicated concentrations of CQ (A) or Baf A1 (B) in normoxia or hypoxia for 72 hours and analyzed by annexin V/PI flow cytometry (≥3 biological replicates; 2 technical replicates). (C-D) MOLM-13 cells were transfected with siRNAs against Atg-5 and Atg-7. After 24 hours, they were placed in normoxia or hypoxia. Lysates harvested after 48 hours for immunoblot analysis (C) (quantification under each blot normalized to actin, followed by normalization to NT in normoxia), or the cells were analyzed after 72 hours by annexin V/PI flow cytometry (D) (3 biological replicates; 2 technical replicates). (E-F) MOLM-13 cells were treated with CQ (E) or Baf A1 (F) for 48 hours in normoxia or hypoxia and analyzed on a Seahorse XF analyzer. Representative MitoStress Test profiles and average maximal respiration for cells are shown (2 biological replicates; 3 technical replicates). (G-H) MOLM-13 cells were treated with CQ (G) or Baf A1 (H) for 48 hours, stained with MitoID, and analyzed by flow cytometry (3 biological replicates; 2 technical replicates). Data are shown as average mean fluorescence intensity (MFI). (I) MOLM-13 cells were harvested after a 48-hour treatment with 10 µM CCCP, 50 µM CQ, or 25 nM Baf A1 and blotted for PINK-1. The levels were determined by densitometric analysis and normalized to actin. Values are shown relative to DMSO. (J) MOLM-13 cells were treated with 10 µM CCCP or 50 µM CQ, alone or in combination in normoxia or hypoxia for 72 hours, and analyzed by annexin V/PI flow cytometry (3 biological replicates; 2 technical replicates). Error bars represent ± standard deviation. *P < .05; **P < .01; ***P < .001; ****P < .0001.
Figure 5.
Figure 5.
Hypoxia reduces chemosensitivity in AML cell lines, which can be restored with autophagy inhibition. The indicated AML cell lines were treated with Ara-C (100 nM HEL-Luc, 250 nM HL60, and MOLM-13 in normoxia (21% O2) or hypoxia (1% O2). Concentrations were determined based on cell line sensitivity to Ara-C. (A) Cells were processed after 72 hours for measurement of apoptosis by flow cytometry with annexin V/7-AAD or PI staining. Data are shown as a percentage of annexin V– and/or 7-AAD– or PI-positive cells normalized to untreated cells (≥3 biological replicates; 2 technical replicates). (B) HEL-Luc cell lines were treated with 100 nM Ara-C for 72 hours, and the total number of cells was quantified (4 biological replicates). (C) HEL-Luc cell lines were treated with 100 nM Ara-C, and phospho-H2A.X flow cytometry was performed after 48 hours. Data are shown as the MFI of p-H2A.X staining normalized to untreated in normoxia (2 biological replicates). (D-E) MOLM-13 and HL60 cells were treated with 250 nM Ara-C in normoxia (21% O2) or hypoxia (1% O2) in combination with bafilomycin A1 (Baf A1; 2 nM) (D) or chloroquine (CQ; 25 µM) (E). The cells were processed after 72 hours for apoptosis flow cytometry, using annexin V/7-AAD or PI staining. Data are shown as a percentage of annexin V– and/or 7-AAD– or PI-positive cells (3 biological replicates; 2 technical replicates). Error bars represent ± standard deviation. *P < .05; **P < .01; ***P < .001.
Figure 6.
Figure 6.
A combination treatment of Ara-C with Baf A1 leads to enhanced antileukemic activity. NSG mice were injected via tail vein with luciferase-transfected MOLM-13 cells. Mice were divided into groups of 5 animals and treated with vehicle (DMSO), Ara-C (60 mg/kg per day: 5 days on, 4 days off, 5 days on), Baf A1 (1 mg/kg 3 times a week every other day for 21 days), or in combination. (A) Whole-animal bioluminescence imaging on day 14 after treatment. (B) Quantification of bioluminescence shown as average total photon flux per second on days 14 and 21 after treatment initiation. Error bars represent ± standard deviation. *P < .05, **P < .01.

Similar articles

Cited by

References

    1. El Rassi F, Arellano M. Update on optimal management of acute myeloid leukemia. Clin Med Insights Oncol. 2013;7:181-197. - PMC - PubMed
    1. Shlush LI, Mitchell A, Heisler L, et al. . Tracing the origins of relapse in acute myeloid leukaemia to stem cells. Nature. 2017;547(7661):104-108. - PubMed
    1. Hourigan CS, Karp JE. Minimal residual disease in acute myeloid leukaemia. Nat Rev Clin Oncol. 2013;10(8):460-471. - PMC - PubMed
    1. Hope KJ, Jin L, Dick JE. Acute myeloid leukemia originates from a hierarchy of leukemic stem cell classes that differ in self-renewal capacity. Nat Immunol. 2004;5(7):738-743. - PubMed
    1. Paietta E. Consensus on MRD in AML? Blood. 2018;131(12):1265-1266. - PubMed

Publication types